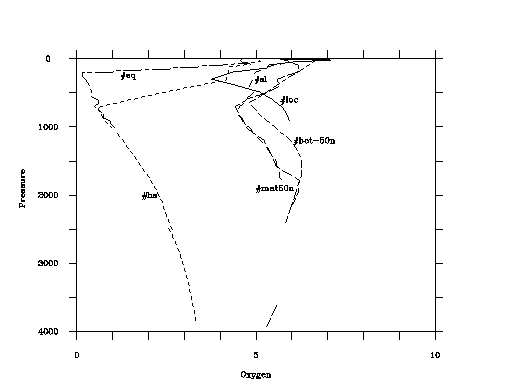

The commands which created the plot are
window 0 4000 10 0
   [sets lower left and upper right corner]
axis x 2 Oxygen 5 dd
   [draws x axis with tic mark at 2 units and label at 5 units
    format is two digits]
axis y 500 Pressure 1000 dddd
dash "#loc" o2 press ----------------
   [draws first line using object #loc, x variable "o2",
    y variable "press", and dash pattern indicated, in this
    case solid]
dash "#sl" o2 press ----....----....
dash "#mat50n" o2 press ------..------..
dash "#hs" o2 press --..--..--..--..
dash "#bot-50n" o2 press ----..--..----..
dash "#eq" o2 press ----------..--..
This shows a single program dash requesting ``o2'' and ``press'' data from each object and displaying it with the specified dash pattern. The objects are
| Object | Location | Machine Type | Storage Method |
|---|---|---|---|
| #loc | MIT | Sun | flat ASCII file |
| #sl | RSMAS | Alpha scaled binary integers | |
| #mat50n | MIT | Sun | MATLAB binary floating point |
| #hs | WHOI | Sun | multiple files/directories |
| #bot-50n | MIT | Sun | multiple files |
| #eq | U. Chicago | IRIX | Single file/ multiple stations |