
Interannual Wind-induced Water Transport over Georges Bank:
Analysis on MM5 Output
Analysis on MM5 Output
SCHOOL FOR MARINE
SCIENCE AND TECHNOLOGY
UNIVERSITY OF
MASSACHUSETTS DARTMOUTH


Song Hu1, Changsheng Chen1, Bob Beardsley2
1 School
for Marine Science and Technology, University of Massachusetts-Dartmouth
2
Department of Physical Oceanography, Woods Hole Oceanographic Institution

The
Monthly Averaged Ekman Transport


Abstract:
The wind-induced Ekman transport was estimated using the
1995
and 1999 meso-scale wind fields predicted by the Gulf of Maine/Georges Bank MM5 model. By choosing a 100-m isobath as a boundary of Georges Bank closed with a straight line along 69o to west, the wind-induced Ekman transport show a significant interannual variability in 1995 and 1999. For example, the monthly averaged Ekman transport was dominantly southward in February 1995 but it was westward in February 1999, westward in March 1995 but southwestward in March 1999. This interannual variability of the wind field is believed to be directly related to the interannual differences of the timing and intensity of the phytoplankton bloom in these two years.
and 1999 meso-scale wind fields predicted by the Gulf of Maine/Georges Bank MM5 model. By choosing a 100-m isobath as a boundary of Georges Bank closed with a straight line along 69o to west, the wind-induced Ekman transport show a significant interannual variability in 1995 and 1999. For example, the monthly averaged Ekman transport was dominantly southward in February 1995 but it was westward in February 1999, westward in March 1995 but southwestward in March 1999. This interannual variability of the wind field is believed to be directly related to the interannual differences of the timing and intensity of the phytoplankton bloom in these two years.
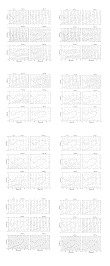
Fig. 1 The MM5 Domain on Georges Bank
Fig. 2 The Schema of MM5 Structure


The Wind-induced Net Water Transport on Georges Bank
Fig. 4 An area
was defined by choosing a 100-m isobath as a boundary of Georges Bank closed
with a straight line along 69 degree longitude to west The water in and
out of the area was calculated by the wind stress data.
Fig.
3 The monthly averaged Ekman water transport

0.021
0.013
0.02
0.013
0.016
0.031
0.045
0.009
0.037
-0.033
-0.015
0.06
1999
-0.032
0.035
0.025
0.041
0.029
0.018
0.014
0.059
0.047
0.043
0.009
-0.01
1995
Dec
Nov
Oct
Sep
Aug
Jul
Jun
May
Apr
Mar
Feb
Jan

Table
1. The monthly averaged net Ekman transport over the closed area (Units: Sv)


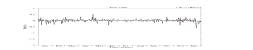
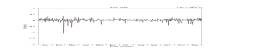
Fig.
5 Black: the 40-hour low pass filtered net Ekman transport over the closed GB
area; red: the monthly averaged net Ekman transport over the closed GB area;
three large water exchange events in 1999