SST OA time series
Shelf Break

Direct estimate of
spatial correlation

31
31
31 grid cells = 270km
3 OI iteration-reach the convergence
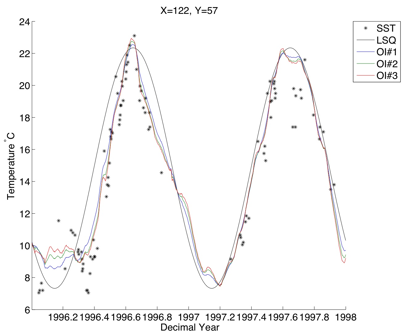
| In the upper left is a time
series of the available data at this location near the shelf break. The black
curve is the average seasonal fit at this location from 1985 to 1999. The
blue, green and red lines represent successive iterations of the Barnes scheme
to estimate sst. The value has converged to a best estimate in most locations
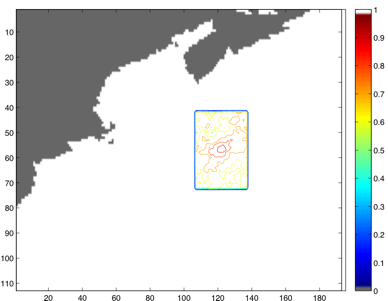
with only two iterations. In the lower right figure, contours of sst
correlation are shown for this location. Due to the large size of the full
correlation matrix, the correlation is only estimated for the 15 nearest
neighbors in every direction resulting in the 31X31 array contoured here.
Notice the correlation is anisotropic, roughly following the shelf break. The
OA estimate is calculated as a weighted sum of the available data in a fixed
region of space and time. The spatial weighting is set by the estimated
stationary anisotropic inhomogeneous correlations calculated from the data.
In this case the temporal weighting is a 21 day Gaussian window. |