•
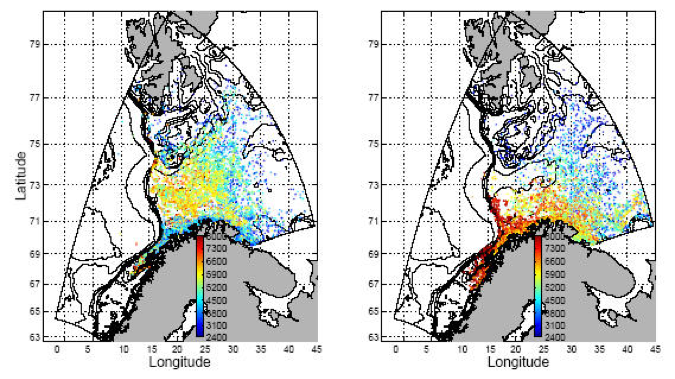
Figure 11.
Simulated distribution of O-group cod in 1985 (left) and 1986 (right).
Colors indicates weight.
From Vikebø et al (2005).