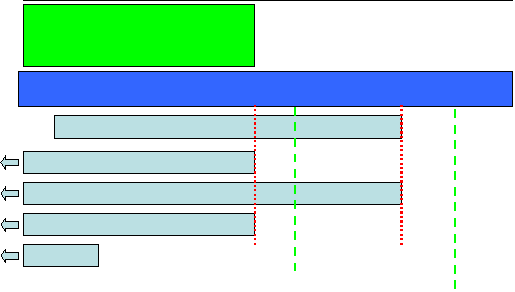

NeCOFS Model
Flow Diagram: 1.0
Stage: 1 (midnight)
Crontab starts NeCOFS
wrf forecast data
wrf hindcast data
fvcom data (results)
river data
sst data
Day#
-10 -5 -4
-3 -2 -1
0 1 2 3
Day 0 ~ now
Current Process
1:
2:
3:
(Previous
Hindcast)
(Previous
Forecast)