|
|
|
I seem to have them
waking up, just a little bit early…..I also don’t quite have that second bump
later on, likely it’s the climatology I’m using to force the model…or some
slight parameter tweaking…..but I am prety encouraged by this.
|
|
The abundance graph
is hiding up underneath the real data…drag my fig down if you want to see
it….but since my model is somewhat artificially capped at 1000 individuals, I
am not sure how much stock to put in the absolute relative numbers.
|
|
|
|
This now has the
same parameters as the RIM station on next graph.
|
|
My females here seem
to be waking up a bit early.
|
|
I am also not
catching that second bolus of animals around 275.
|
|
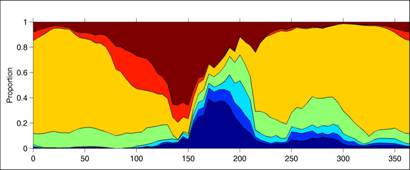
What I am showing
here is on year three.
|
|
On year 2, actually,
it looks lore like the real data. Which is interesting.
|
|
My conclusion is
that if forcing stays the same, year after year, the population becomes a
little more stretched out, I.e. not such synchronus cohorts.
|
|
BUT, when things
change from year to year, this tends to drive the population back towards
cohorts. (the tails of the pop dist. Get trimmed).
|
|
At least, this is my
hypothesis.
|
|
|