
Acknowledgements
We gratefully acknowledge the superb assistance provided by the Officers and Crew of the RV/ALBATROSS IV. The very professional and friendly atmosphere made our research effort run smoothly and efficiently, and enabled the scientific party to achieve its goals and objectives.
This cruise was sponsored by the National Oceanographic and Atmospheric Administration and the National Science Foundation.
Shipboard ADCP (Acoustic Doppler Current Profiler) measurements
Zooplankton and Ichthyoplankton studies based on MOCNESS tows
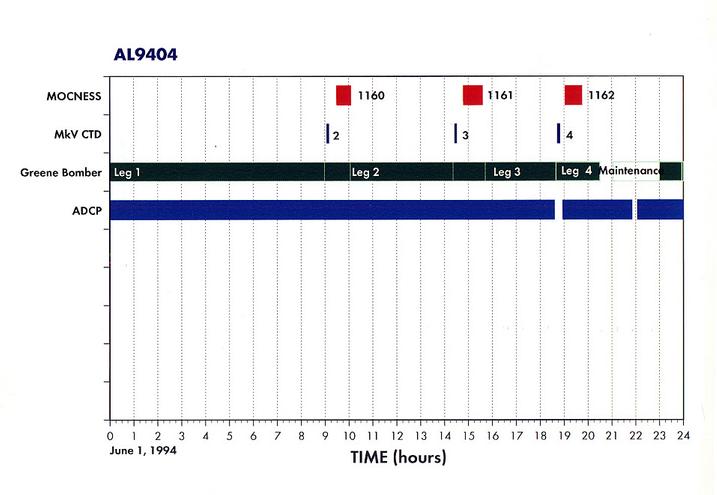
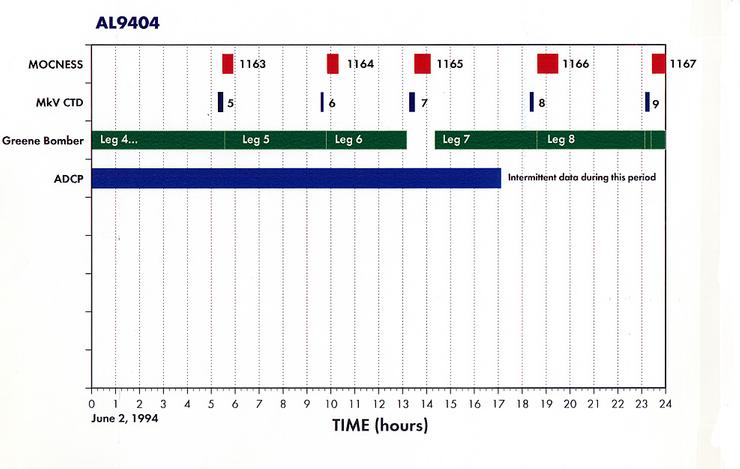
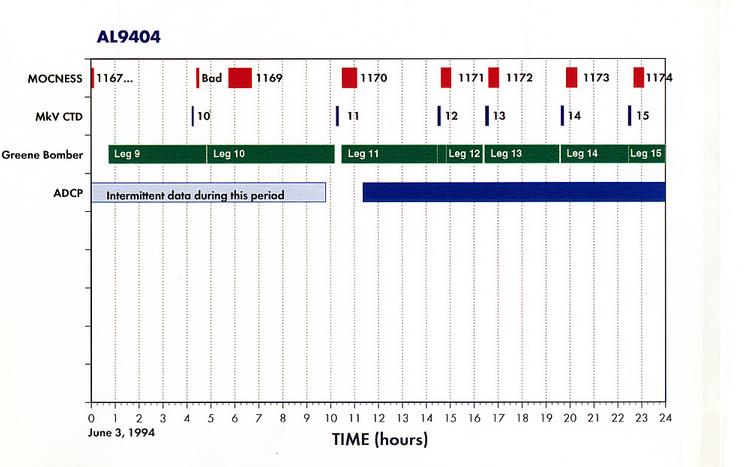
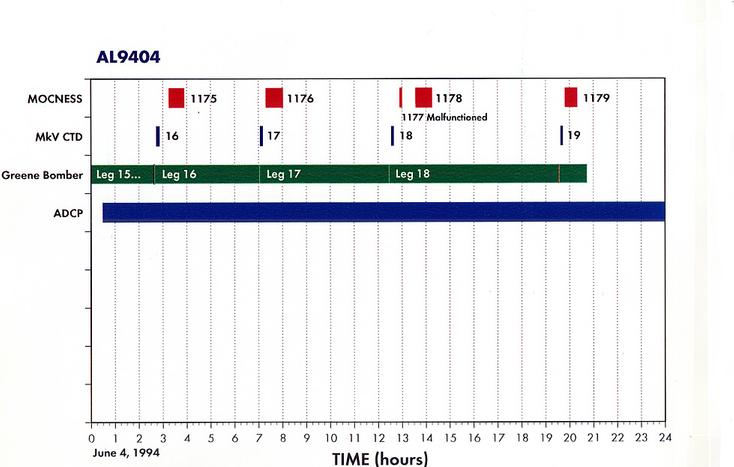
Appendix 1. Data Inventory - List of Underway and Station Activities
Appendix 2. Summary of Organisms seen in MOCNESS hauls for AL9404
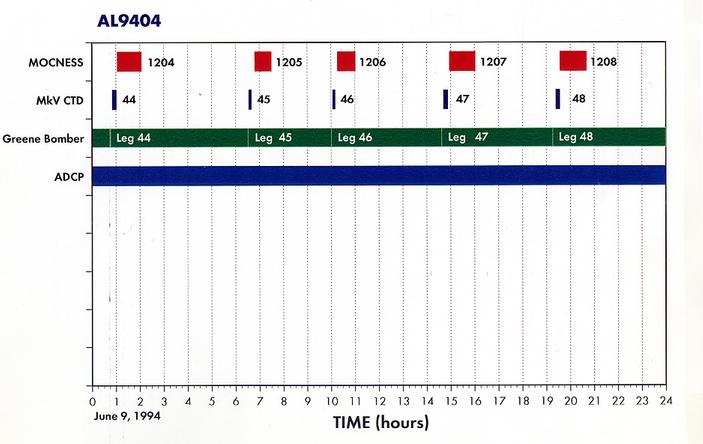
Appendix 3. List of Greene Bomber Transects and Associated Measurements
The first official field work of The U.S. GLOBEC Georges Bank Program began in Spring of 1994 and this cruise aboard the R/V Albatross IV was the third in the series. Two earlier cruises on this vessel were devoted to process work on the Southern Flank of Georges Bank and nearby well mixed areas on the top of the Bank. A companion vessel, R/V Columbus Islein, was conducting process work in this same area during the period of this cruise. Our effort was mainly devoted toward developing a Bank-wide context for the process work being conducted by the researchers on the other vessels. Our specific objectives were:
The work was a combination of station activities and underway activities. The alongtrack work consisted of high frequency acoustic measurements of the volume backscatter of plankton and nekton throughout the water column and surface measurements of temperature, salinity, and fluorescence. The ship's ADCP unit was used to make continuous measurements of the water current profile under the ship, in order to construct the current field over the whole Bank. These data will be used to help in the interpretation of all the other observations made on the cruise.
The cruise track was determined with the aid of computer simulations of the flow field on Georges Bank for the period May/June which were run before the cruise to determine the approximate number and placement of the stations and the trackline to be used to get from one station to another. The simulations were conducted at Dartmouth College by Dan Lynch and coworkers. The stations and trackline were set so that when the effects of the flow around the Bank was removed, the position of the stations and tracklines would provide an optimal sampling of the Bank (within the limits of the shiptime provided). The entire Bank including parts that are in Canadian waters, were surveyed (Figure 1).
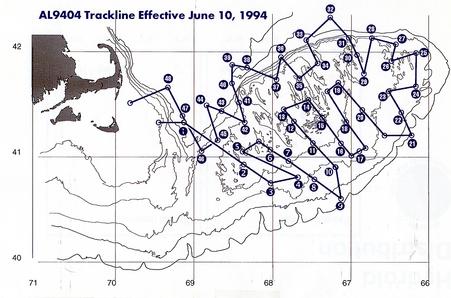
Figure 1. R/V Albatross Cruise 9404 (31 May to !0 June, 1994) trackline and station positions.
At each of 48 stations, a CTD-Fluorometer profile to the bottom was made and rosette bottles collected water samples for salinity calibration, chlorophyll, phytoplankton species counts, and O16/O18 water analysis. Following the CTD, a 1-m2 MOCNESS was towed obliquely between the surface to the bottom with two nets opened/closed on the way to depth and three to four nets opened/closed on the return to the surface.
Upon leaving Woods Hole at 1600 hrs on a sunny but windy afternoon, the Albatross IV steamed to the Northwestern portion of the Great South Channel to begin the broad-scale survey. The first station came about six hours into the cruise and was used to test the gear and train those unfamiliar with its operation. The trackline during the first three days went across the Great South Channel to the southwestern part of the Bank where a series of long transects perpendicular to the bathymetry and shorter connecting transects were run. A typical mix of shelf water species were collected in the MOCNESS net tows. At the top of the Bank in well mixed water, small copepods (Centropages sp., Pseudocalanus sp.) were dominant with some Calanus finmarchicus present. Also present were large numbers of hydroids (Obelia sp.? ), filamentous algae (alias "green munge"), shelled bivalve larvae, and on occasion substantial numbers of polychaete larvae. On the southern flank, the species composition became more dominated by Calanus finmarchicus, and sporadically pteropods, euphausiid larvae and juveniles, chaetagnaths, amphipods, and large parasitic isopods. The water temperature on the Bank was 7-10o C, with salinities of 32.5 to 33.5 PSU. On June 2, the first off-Bank Station (#9) in the Slope Water was reached where the surface temperature was >14o C and salinity >34 PSU. There was an acoustical transition from shelf water to Slope Water in which high volume backscattering at the surface gave way to lower overall volume backscattering and a sub-surface maximum. Lower densities of zooplankton were encountered on the Slope Water side of this feature and the most noticeable animals were adult euphausiids, Meganyctiphanes norvegica, and copepods typical of the temperate offshore waters.
During the next three days, the eastern half of the southern flank of the Bank was surveyed. In this area, plankton biomass increased, but the basic pattern of species composition remained similar. Smaller species of copepods and green munge dominated the samples at the top of the Bank and Calanus was more important in the deeper waters of the flank. During the first few days of the survey along the southern flank, the greatest number of fish eggs and larvae were encountered, although the overall quantity was still low. The dominant fish larva was Hippoglossoides platessoides (American plaice), and a few older Gadus morhua (cod), and Melanogrammus aeglefinus (haddock) were present. Towards the east and north, the quantity of larvae decreased and virtually no cod, haddock, or plaice were present. A few other fish larvae (Cottidae, Liparids, Agonids, Gadids, Scombrids) were occasionally present in the samples.
A second excursion out into the Slope Water provided another view of the transition at the shelf/slope break. The change in acoustic structure was similar to that observed on our excursion to Station 9. In the vicinity of Georges Canyon, densities of the plankton were substantially lower and a broader diversity of forms were collected. These included a number of euphausiid species, amphipods, copepods, squid and lobster larvae, and temperate fish species.
On return to the Bank at the start of northeast peak portion of the survey, most of the MOCNESS tows returned with phenomenally large collections of Calanus finmarchicus. The cod-end buckets of the nets were filled to overflowing with the dark reddish bodied copepods, especially near the surface. Calanus so dominated some of the samples that our first impression was that the samples were mono-specific i.e. no other species were present. In fact, small numbers of pteropods, chaetognaths, amphipods, jellyfish, and fish larvae were also present. During the period of 4 to 6 June, when this work was taking place, the winds were non-existent, the skys nearly cloud free, and the sea surface was glassy. A number of large whales (fin backs and humpbacks?), many porpoises, some basking sharks, and a seal were observed throughout the area.
In the early morning hours of 6 June, we completed the most easterly station (#25) on the northeast peak and began working back towards the west along the northern half of the Bank. During the evening hours of that day, the weather began to deteriorate, and the winds and seas began to build. By early morning on 7 June, strong winds (20 to 25 kts with gusts over 30) made seas rough (1.5-2.5 m waves) and working conditions uncomfortable. The quality of the acoustical and ADCP survey data was significantly reduced, but the MOCNESS tows and CTDs were successfully completed. A third off-Bank station (# 32) was made in the deeper waters of Georges Basin. The MOCNESS tow caught about the same quantity of plankton as on the shelf and Calanus dominated at all depths. There were other species present (Myctophid fish, the euphausiids, Meganyctiphanes norvegica, Thysanoessa sp., the copepod, Euchaeta norvegica, and pteropods) some of which did not usually occur on the Bank.
During the high winds and seas, the stratified net tow data collected on the Bank showed a marked reversal in the vertical distribution of the plankton with much lower concentrations found at the surface than deeper. In this northern portion of the northeast peak, very large concentrations of C. finmarchicus continued to be encountered.
The last two days saw a return to calmer weather and smoother seas. The work continued around the clock and patterns in the distribution of biomass and species were repeated as we made our way west towards the Great South Channel along the northern portion of the Bank. On the afternoon of 8 June, what appeared to be large shoals of herring dotted the surface of the sea in the area between stations 40 and 41. Many whales (finbacks and possibly some humpbacks) were observed blowing and broaching the sea surface. Birds were working the areas around the whales. It was a spectacular show! The region was characterized by high volume scattering at the surface, and large collections of C. finmarchicus in the surface MOCNESS samples. The previous 36 hours were marked by the absence of any sightings of marine mammals in spite of high surface concentrations of Calanus.
Much of the last work day at sea (9 June) was spent in the Great South Channel and southern Wilkinson Basin. Periodically shoals of herring and whales were observed. Large concentrations of C. finmarchicus were encountered in surface waters, especially at station 48. This area was marked acoustically by large internal wave structures.
By all accounts, the cruise goals and objectives were met. This marks the first time a Bank-wide series of stratified zooplankton collection have been made since the late 1930's and early 1940's (by D. Bumpus, G. Clarke, and others). It also marks the first time a complete bioacoustical survey of the Bank has been done. The newly installed ADCP worked well for most of the cruise and there were only minor equipment problems with MOCNESS and Greene Bomber. The net tow collections have been preserved in such a way that a wide variety of techniques for analysis can be applied to them (i.e. biochemical, genetic, and traditional counting). The integrated nature of the physical, acoustical, and biological data collected on this cruise will enable us to effectively pursue the questions posed by this project and represents a successful start to the U.S.GLOBEC broad-scale survey portion of the Georges Bank Program.
The hydrographic sampling on this cruise was done using a MKV CTD unit with a rosette water sampler. The instrument provides profiles through the water column of temperature, salinity, density and fluorescence. The fluorescence data is an indication of the amount of chlorophyll in the water. The primary objective of the hydrography was to determine the horizontal and vertical distribution of the basic water properties - temperature, salinity and density.
Water samples were taken with the rosette sampler for four uses. The first provided samples to calibrate the salinity measured by the CTD and the second was for determining the amount of chlorophyll in the water to calibrate the fluorometer. The determination was done by filtering the water samples from three depths to collect the phytoplankon on filters, for later analysis of the chlorophyll content on shore. The filtering was done for total chlorophyll and for two size fractions, >20 um and < 20 um. The third use for water samples is for identifying the species composition of the phytoplankton community that contribute the measured chlorophyll. The fourth program requiring water samples is for determining the oxygen isotope ratio in the water. The ratio of O18 to O16 in the water is an indication of its origin - at what latitude the water was precipitated from the atmosphere as rain. The request for the isotope water samples was received after leaving port. The samples are to support a recently funded NSF project at the Lamont-Doherty Geological Observatory.
Characteristically the shallower regions on Georges Bank are kept well mixed by the strong tidal currents. In the deeper areas where the mixing is less intense, surface warming in the spring and summer causes a stratification within the water column with warmer, lighter water in the near surface layers (Figure 2). Along the southern edge of the bank is the shelf/slope front, a sharp boundary between the cooler, low salinity waters on the bank and the warmer, saline oceanic Slope Water to the south.
The observed hydrographic conditions were similar to those expected. In the shallow regions of the bank with water depths less than about 50m, the water column was well mixed (top to bottom density difference < 0.2 sigma-t units - Figure 3). Over the deeper portions of the bank, seasonal stratification was developing, with the warming of the surface layer. At the stations along the southern edge of the bank, with water depths of greater than about 75m (stations 3, 4, 8, 10, 17, 22), the shelf/slope front was observed encroaching onto the bank at depth (Figure 4). The presence of the front was evident by an increase in the temperature and salinity toward the bottom (see figures of bottom temperature and salinity). The depth at which the front was observed varies from 20m at station 10 to 70m at station 3. Stations 9 and 21 were in the Slope Water south of the shelf/slope front.
The surface salinity distribution indicates an increase in salinity from the northwest (southwestern Gulf of Maine) across the bank to the south east (Figure 2). This may reflect the spring freshening of the Gulf of Maine surface waters entering onto the northern side of Georges Bank and progressing clockwise around the bank with the mean circulation. In the northeast peak region lower surface salinities were encountered at the eastern most stations 24 and 25 than at the surrounding stations. This may be due to influx of water from the Scotian Shelf, although further analysis will be needed to confirm this.
Two stations were occupied off the northern flank of the Bank in the deep waters of Georges Basin (station 32) and Franklin Basin (station 39). Both showed the presence of Slope Water at depth (Figure 4). Station 32 had salinity >35 PSU below 150m, indicating pure Slope Water that had entered the Gulf of Maine through Northeast Channel. At station 39, the salinity near bottom (>180m) was 34.38 PSU, indicating the intrusion of Slope Water at least that far to the west. These bottom salinities seem unusually high, and may be related to a ring-like feature observed in satellite imagery at the mouth of Northeast Channel pumping warmer, more saline Slope Water through the Channel.
The fluorescence data showed a characteristic difference between the well-mixed and stratified water columns (Figure 5 - upper panel). Where the column was well-mixed, the fluorescence was highly variable, but with no trend over the column. In stratified columns, the fluorescence usually had a subsurface maximum associated with the pycnocline. The highest surface values were in a wide region on the central-eastern part of the bank (see figure of surface fluorescence). This region was approximately where the green munge was observed in the MOCNESS nets.
The fluorescence data showed a difference between the up and down traces. The ratio of the average fluorescence value on the up cast to that on the down cast was spatially coherent. In the central, well-mixed region the ratio was generally > 1, while in the deeper, stratified region it was <= 1 (Figure 5 - lower panel). This up/down bias also was observed during the 1993 GLOBEC/MER cruise. The cause of this up/down bias is not known. It could be related to a different phytoplankton species composition in the two regions and to their response to turbulence around the fluorometer sensor caused by the CTD instrument on the up casts. The bias also could be caused by some instrument artifact associated with an effect of temperature or temperature gradient on the sensor. More analysis will be needed to determine the source of the bias.
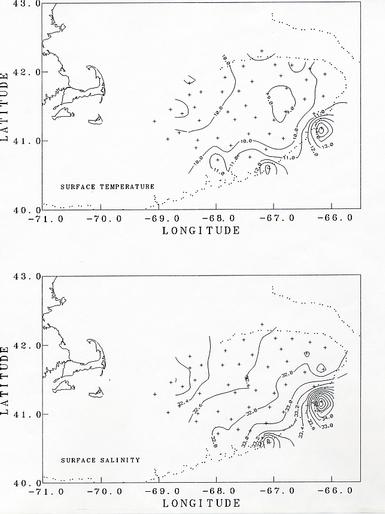
Figure 2. The distribution of surface temperature (upper) and salinity (lower) as measured on CTD casts.

Figure 3. The distribution of stratification, as indicated by the difference in sigma-t between 50m and the surface.
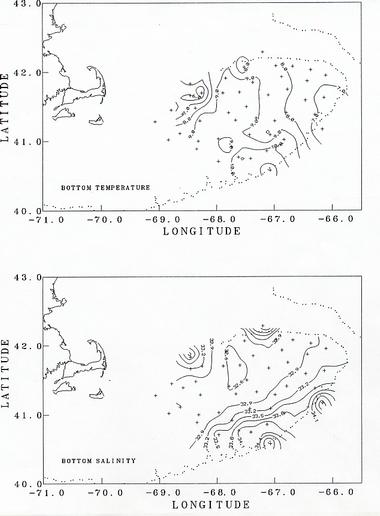
Figure 4. The distribution of bottom temperature (upper) and salinity (lower) as measured on CTD casts.
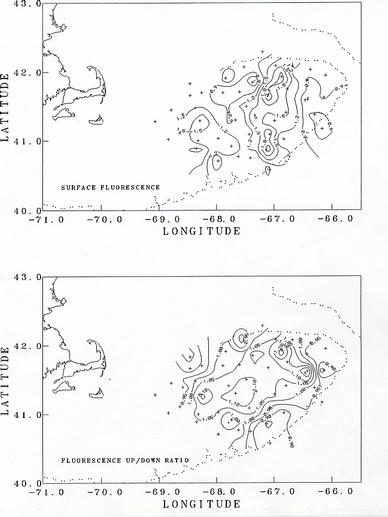
Figure 5. (Upper) Distribution of surface fluorescence as measured on CTD casts.
(Lower) Distribution of the ratio of the water column average fluorescence values on the up casts to
that of the down casts.
Shipboard ADCP (Acoustic Doppler Current Profiler) measurements (J. Candela).
Throughout the cruise, water current measurements were obtained using the 300 kHz Broad Band RDI ADCP mounted on the hull of the ship. This instrument is capable of giving continuous underway measurements of the current profile under the ship. The instrument was programmed to measure with a vertical resolution of 2 m, from 10 m depth to about 10 m from the bottom or up to a depth of about 120 m, which ever was shallower at a given location. The current profiles consisted of data averages every 60 s. Transformation to geographical North and East current components was performed using real time gyro information fed into the ADCP from the ship's navigation instrumentation. Also fed to the instrument was real time GPS positioning which was stored directly in the minute average profile data files. In principle, the ADCP measures currents with respect to the ship, therefore, the ship's motion needs to be removed from the current observations to obtain the water current with respect to the Ocean bottom. In all the data gathered during this cruise, the ship's motion was removed using the bottom track (BT) velocity measured by the same ADCP instrument, which is capable of performing this measurement in water depths shallower than 200 to 230 m, depending on sea state conditions. In places where BT is lost, accurate navigation can be used to remove the ship's velocity from the current data.
The objective of these ship-board ADCP current measurements is to be able to construct the prevailing current field over the whole Bank during the cruise. This field will help in the interpretation of the hydrographical, biological and other acoustic measurements.
The flow field over the Bank is complex. Strong semidiurnal tidal currents dominate the high frequency (< 1cpd) variability and a persistent subinertial clockwise circulation, the result of a tidal rectification process, is a conspicuous feature of the circulation over the Bank. However, common energetic weather events, changes in stratification of the Bank waters, and strong interaction with off-the-Bank subinertial motions (like warm-core rings, shed by the Gulf Stream, impinging on the Bank's southern flank) can appreciably distort the circulation pattern at any one moment.
The ADCP data gathered during the cruise is generally of good quality. Figure 6 shows the locations of the half hourly averages obtained from the minute value profiles measured during the cruise and Figure 7 displays the vertically average horizontal current vectors at each location. The magnitude of the observed vertically average currents over the Bank can reach values in excess of 1 m/s and their general pattern, although apparently incoherent at first sight, turns out to be mainly harmonic in character. To evaluate this assertion, the total observed field in Figure 7 was decomposed into three parts, 1) a semidiurnal tidal current field, that can have "smooth" spatially varying magnitude and phase, but is otherwise harmonic in nature with a period 12.42 hours, corresponding to that of the principal semidiurnal tidal constituent (M2), 2) a steady current field which is allowed to vary smoothly spatially, but is considered not varying in time over the length of the cruise, and 3) a current residual field that consists of the remaining current variability not explained by 1 and 2. The fitted semidiurnal tidal currents (Figure 8) represent about 75 % of the variability in the total observed field of Figure 6. The magnitude of the fitted steady currents in this field are around 0.10 m/s (Figure 9 - note change of scale with respect to the other plots), however, they are arranged according to the expected clockwise subinertial circulation around the Bank. This steady field only accounts for about 4 % of the observed vertically average current variability. The unexplained part of the observed current field represents as much as 20 % of the observed current variability and consists of observational errors and unresolved tidal contributions, unsteady events maybe related to the varying weather conditions during the cruise, and in general to other small scale processes not considered in this very simple analysis (Figure 10).
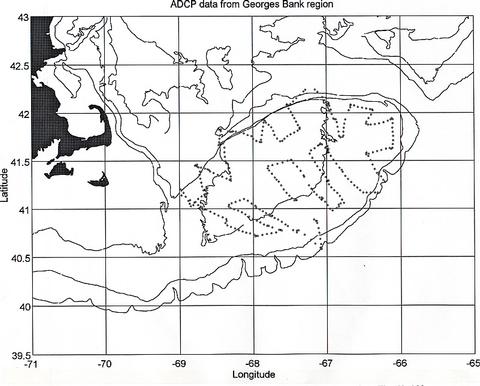
Figure 6. Location of half hourly averages of currents obtained during the cruise. The 60, 100 and 200m isobaths are shown.
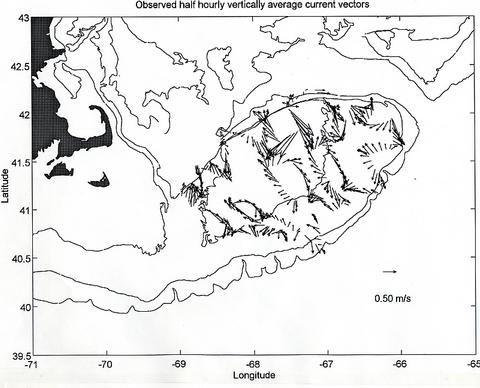
Figure 7. Observed half hourly vertically averaged current vectors. The current scale is indicated in the lower right hand corner.
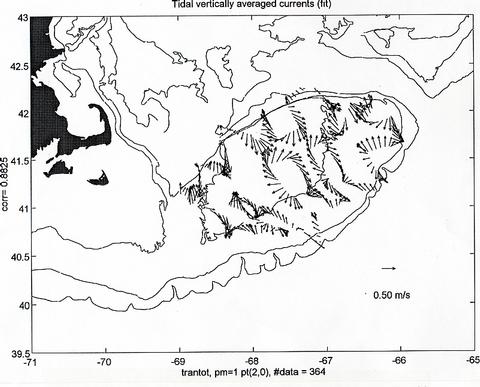
Figure 8. Fitted semidiurnal current field obtained by allowing a second degree polynomial spatial dependence in east and north current components and a harmonic time variation at the M2 tidal frequency. This tidal field explains about 75% of the variability in the observed field of Figure 7. The number of observations used, as well as the fit's correlation coefficient are indicated at the margins of the figure.
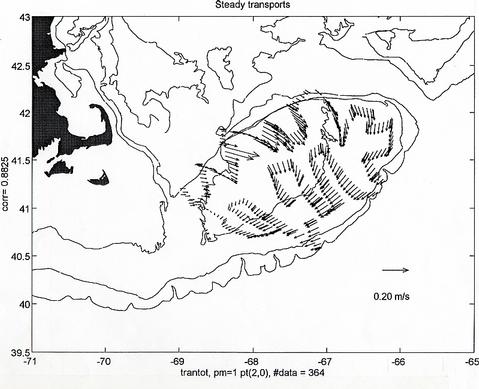
Figure 9. Fitted steady current field obtained by allowing linear spatial dependence of the east and north current components. This steady field only accounts for about 4% of the observed variability in Figure7. Note the change of scale with respect to the previous figures.
Figure 10. Residual currents obtained after removing the tidal (Figure 8) and steady (Figure 9) fits from the observations of Figure 7. This unexplained current field represents as much as 20% of the variability of the observed currents during the cruise.
NOTE:
For the first two and a half days (May/31-June/2) of the cruise, the data gathered by the ADCP were quite noisy. We tried different data acquisition configurations for the instrument to remedy the problem, but without much success. Fortunately, during a casual conversation over lunch on June 3, it was brought to our attention that on the previous cruise it had been noticed that the AMETEK (415-D) Doppler speed logger used on the ship had interfered with the ADCP data acquisition. We tested turning off the AMETEK speed logger and found a very appreciable increase in the quality of the ADCP data acquired. The ADCP data quality was also noticed to be dependent on the sea state deteriorating considerably in rough sea conditions.
Zooplankton and Ichthyoplankton studies based on MOCNESS tows
A 1-m2 MOCNESS equipped with 0.335 mm mesh was used to make depth specific collections of zooplankton over the Bank. The electronics package used to control the opening and closing of the nets and to acquire environmental data was a newly designed 14-bit system. This system is architecturally distinct from the older 12-bit MOCNESS electronics; it uses a SAIL (Serial Ascii Interface Loop) module protocol and structure to enable communications between the underwater electronics package mounted on the net and the deck unit Surface control is entirely through a Visual Basic program running in Windows on a microcomputer. The environmental sensors measured pressure, altitude (acoustically), temperature, and salinity. The sample rate of environmental data was 4 seconds.
Oblique tows through the water column were made from within 10-15m of bottom or to a maximum depth of 400m. Samples were collected on both the down and the up portions of the tow. The intervals sampled on the down haul were 0-20, 20-maximum depth on the down haul, and on the up haul, maximum depth (no deeper than 400 m) to 100m, 100m to 40m, 40-15 m, and 15-0 m. Vertical tow rates were 10m/min when fished between 400-100m, 5m/min for depths between 100-40m and 2m/min at depths less than 40m. Upon completion of the tow, nets were rinsed with sea water.
Collections were made at all 48 stations (40 stations on the Bank, 2 stations in the Slope Water, 5 stations in the Gulf of Maine, and 1 on Nantucket Shoal). Most of the samples were preserved in formalin for later laboratory measurement of biovolume and silhouette analysis of taxonomic composition and size frequency structure. Some invertebrates and fish that are likely predators of the larval/juvenile fish and/or of copepods were separated, examined and preserved for analysis of gut contents. Larval and juvenile cod and haddock and other fish larvae were sorted from the samples and preserved in alcohol for otolith analysis or frozen for biochemical analyses. Selected samples were size fractionated for invertebrate composition.
Ann Bucklin's group has taken samples from the one or two nets fired on the descent. After some experimentation, it was decided that the first net would sample the top 20 m and the second net would sample from 20 meters to the bottom of the haul. On the southern and northern flanks of the Bank, we have seen truly astonishing numbers of the copepod, C. finmarchicus. Each haul yielded one-half to one gallon of this species
Large volumes of the copepod, C. finmarchicus, were isolated by size-graded sieving of the surface sample; the 1000 um screen collected almost pure samples of the copepod. This size fraction was either frozen in liquid nitrogen, preserved in buffer for later DNA extraction, or preserved in 95% ethyl alcohol for long-term storage. Approximately 1000 ml of copepods, very nearly all C. finmarchicus, have been frozen for later molecular analysis. A similar amount was frozen at -20oC for possible biochemical analyses or, at worst, aquarium fish food. The extremely large volume of tissue collected will allow us to experiment with new molecular approaches in the analysis of population structure in this species.
Greg Lough's and Wally Smith's groups processed the MOCNESS samples collected while the MOCNESS was being hauled to the surface. Once in the lab, the samples were sieved through a 333 um mesh screen and then sorted for fish larvae. Gadus morbua (cod), Melanogrammus aeglefinus (haddock) and Hippoglossoides platessoides (American plaice) were preserved in 95% EtOH for age determination using otolith analysis. The remainder of the sample was preserved in a 5% formalin solution for analysis of biomass and species composition.
Several species of fish eggs were seen in samples collected along the southwest portion of the Bank, but not found in other areas sampled. Of the few larvae collected, American plaice were most abundant on the southern portion of Georges Bank. Older specimens of cod and haddock were collected along the southern flank of the Bank. Few specimens were seen in samples collected at stations to the East and North. At stations where there was Slope Water influence, the fish assemblage consisted primarily of myctophids and gonostomatids. On the northeastern portion of the bank cottid, scombrid, gadid, agonid and liparid larvae were collected in small numbers (one or two per haul). On the Northwestern portion of the bank, samples contained older cod and haddock larvae.
Qualitative information was assembled while the samples were being sorted and preserved (Appendix 2). To illustrate the distributions of some of the plankton collected by MOCNESS, this information was used to estimate the relative size of the catches of particular plankton species. In general, samples examined for species composition were dominated by copepods, particularly Calanus finmarchicus. Large volumes of C. finmarchicus were collected in many of the hauls on the margins of the northeast peak and the Northwestern portion of the Bank adjacent to the Wilkinson Basin and Great South Channel (Figure 11). Filamentous green algae, which caused clogging of the nets, was characteristic of the shallower portions of the Bank (Figure 12). The hydroid, Obelia spp., and a number of benthic and demersal species (including the hydroid Obelia sp.,. gammarid amphipods, isopods, post-larval bivalves, cumaceans, polychaete worms (e.g., Nereis sp.), and terrebellid flatworms) were associated with the algae. Among copepods, Centropages typicus, dominated on top of the Bank. Pseudocalanus spp. was common in many of the samples, but varied in relative abundance (Figure 13). At several stations, including in the canyons of the southern flank and along the northern flank of the Bank, the euphausiid, Meganyctiphanes norvegica, was abundant. One haul just off the northern flank yielded large numbers of the copepod, Euchaeta norvegica. Other specimens collected include; amphipods, isopods, mysids, euphausiids, polychaetes, hydroids, algae, decapods (crab zoea and megalops, as well as shrimp), chaetognaths and jellyfish Typically, the surface net (15-0m) contained the largest abundance of animals.
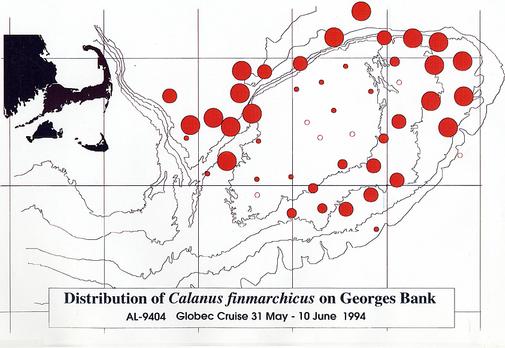
Figure 11. Distribution and relative abundance of the copepod Calanus
finmarchicus on Georges Bank.
Abundances were assigned to one of four categories: very abundant,
abundant, common, or rare. The sizes of the circles indicate the relative abundances. Unfilled
circles indicate the apparent absence of the species from that station.
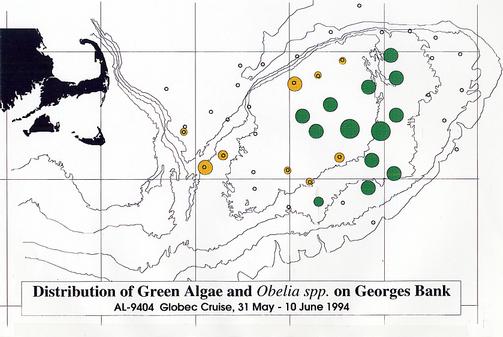
Figure 12. Distribution and relative abundance of filamentous green algae and
the hydroid, Obelia spp.. Relative abundances are shown by the sizes of the filled circles (see
caption of Figure 11 for explanation).
Dark filled circles indicate the presence of both organisms;
the light filled circles indicate the abundances of only the Obelia spp.
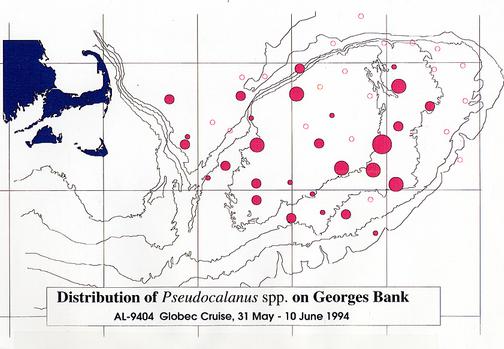
Figure 13. Distribution and relative abundance of the copepod, Pseudocalanus
spp., on Georges Bank.
Relative abundances are shown by the sizes of the filled circles (see
caption of Figure 11 for explanation).
Immunological studies were conducted by J. Terrell of Hydros, Inc on a project supported by the U.S. GLOBEC program and the NOAA Coastal Ocean Program. The research is exploratory and the objectives were:
On past cruises, Hydros has collected samples of copepods at sea, preserved them and then injected them into chickens in-order to produce antisera specific for common prey items in fish diets. The work on this cruise was a continuation of an effort that was begun on the earlier GLOBEC cruises this spring. Tests were conducted of the antisera that was developed from different live zooplankton at sea, using a "PrepTip" that was designed especially for testing antisera on live animals.
Because antisera is highly specific for certain antigenic determinants on protein, it is very important to avoid protein denaturation (particularly changes to tertiary structure). There is need to develop an antibody that best matches the proteins found in live organisms but because of the difficulty in returning live marine zooplankton to the lab, various preservation techniques have to be used. Current methods of preservation (e.g. formalin and EtOH) are problematical because they induce varying degrees of denaturation. One of our objectives was to evaluate the effect of different preservatives (urea, glycerol and formalin) on protein structure. After these tests are evaluated, the preservative that most closely maintains the natural protein structure of the test species will be used for the development of an antisera. Samples have also been frozen and live organisms were collected to take back to the lab.
The primary focus of the bioacoustical effort by P. Wiebe's group on this cruise was to make high resolution volume backscattering and target strength measurements of plankton and nekton throughout the Georges Bank region. The acoustical data are intended to provide acoustical estimates of the spatial distribution of biomass and size frequency of acoustical targets which span the size range of the target species (cod, haddock, Calanus, and Pseudocalanus) and their predators. Work on this cruise was designed to test the extent to which the acoustical data can be directly related to the data generated by the net collections of plankton and nekton. To do this required intensive continuous acoustic sampling along the shipboard survey tracklines over the entire Georges Bank region during this broad-scale survey cruise. The acoustical spatial map is also intended to provide an essential link between the physical oceanographic conditions on the bank and the biological distributions of the species as determined from the net collections at the stations distributed throughout the Georges Bank region. Concurrent acoustic data from the Greene Bomber and the shipboard ADCP will provide an excellent opportunity to compare volume backscattering from both systems.
A dual-beam 420-kHz echo sounder of special design by BioSonics Inc. (designated the ROV sounder because it was originally built for use on an ROV) and an environmental sensor package was deployed from the R/V Albatross IV for continuous underway data acquisition between stations. The acoustic and environmental sensor packages mounted were mounted in an ENDECO towed 5-foot V-fin fish nicknamed the "Greene Bomber". It was deployed from a J-frame to starboard off the aft quarter and towed approximately 2.5m below the surface. The acoustic transducer was operated in a down-looking mode. The Greene Bomber was only recovered from the water for maintenance (battery replacement) or repair (which occurred only a couple of times).
Of 48 transect legs between stations, 45 were successfully completed. On two legs (3 and 4), data was lost because of a conflict between incoming navigation data from the ship and sounder data acquisition. A mishap resulted in no recording on leg 42. Poor quality data was obtained on the legs (32 and 33) when the winds and sea were especially high. The combined length of trackline along which acoustical measurements were made was 1441 km (778 nautical miles). Acoustical measurements were made at 5 pings/s until the middle of run 31 when it was changed to 2 pings/s in order to minimize false echos from the bottom.
A striking feature was the great difference in the vertical distribution of the scatterers between the shallow regions of the Bank and the deeper portions (stratified regions). There was generally high scattering throughout the water column in the well-mixed areas and little horizontal layering (Figure 14). Small-scale vertical lineations from the surface to the bottom were often evident. Lower volume backscattering was observed in the middle portions of the southern flank especially below the surface layer which had the highest volume scattering levels. In the vicinity of the shelf/Slope Water break, volume backscattering increased and heaviest concentrations of the scatterers were at the surface (Figure 15). This was most extreme in the northeast peak region where highest concentrations of C. finmarchicus occurred. Much lower volume backscattering was observed in the offshore Slope Water stations south of the Bank. To the north of the Bank, the levels and distribution of volume backscattering were highly variable. In Georges Basin, moderately high levels were present even at depths of 30 to 50 m, but horizontal variation was pronounced (Figure 16). The dense scattering features which penetrated to depth gave the appearance of downwelling zones or convergences. In contrast, within Franklin and Wilkinson Basins, high volume scattering levels were generally restricted to the upper 15 to 20 m, and there was a very sharp transition to lower levels in the deeper depths.
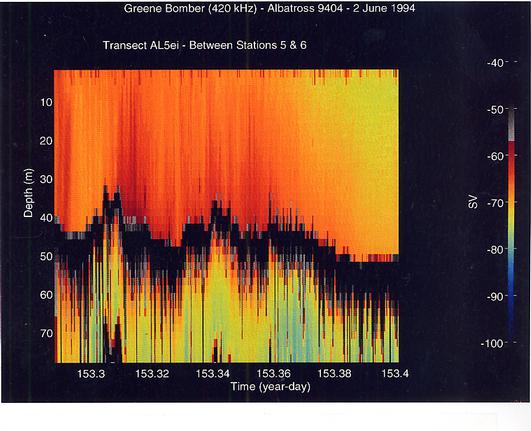
Figure 14. Volume backscattering at 420 kHz in a region of the "well-mixed" area of Georges Bank. Note the fine- to coarse-scale vertical lineations which are embedded in the larger scale variations and the absence of horizontal layering.
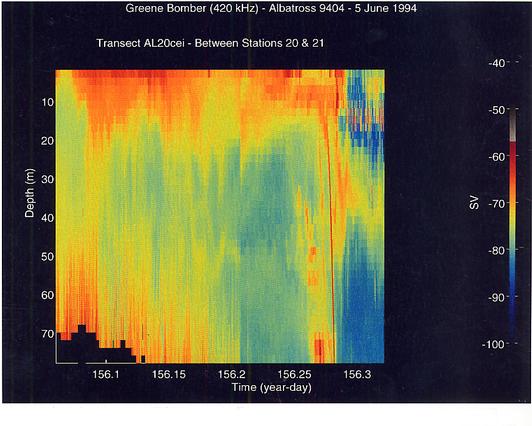
Figure 15. Transect from the southern flank of Georges Bank out into the Slope Water in the vicinity of Georges Canyon. Strong layering in the volume scattering is reduced in strength once past the very sharp acoustic "wall" which occurs midway along the transect. That wall is an artifact caused by the echo from the bottom in the depth range of 150 to 230 m in one ping cycle.
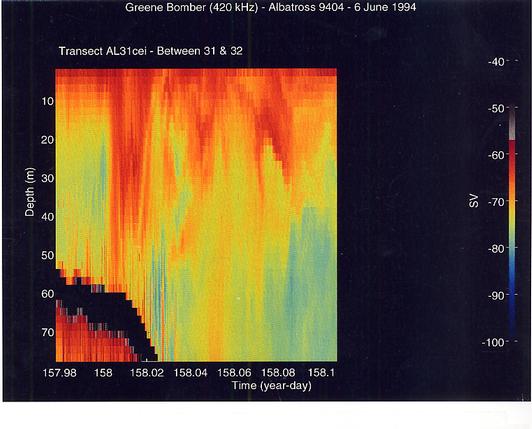
Figure 16. Transect from the northeast peak of Georges Bank out into Georges Basin. The strong vertical patterns of volume scattering suggest the presence of downwelling zones. The left most zone may be associated with the strong horizontal current which is often present in this area.
There was also substantial fine- and coarse-scale horizontal and vertical variability along the transect lines. Some of the horizontal variation in mid-depth layers was periodic suggesting internal wave motion. Smaller scale scalloped structures on the bottom margin of mid-depth layers suggested periodic bottom mixing or turbulence events which appeared to cause a dilution of the volume backscattering in the main mid-depth layer and a build-up of scattering near the bottom. Internal wave-like structures were also observed in most of the off-Bank work sites, including the Great South Channel. In the deeper stratified regions of there was also fine-scale horizontal pattern of vertical lineations sticking up from the bottom (Figure 17). The hypothesis that these represent organisms concentrated in secondary circulation cells caused by tidal flow over a rough bottom remains to be tested.
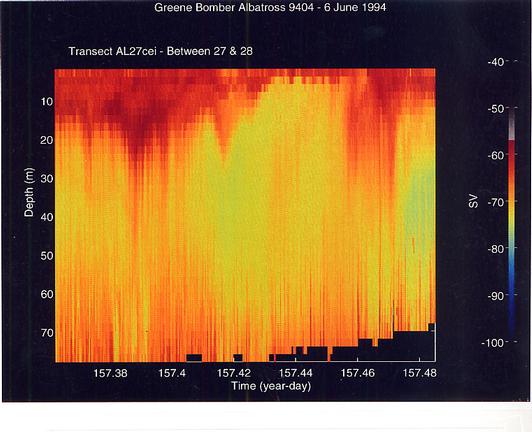
Figure 17. High volume backscattering in the surface layer is associated with the very large concentrations of Calanus finmarchicus which were present on the northeast peak of Georges Bank. The fine- to coarse-scale vertical lineations forming spikes off the bottom may be associated with secondary circulation cells causd by strong tidal currents flowing over a rough bottom.
Scientific
| Name | Title | Organization | |
|---|---|---|---|
| 1. | Peter H. Wiebe | Chief Scientist | WHOI, Woods Hole, MA |
| 2. | David Mountain | Scientist | NMFS/NEFSC, Woods Hole |
| 3. | John Sibunka | Scientist | NMFS/NEFSC, Woods Hole |
| 4. | Maureen Taylor | Technician | NMFS/NEFSC, Woods Hole |
| 5. | Teresa Rotunno | Technician | NMFS/NEFSC, Woods Hole |
| 6. | Ann Bucklin | Scientist | University of New Hampshire |
| 7. | Chris Caudill | Grad Student | University of New Hampshire |
| 8. | Todd Lajeunesse | Technician | University of New Hampshire |
| 8. | Sara Smolennack | Student | University of New Hampshire |
| 9. | Jackie Popp | Technician | Cornell University |
| 11. | Mark Benfield | Scientist | WHOI, Woods Hole |
| 12. | Julio Candela | Scientist | WHOI, Woods Hole |
| 13. | Jenifer Terrell | Technician | Union College, N.Y. |
NOAA Officers and Crew
| Name | Title | |
|---|---|---|
| 14. | Cdr Peter Celone | Commanding Officer |
| 15. | Lt James Meigs | Operations Officer |
| 15. | Ens Christopher Koch | Navigation Officer |
| 17. | Keven Cruse | Chief Mechanical Eng. |
| 19. | John Hurder | 1st Asst. Eng. |
| 20. | John MacDonald | 2nd Asst. Eng. |
| 21. | Matthew Herod | General Vessel Asst. |
| 22. | Manuel Botelho | Chief Bosun |
| 23. | Kenneth Rondeau | Lead Fisherman |
| 24. | John Cravo | Skilled Fisherman |
| 25. | Francisco Ferriera | Skilled Fisherman |
| 26. | Antonio Alvernaz | Skilled Fisherman |
| 27. | William Amaro | Skilled Fisherman |
| 28. | Harold Bowen | Ordinary Fisherman |
| 29. | John Braxton | Chief Steward |
| 30. | Eugene Hill | 2nd Cook |
| 31. | Don Byrd | Rotating Electronics Tech. |
| 32. | Hank Malcolm | Rotating Electronics Tech. |
Appendix 1. Event Log (a.k.a Data Inventory) - List of Underway and Station Activities

Appendix 2. Summary of Organisms seen in MOCNESS hauls for AL9404.
M1-1159: 1 (2231 DST, 5-31-94, 38m)
Tows contained mostly euphausiids, amphipods, and Pseudocalanus. Other species including Calanus and the pteropod Limacina were present, but not found in abundant concentrations.
M1-1160: 2 (0930 DST, 6-1-94, 47m)
Net hit bottom and sand was collected in nets 1 and 2 especially. Hydroid Obelia and caprellid amphipods abundant throughout water column. Other abundant orgnanisms included Centropages, Pseudocalanus and chaetognaths. Bivalves, pterpods and urchin post-larvae were also present.
M1-1161: 3 (1500 DST, 6-1-94, 81m)
Mixture of copepods dominated by Pseudocalanus, and Calanus. Centropages, chaetognaths, and calyptopus larvae of the euphausiid Meganyctiphanes were also common.
M1-1162: 4 (1903 DST, 6-1-94, 76m)
Tows comprised mostly of Calanus finmarchicus and lesser proportions of Centropages and Pseudocalanus. Chaetognaths, euphausiids and greenish algae were common. Pteropods, worm larvae, and fish eggs were present.
M1-1163: 5 (0529 DST, 6-2-94, 41m)
Sparse tow dominated by cheatognaths, Centropages and Pseudocalanus. Calanus finmarchicus, Limacina, urchin post-larvae, and bivalve larvae were also present.
M1-1164: 6 (0952 DST, 6-2-94, 53m)
Sparse tow comprising mostly of chaetognaths, Centropages, Pseudocalanus and decopod zoea. Urchin, polychaete and bivalve larvae were common. Low concentrations of Calanus and obelia were present.
M1-1165: 7 (1331 DST, 6-2-94, 61m)
Surface tows (0-20m) contained mostly Calanus finmarchicus and lesser abundances of Pseudocalanus; deeper tows(20-bottom) were comprised mostly of chaetognaths. Larval worms and Obelia were also present.
M1-1166: 8 (1839 DST, 6-2-94, 80m)
Calanus finmarchicus dominates the samples; hyperid amphipods and Pseudocalanus are also abundant. The pteropod, Limacina, and fish eggs were also present.
M1-1167: 9 Slope Water (2327 DST, 6-2-94, 235 m)
Calyptopus larvae and juvenile Meganyctiphanes norvegica predominated the samples. Calanus and chaetognaths were also common. Pseudocalanus, pteropods, and fish eggs were present.
M1-1168 (0426 DST, 6-2-94, 87m)
Failed haul
M1-1169: 10 (0546 DST, 6-3-94, 87m)
Nets were brought up with high concentrations of Calanus finmarchicus. Centropages was also identified in abundant concentrations. Also present in the samples was a filamentous algae which collected as a "green scum" on our sieves. Pteropods were also noted in this tow.
M1-1170: 11 (1031 DST, 6-3-94, 59m)
The small copepod, Pseudocalanus, predominated the samples. Calanus, Obelia, and chaetognaths were also common.
M1-1171: 12 (1439 DST, 6-3-94, 36m)
Centropages are particularly abundant; they are darkly pigmented unlike the pinkish red of Calanus. Hydroid Obelia and algae form a thick "green scum" in nets from tows throughout the water column. Bivalve larvae and Pseudocalanus were abundant in surface waters.
M1-1172: 13 (1638 DST, 6-3-94, 37m)
Similar to M1-1172 with Centropages spp. very abundant and bivalve larvae, hydroids, and "green scum" present.
M1-1173: 14 (1952 DST, 6-3-94, 52m)
High concentrations of "green scum" comprised of hydroids and filamentous algae was found in all the net depths. Decapod zoea were abundant and Pseudocalanus, Centropages, and Calanus were found in sparse concentrations.
M1-1174: 15 (2242 DST, 6-3-94, 45m)
Mostly the "green scum" (Obelia and algae) was collected, with chaetognaths being very abundant. Centropages were common and bivalve larvae were present.
M1-1175: 16 (0316 DST, 6-4-94, 63m)
In the surface waters, Calanus, Pseudocalanus, and Centropages were abundant and euphausids and crab zoeae were common. Below 20 meters, amphipods and isopods were also abundant. The "green scum" was once again present in the samples. Pteropods were noted.
M1-1176: 17 (0719 DST, 6-4-94, 69m)
Calanus finmarchicus and Pseudocalanus were abundant. The "green scum" was collected in the samples and was more concentrated in the deeper tows.
M1-1177 failed haul
M1-1178: 18 (1335 DST, 6-4-94, 65m)
High biomass. Obelia and filamentous algae (green scum) throughout water column. Pseudocalanus was very abundant with relatively abundant concentrations of polychaete larvae. Calanus was also common.
M1-1179: 19 (1949 DST, 6-4-94, 55m)
High biomass samples dominated by Centropages. Calanus, Obelia, and bivalve larvae were common.
M1-1180: 20 (0038 DST, 6-5-94, 72m)
Surface water samples 0 - 20m, contained abundant concentrations of Calanus, and lower concentrations of Centropages. Deeper samples contained abundances in Pseudocalanus, and amphipods. The "green scum", mostly algae was also noted in all samples. Pteropods were also present.
M1-1181: 21 Georges Canyon (0900 DST, 6-5-94, 400m)
Haul characteristic of Slope Water fauna including euphausiids, squid, lobster and tropical fish species and filamentous algae near the surface. Relatively sparse abundances of animals, but high in diversity. Metridia lucens was the most abundant copepod and pteropods were very common.
M1-1182: 22 (1302 DST, 6-5-94, 100m)
Extremely high concentrations (approx 99%) and volume of Calanus finmarchicus. The shell-less pteropod Clione sp. (10 individuals in one net) and a large form of Limacina were noted.
M1-1183: 23 (1657 DST, 6-5-94, 82m)
High concentrations and abundances of Calanus, similar to M1-1182. Rest of the sample consisted of Pseudocalanus and large Limacina.
M1-1184: 24 (2100 DST, 6-5-94, 85m)
Extreme concentrations and abundances of Calanus (finmarchicus heaven) Most were collected in the upward surface tows (20 m - 0 m).
M1-1185: 25 (0200 DST, 6-6-94, 80m)
Extreme Calanus finmarchicus abundances dominated all nets, similar to the previous tows. Euphausid juveniles were common and Limacina were also noted. Of the few fish seen, Liparis sp. were found. The deep nets contained vast quantities of the hydromedusa, Hybocodon prolifer and its actinula.
M1-1186: 26 (0600 DST, 6-6-94, 80m)
Calanus finmarchicus dominated these samples and were found in enormous quantities in all nets. The up haul 15m - surface net, once again had the greatest abundance of copepods, with over twice the volume. A few jellyfish were found in all nets. Euphausids were also present.
M1-1187: 27 (0900 DST, 6-6-94, 80m)
Calanus finmarchicus was collected in enormous quantities. The up haul 15m -surface net had the greatest abundance, approximately 5x as many copepods. Some fish (Liparis sp.) were found in the 80m - 40m net. Cheatognaths were noted as common and the large form of the Limacina was present.
M1-1188: 28 (1201 DST, 6-6-94, 70m)
Surface net on up haul had a large volume of Calanus finmarchicus, a few arrow worms (chaetognaths), pteropods (large Limacina), 1 Atlantic mackerel, thecosomates and a few gymnosomates taken from a 1/5 split of the sample. The net sampled from 40 - 15m had a similar representation with less of an abundance of fish and more jellyfish. The bottom net (70 - 40m) had ctenophores, worms, Calanus, a few pteropods, brittle stars, and 1 cod larva.
M1-1189: 29 (1730 DST, 6-6-94, xxm)
Copepod abundances are dominated by Centropages and Pseudocalanus. Euphausiids, chaetognaths and decapod zoea are also common. The Obelia and algal "green scum" was once more present in each sample. The surface net had greatest abundance of copepods and algae. Few fish larvae were found, mostly Liparis sp. (snailfish) and Myoxocephalus aenaeus (longhorn sculpin). There were also isopods, amphipods, and mysids.
M1-1190: 30 (2000 DST, 6-6-94, 60m)
Samples contained the algae and Obelia "scum", isopods, mysids, few fish larvae (Liparis sp., Myoxocephalus aenaeus), few euphausiids and copepods. Copepod assemblage consisted mostly of Calanus. The surface net had more copepods than the deeper nets. Bivalve larvae were noted.
M1-1191: 31 (2253 DST, 6-6-94, 60m)
Samples from this tow contained abundant amounts of Calanus. Larval euphausids and crangon shrimp were common. The pteropod, Limacina, was present.
M1-1192: 32 (0310 DST, 6-7-94, 275m)
This deep station was extremely abundant in Calanus and yielded copious amounts of Meganyctiphanes norvegica. Euchaeta norvegica was abundant in the deeper nets while the large form of Limacina was collected at shallower depths.
M1-1193: 33 (0810 DST, 6-7-94, 84m)
Surface samples again yielded massive quantities of Calanus finmarchicus, which was also abundant in deeper samples. A few euphausiids (Meganyctiphanes norvegica) and amphipods were also found.
M1-1194: 34 (1316 DST, 6-7-94, 52m)
This sparse sample was a mixture of species, none of which was predominant.
Calanus, Centropages, bivalve larvae, pteropods, chaetognaths, and Obelia were all found.
M1-1195: 35 (1650 DST, 6-7-94, 28m)
This sample was very similar to M1-1194: sparse but diverse, with the same species occurring. Two fish larvae, one agonid and one gadid were found.
M1-1196: 36 (2044 DST, 6-7-94, 52m)
Calanus was extremely abundant in this tow. Pseudocalanus and chaetognaths were common and zoea, euphausiids and pteropods were present. Note: There was a mixture of copepodite stages, some individuals were lipid-filled while others had algae in their guts.
M1-1197: 37 (0010 DST, 6-8-94, 29 m)
The copepod Centropages dominated these samples. Other abundant species were decapod zoeae, Obelia, Pseudocalanus. Few Calanus were found. One juvenile sandlance, Ammodytes sp. was found and identified.
M1-1198: 38 (0440 DST, 6-8-94, 119 m)
The surface waters contained substantial quantities of Calanus, to the near exclusion of any other species, except a few amphipods
M1-1199: 39 (0741 DST, 6-8-94, 210m)
This sample showed very strong vertical stratification of species' abundances: the surface waters were filled with Calanus, while deeper waters contained Euchaeta norvegica, chaetognaths, and adult Meganyctiphanes. One fish larva, a scombrid, was found.
M1-1200: 40 (1206 DST, 6-8-94, 115 m)
Calanus was very abundant in surface waters and Pseudocalanus, Centropages, and small pteropods were common. Calanus was also abundant in deeper waters along with large medusae, Meganyctiphanes, and chaetognaths.
M1-1201: 41 (1545 DST, 6-8-94, 41 m)
Calanus was extremely abundant throughout the water column. Pseudocalanus, pteropods, and hyperiid amphipods were sparse but similarly distributed. Chaetognaths, large pteropods, and bivalve larvae were very common in deeper net samples.
M1-1202: 42 (1900 DST, 6-8-94, 50m)
Centropages, Pseudocalanus, Calanus and bivalve larvae comprised most of the sample biomass. Centropages was the most abundant.
M1-1203: 43 (2200 DST, 6-8-94, 88m)
Calanus was extremely abundant in all samples throughout the water column. Larval Meganyctiphanes and a variety of fish larvae were also identified. Numerous sergestiid shrimps were caught in the deeper nets.
M1-1204: 44 (0045 DST, 6-9-94, 135 m)
Once again! Calanus were very numerous throughout the water column. Deeper nets caught some Meganyctiphanes and shrimps (probably Sergestes).
M1-1205: 45 (0649 DST, 6-9-94, 61 m)
Calanus was found throughout the water column, but was less abundant by 4 or 5 times than in the hauls immediately previous to this one. Most of the Calanus were CV; less than 1 or 2% were adults. Equally abundant was Pseudocalanus, with numerous crab zoea in the surface waters. Chaetognaths dominated the deeper net collections followed by Obelia, Calanus, Pseudocalanus, and bivalve larvae.
M1-1206: 46 (1017 DST, 6-9-94, 65 m)
The hydroid, Obelia, was most abundant in this series of tows, yet it was not accompanied by the green algae as seen previously. The dominant copepod was Centropages. Calanus and Pseudocalanus were present but not in significant concentrations. Chaetognaths, zoea, urchin post larvae, and bivalve larvae were also common.
M1-1207: 47 (1500 DST, 6-9-94, 162m)
The surface nets yielded great quantities of Calanus. Surface samples also contained common abundances of Pseudocalanus, polychaete larvae and bivalve larvae. Concentrations in the deeper nets were sparse, comprising mostly of Calanus, Meganyctiphanes, hyperiid amphipods, and juvenile brittlestars.
M1-1208: 48 ( 1920 DST, 6-9-94, 167m)
Both Calanus and Pseudocalanus were abundant in the surface waters. Polychaete trochophore larvae were also very common. Adult Meganyctiphanes and hyperiid amphipods were collected in the deeper tows.
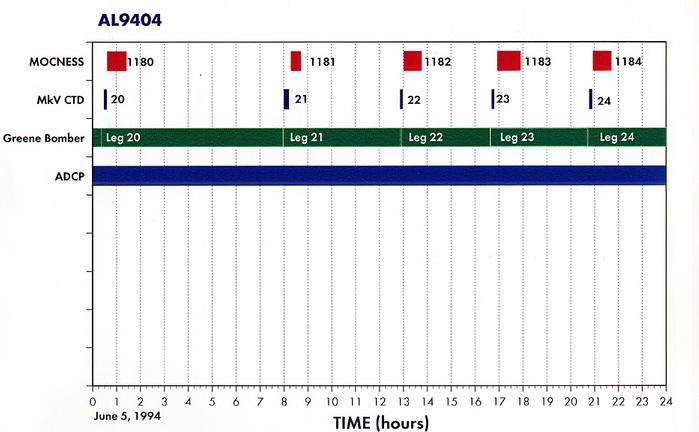
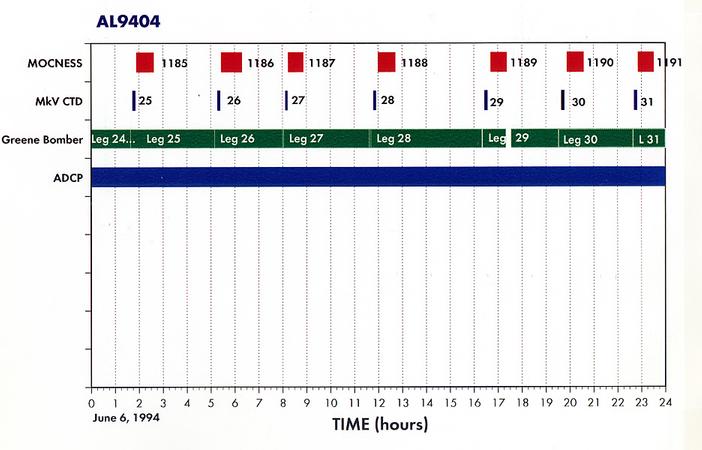
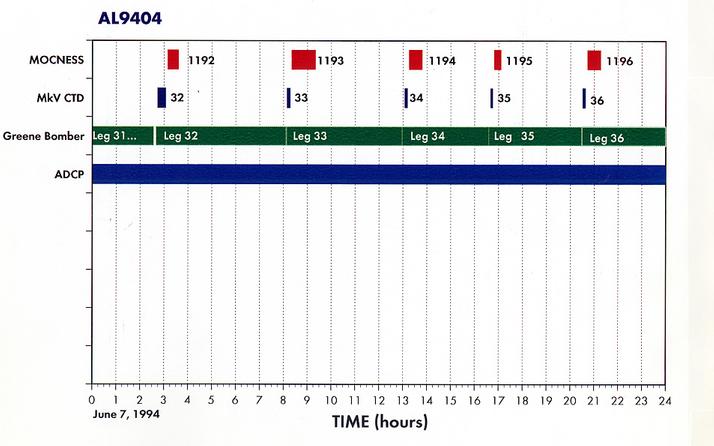
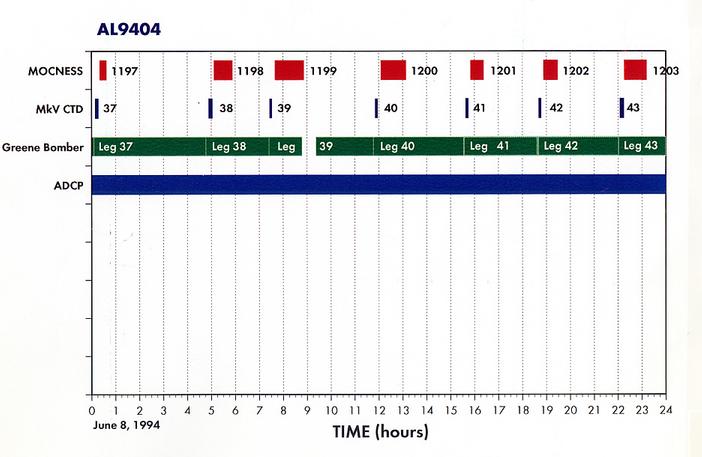
Appendix 3. Summary of Greene Bomber Towed Body Statistics for the Georges Bank Acoustics Survey aboard R/V ALBATROSS IV cruise 94-04, 31 May to 10 June 1994
| Lat.oN | Long.oW | Local Date (Start Down/up) | GMT Date (Start Down/up) | Greene Bomber Data Files ESS: EnvironmentalSensors (mounted on GB) |
Concurrent or overlapping measurements | Remarks | |
|---|---|---|---|---|---|---|---|
| 1 | 41 16.20 40 53.38 | 69 23.99 68 21.09 | 31 May/ 1 June 2353 0859 |
1 June 0353 1259 | ESP: al1bei.dat=transect ESS: al1ei.pro al1ei.raw |
(CTD & MOC done earlier) ADCP |
Working out problems with GPS and ESS. Sunrise (GMT): 0857 |
2 |
40 50.80 40 42.88 |
68 22.50 67 57.92 |
1 June 1004 1422 |
1 June 1404 1822 |
ESP: al2bei.dat ESS al2ei.pro al2ei.raw |
MkV CTD MOC 1160 ADCP |
Continuing to work out problems with data aquisition and GPS. |
3 |
40 42.61 40 46.07 |
67 58.87 67 57.96 |
1 June 1543 1840 |
1 June 1943 2240 |
ESP: al3aei.dat ESS: al3ei.pro al3ei.raw |
MkV CTD MOC 1161 ADCP |
No useful acoustical data. |
4 |
40 46.28 41 00.71 |
67 52.38 68 19.45 |
1 June/ 2 June 2109 0534 |
2 June 0109 0934 |
ESP: al4ei.dat ESS: al4ei.pro al4ei.raw |
MkV CTD MOC 1162 ADCP |
GB pulled to check instruments. Noticed that data was not being written to disk and resolved this problem by writing to FDD. 2300 pulled GB again to change the battery. Fish lowered 1m deeper than previously due to swinging. Sunset (GMT): 0002 |
5 |
41 02.49 41 01.68 |
68 19.56 67 58.04 |
2 June 0605 0937 |
2 June 1005 1337 |
ESP: al5ei.dat ESS: al5ei.pro al5ei.raw |
MkV CTD MOC 1163 ADCP |
Still no salinity and the flurometer seems to be damaged. |
6 |
41 01.68 40 55.29 |
67 58.04 67 44.90 |
2 June 0949 1311 |
2 June 1249 1711 |
ESP: al6ei.dat ESS: al6ei.pro al6ei.raw al6bei.pro al6bei.raw |
MkV CTD MOC 1164 ADCP |
Computer acquiring GB ESS data had a disk full error and stopped process,no data for ca 1 hr and 30 min. |
7 |
40 55.83 40 44.94 |
67 47.06 67 24.41 |
2 June 1421 1818 |
2 June 1821 2218 |
ESP: al7ei.dat ESS: al7ei.pro al7ei.raw |
MkV CTD MOC 1165 ACDP |
Pulled GB to put flurometer on transmissometer bus unit, changed code to reflect change. |
8 |
40 45.11 40 34.93 |
67 24.37 67 04.06 |
2 June 1837 2308 |
2 June/ 3 June 2237 0308 |
ESP: al8ei.dat ESS: al8ei.pro al8ei.raw al8bei.pro al8bei.raw al8cei.pro al8cei.raw |
MkV CTD MOC 1166 ADCP |
Error in ESS, intermittent interrupt, loss of power to sea cable caused by a low battery. An indicator was that the temperature data was not correct. Sunrise (GMT): 0000 |
9 |
40 34.64 40 51.78 |
67 04.07 67 08.08 |
2 June/ 3 June 2324 0405 |
3 June 0324 0805 |
ESP: al9ei.dat Run 1=MOC Run 2=no MOC Run 3=transect ESS: al9ei.pro al9ei.raw |
MkV CTD MOC 1167 ADCP |
Pulled GB removed flurometer, optical and battery. |
10 |
40 52.51 41 05.65 |
67 09.31 67 25.60 |
3 June 0451 1012 |
3 June 0851 1412 |
ESP: al10ei.dat Run 1=MOC Run 2=transect ESS: not running |
MkV CTD MOC 1168-redone MOC 1169 ADCP |
Sunrise (GMT): 0858 GB appeared to go under the ship. Ship speed was reduced and corrected the problem. Whales were sited. |
11 |
41 05.46 41 17.88 |
67 25.37 67 40.48 |
3 June 1028 1109 |
3 June 1428 1509 |
ESP: al11ei.dat Run 1=MOC Run 2=transect ESS: not running |
MkV CTD MOC 1170 ADCP |
0-2 m on the echogram shows noise and although it is windy, surface bubble entractment does not seem to explain this noise. |
12 |
41 18.28 41 24.57 |
67 41.28 67 47.93 |
3 June 1451 1625 |
3 June 1851 2025 |
ESP: al12ei.dat Run 1=CTD Run 2=MOC & transect ESS: not running |
MkV CTD MOC 1171 ADCP |
Still working out the bugs in the GB ESS data acquisition software and hardware. |
13 |
41 24.63 41 30.41 |
67 47.93 67 29.09 |
3 June 1627 1934 |
3 June 2027 2334 |
ESP: al13ei.dat Run 1=MOC Run 2=transect ESS: not running |
MkV CTD MOC 1172 ADCP |
Bivalve larvae is seen in the tow at this station. |
14 |
41 30.42 41 19.93 |
67 29.09 67 18.43 |
3 June 1937 2228 |
3 June/ 4 June 2337 0228 |
ESP al14aei.dat=CTD al14bei.dat=MOC al14cei.dat=transect ESS: not running |
MkV CTD MOC 1173 ADCP |
Decided to change the protocol for writing the acoustic data to disk so that it is event oriented. |
15 |
41 19.93 41 05.39 |
67 18.43 67 04.09 |
3 June/ 4 June 2228 0238 |
4 June 0228 0638 |
ESP: al15aei.dat=CTD al15bei.dat=MOC al15cei.dat=transect ESS: not running |
MkV CTD MOC 1174 ADCP |
|
16 |
41 05.50 41 00.96 |
67 04.10 66 49.99 |
4 June 0240 0703 |
4 June 0640 1130 |
ESP: al16aei.dat=CTD al16bcei.dat=noMOC al16dei.dat=MOC al16eei.dat=transect ESS: not running |
MkV CTD MOC 1175 ADCP |
Problem determining when the net was really fishing instead of cleaning the nets in the ocean. Sunrise (GMT): 0855 |
17 |
41 00.96 41 17.57 |
66 49.99 66 59.99 |
4 June 0703 1228 |
4 June 1103 1628 |
ESP: al17aei.dat=CTD al17bei.dat=MOC al17cei.dat=transect ESS: al17ei.pro al17ei.raw |
MkV CTD MOC 1176 ADCP |
|
18 |
41 17.56 41 39.95 |
67 00.00 67 06.25 |
4 June 1228 1933 |
4 June 1628 2333 |
ESP: al18aei.dat=CTD al18bei.dat=MOC al18cei.dat=transect ESS: al18ei.pro al18ei.raw |
MkV CTD MOC 1177-redone MOC 1178 ADCP |
|
19 |
41 39.92 41 24.44 |
67 06.25 66 47.88 |
4 June 1934 0022 |
4 June 2334 0422 |
ESP: al19aei.dat=CTD al19bei.dat=MOC al19cei.dat=transect ESS: al19ei.pro al19ei.raw |
MkV CTD MOC 1179 ADCP |
Sunset (GMT): 0000 |
20 |
41 24.44 41 10.06 |
66 47.88 66 09.98 |
5 June 0022 0758 |
5 June 0422 1158 |
ESP: al20aei.dat=CTD al20bei.dat=MOC al20cei.dat=transect ESS: al20ei.pro al20ei.raw al20bei.pro al20bei.raw |
MkV CTD MOC 1180 ADCP |
Sunrise (GMT): 0852 The ESS data acquisition program hung at 0022 (local) and the problem was solved at 0041 (local). Wave packets are seen in the echogram. At 0526 a disk full error has interrupted ESS data acquisition. At 0646 buoys are seen on both sides of the ship. A 'front' is seen on the echogram. |
21 |
41 10.06 41 23.00 |
66 09.98 66 17.93 |
5 June 0759 1253 |
5 June 1159 1653 |
ESP: al21aei.dat=CTD al21bei.dat=MOC al21cei.dat=transect ESS: al21ei.pro al21ei.raw |
MkV CTD MOC 1181 ADCP |
|
22 |
41 22.96 41 35.03 |
66 17.93 66 27.56 |
5 June 1302 1638 |
5 June 1702 2038 |
ESP: al22aei.dat=CTD al22bei.dat=MOC al22cei.dat=transect ESS: al22ei.pro al22ei.raw |
MkV CTD MOC 1182 ADCP |
2 Whales and some dolphins are sited. Corresponding to the strong backscattering layer on the echogram were the abundances of copepods in the 0 - 20 m tow of the Mocness. |
23 |
41 35.03 41 33.65 |
66 27.58 41 37.91 |
5 June 1639 2043 |
5 June/ 6 June 2039 0043 |
ESP: al23aei.dat=CTD al23bei.dat=MOC al23cei.dat=transect ESS: al23ei.pro al23ei.raw |
MkV CTD MOC 1183 ADCP |
Sunset (GMT): 2358 A basking shark is sited. |
24 |
41 37.43 41 56.90 |
66 06.53 66 06.72 |
5 June/ 6 June 2140 0139 |
6 June 0140 0539 |
ESP: al24aeii.dat=CTD al24bei.dat=MOC al24cei.dat=transect ESS: al24ei.pro al24ei.raw al24bei.pro al24bei.raw |
MkV CTD MOC 1184 ADCP |
The ESS data acquisition program hung at 2400 and had to be restarted. |
25 |
41 56.87 41 52.31 |
66 06.73 66 25.58 |
6 June 0140 0510 |
6 June 0540 0910 |
ESP: al25aei.dat=CTD al25bei.dat=MOC al25cei.dat=transect ESS: al25ei.pro al25ei.raw |
MkV CTD MOC 1185 ADCP |
There are approximately 23 fishing boats in the area. Large numbers of dolphins have been sited around the ship. |
26 |
41 52.31 42 01.68 |
66 25.58 66 22.28 |
6 June 0514 0800 |
6 June 0914 1200 |
ESP: al26aei.dat=CTD al26bei.dat=MOC al26cei.dat=transect ESS: al26ei.pro al26ei.raw |
MkV CTD MOC 1186 ADCP |
Sited > 10 dolphins, a seal and a whale. Sunrise (GMT): 0951 |
27 |
42 01.77 42 05.01 |
66 22.23 66 40.70 |
6 June 0803 1138 |
6 June 1203 1538 |
ESP: al27aei.dat=CTD al27bei.dat=MOC al27cei.dat Run 1=MOC (still in H2O) Run 2=transect ESS: al27ei.pro al27ei.raw |
MkV CTD MOC 1187 ADCP |
Huge numbers of copepods and some pteropods in the tow. |
28 |
42 05.01 41 44.99 |
66 40.70 66 46.12 |
6 June 1139 1620 |
6 June 1539 2020 |
ESP: al86aei.dat=CTD al28bei.dat=MOC al28cei.dat=transect ESS: al28ei.pro al28ei.raw |
MkV CTD MOC 1188 ADCP |
Whales, dolphins and a basking shark are sited from the ship. |
29 |
41 44.95 41 55.68 |
66 46.12 66 51.97 |
6 June 1622 1932 |
6 June 2022 2332 |
ESP: al29aei.dat=CTD al29bei.dat=MOC al29cei.dat=transect ESS: al29ei.pro al29ei.raw |
MkV CTD MOC 1189 ADCP |
Local: 1720 - 1730, the GB is out to check the battery. Seas are picking up. |
30 |
41 55.68 42 05.50 |
66 51.97 66 58.29 |
6 June 1932 2239 |
6 June/ 7 June 2332 0239 |
ESP: al30aei.dat=CTD al30bei.dat=MOC al30cei.dat=transect ESS: al30ei.pro al30ei.raw |
MkV CTD MOC 1190 ADCP |
Sunset (GMT): 2359 8 scallop boat sited along the transect. |
31 |
42 05.50 42 17.12 |
66 58.29 67 12.37 |
6 June/ 7 June 2239 0234 |
7 June 0239 0634 |
ESP: al31aei.dat=CTD al31bei.dat=MOC al31cei.dat=transect ESS: al31ei.pro al31ei.raw |
MkV CTD MOC 1191 ADCP |
|
32 |
42 17.26 42 04.40 |
67 12.18 67 31.16 |
7 June 0240 0808 |
7 June 0640 1208 |
ESP: al32aei.dat=CTD al32bei.dat=MOC al32cei.dat=transect ESS: al32ei.pro al32ei.raw |
MkV CTD MOC 1192 ADCP |
Seas are rougher. Waves plus swells are about 4-5 ft., winds are 28 kts from the SW. Sunrise (GMT): 0856 |
33 |
42 04.40 41 50.94 |
67 31.16 67 22.37 |
7 June 0808 1258 |
7 June 1208 1658 |
ESP: al33aei.dat=CTD al33bei.dat=MOC al33cei.dat=transect ESS: al33ei.pro al33ei.raw |
MkV CTD MOC 1193 ADCP |
Seas are rough. The data quality is poor (very noisy), although the ship speed is around 4.5 knots. |
34 |
41 50.90 41 42.46 |
67 22.18 67 36.00 |
7 June 1259 1636 |
7 June 1659 2036 |
ESP: al34aei.dat=CTD al34bei.dat=MOC al34cei.dat=transect ESS: al34ei.pro al34ei.raw |
MkV CTD MOC 1194 ADCP |
|
35 |
41 42.46 41 54.48 |
67 36.00 67 50.20 |
7 June 1636 2029 |
7 June/ 8 June 2036 0029 |
ESP: al35aei.dat=CTD al35bei.dat=MOC al35cei.dat=transect ESS: al35ei.pro al35ei.raw |
MkV CTD MOC 1195 ADCP |
Sunset (GMT): 0001 Seas are still rough. The data quality is poor. |
36 |
41 54.48 41 41.79 |
67 50.20 66 53.47 |
7 June/ 8 June 2029 0006 |
8 June 0029 0406 |
ESP: al36aei.dat=CTD al36bei.dat=MOC al36cei.dat=transect ESS: al36ei.pro al36ei.raw al36bei.raw al36bei.pro |
MkV CTD MOC 1196 ADCP |
Ship speed is decreased to around 5 knots and the data is looking better. The ESS data acquisition program hung at 2400 and had to be restarted. |
37 |
41 41.79 41 48.46 |
67 53.47 68 16.00 |
8 June 0006 0447 |
8 June 0406 0847 |
ESP: al37aei.dat=CTD al37bei.dat=MOC al37cei.dat=transect ESS: al37ei.pro al37ei.raw |
MkV CTD MOC 1197 ADCP |
|
38 |
41 48.46 41 49.96 |
68 15.99 68 27.47 |
8 June 0448 0725 |
8 June 0848 1125 |
ESP: al38aei.dat=CTD al38bei.dat=MOC al38cei.dat=transect ESS: al38ei.pro al38ei.raw |
MkV CTD MOC 1198 ADCP |
Sunrise (GMT): 0859 |
39 |
41 49.96 41 39.52 |
68 27.47 68 27.65 |
8 June 0725 1147 |
8 June 1125 1547 |
ESP: al39aei.dat=CTD al39bei.dat=MOC al39cei.dat=transect ESS: al39ei.pro al39ei.raw |
MkV CTD MOC 1199 ADCP |
Pulled the GB to change the battery (Local: 0848 - 0923). |
40 |
41 39.52 41 28.87 |
68 27.65 68 22.16 |
8 June 1148 1534 |
8 June 1548 1934 |
ESP: al40aei.dat=CTD al40bei.dat=MOC al40cei.dat=transect ESS: al40ei.pro al40ei.raw |
MkV CTD MOC 1200 ADCP |
> 20 Whales sited (possibly finbacks and / or humpbacks). |
41 |
41 28.8 41 17.15 |
68 22.16 68 17.35 |
8 June 1535 1837 |
8 June 1935 2237 |
ESP: al41aei.dat=CTD al41bei.dat=MOC al41cei.dat=transect ESS: al41ei.pro al41ei.raw |
MkV CTD MOC 1201 ADCP |
Whales and schools of herring are sited. Pieces of fucus are seen on the surface. |
42 |
41 17.15 41 23.62 |
68 17.35 68 35.43 |
8 June 1840 2202 |
8 June/ 9 June 2240 0002 |
ESP: al42aei.dat=CTD al42bei.dat=MOC al42cei.dat=transect ESS: al42ei.pro al42ei.raw |
MkV CTD MOC 1202 ADCP |
Sunset (GMT): 0007 |
43 |
41 23.62 41 26.87 |
68 35.43 68 47.12 |
8 June/ 9 June 2202 0045 |
9 June 0002 0445 |
ESP: al43aei.dat=CTD al43bei.dat=MOC al43cei.dat=transect ESS: al43ei.pro al43ei.raw al43bei.pro al43bei.raw |
MkV CTD MOC 1203 ADCP |
The ESS data acquisition program hung at 2400 and had to be restarted. Backscattering layer limited to the first 50 meters. A wave form is seen in the echogram and is seen as possibly a soliton. |
44 |
41 26.87 41 07.06 |
68 47.12 68 38.62 |
9 June 0045 0632 |
9 June 0445 1032 |
ESP: al44aei.dat=CTD al44bei.dat=MOC al44cei.dat=transect ESS: al44ei.pro al44ei.raw |
MkV CTD MOC 1204 ADCP |
Sunrise (GMT): 0859 |
45 |
41 07.06 41 01.24 |
68 38.62 68 50.67 |
9 June 0632 1001 |
9 June 1032 1401 |
ESP: al45aei.dat=CTD al45bei.dat=MOC al45cei.dat=transect ESS: al45ei.pro al45ei.raw |
MkV CTD MOC 1205 ADCP |
Schools of herring and some whales are sited near the ship. |
46 |
41 01.24 41 20.88 |
68 38.62 69 05.34 |
9 June 1001 1438 |
9 June 1401 1838 |
ESP: al46aei.dat=CTD al46bei.dat=MOC al46cei.dat=transect ESS: al46ei.pro al46ei.raw |
MkV CTD MOC 1206 ADCP |
Whales and dolphins sited near the ship. Plankton is visible in the surface waters. Some kelp is floating on the surface, also. |
47 |
41 20.88 41 37.13 |
69 05.34 69 16.92 |
9 June 1438 1916 |
9 June 1838 2316 |
ESP: al47aei.dat=CTD al47bei.dat=MOC al47cei.dat=transect ESS: al47ei.pro al47ei.raw |
MkV CTD MOC 1207 ADCP |
|
48 |
|
|
|
|
ESP: al48aei.dat=CTD al48bei.dat=MOC al48cei.dat=transect ESS: al48ei.pro al48ei.raw |
MkV CTD MOC 1208 ADCP |
|