 0 Consecutive Broad-Scale Stations and Cruise Track.
R/V ALBATROSS IV Cruise 9508 to Georges Bank
We gratefully acknowledge the very able assistance provided by the Officers, and Crew Marine Technician of the R/V ALBATROSS IV. The very professional sevices provided and friendly atmosphere enabled us to successfully conduct our sampling operations and make our observations at all of the intended stations and to respond to an interesting observation made during the cruise .
Steaming on the Bank
With fair skies and gentle wind
Broad-scale cruising ends
This report was prepared by Peter Wiebe, Charles Miller, John Sibunka, and Stein Kaartvedt with assistance from others in the scientific party. This cruise was sponsored by the National Science Foundation and the National Oceanographic and Atmospheric Administration.
Purpose of the Cruise
Cruise Narrative
Individual Reports
Hydrography
Ichthyoplankton and Zooplankton Sampling Methods.
Ichthyoplankton studies based on Bongo and MOCNESS tows.
Zooplankton studies based on Bongo and MOCNESS tows.
Collections for Genetic Studies.
High Frequency Acoustics
Drifter Deployments.
Shipboard ADCP (Acoustic Doppler Current Profiler) measurements.
Personnel List
Scientific
ALBATROSS IV NOAA Officers and Crew
Appendix 1. Data inventory (Event Log)
Appendix 2. Acoustic Data Summary and concomitant observations.
Appendix 3. Summary of observations made of the zooplankton samples.
Appendix 4. CTD plots and compressed listing of the data.
Purpose of the Cruise
The U.S. GLOBEC Georges Bank Program is now concluding its first major field season which is focussing on the processes of physical stratification on the Bank and the response of the biota to stratification. The field program has involved process cruises to experimentally examine the coupling between the biology and the physics, broad-scale cruises to map the distribution of physical and biological properties of the Bank, and mooring deployment/recovery cruises (several of which remain to be done this year). This cruise aboard the R/V ALBATROSS IV was the last broad-scale cruise in a series of six cruises spaced at monthly intervals. Our effort was mainly devoted toward developing a Bank-wide context for the process work being conducted by the researchers on the other cruises and the modelers who will be using both the broad-scale and process data in their model computations. Our specific objectives were:
(1) to conduct a broad-scale survey of U.S. GLOBEC Georges Bank Program of target fish (larval and juvenile cod and haddock) and copepod species (Calanus finmarchicus, and Pseudocalanus sp.), and their predators and prey to determine their distribution and abundance.
(2) to conduct a hydrographic survey of the Bank.
(3) to conduct acoustic mapping of the plankton along the tracklines between stations using a high frequency echo sounder deployed in a towed body.
(4) to map the Bank wide velocity field using an Acoustic Doppler Current Profiler (ADCP).
(5) to collect individuals of Calanus finmarchicus, Pseudocalanus sp., and the euphausiid, Meganyctiphanes norvegica, for population genetics studies.
(6) to deploy drifting buoys to make Lagrangian measurements of the currents.
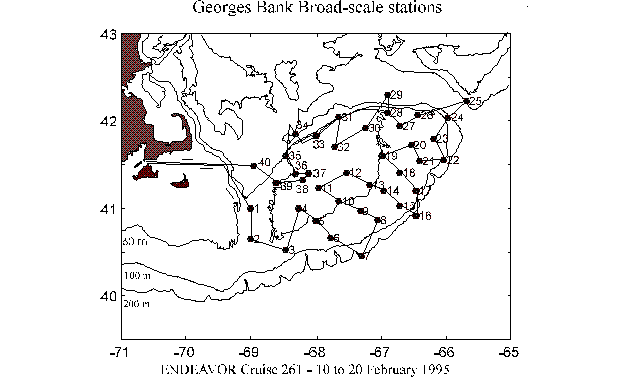
The cruise track was determined by the position of the 38 "standard" stations which form the basis for all of the broad-scale cruises. The entire Bank including parts that are in Canadian waters, were surveyed (Figure 1). On this cruise, sampling occurred at all stations, including tow additional stations added to the schedule in the vicinity of Standard Station 34..
The work was a combination of station and underway activities. The along track work consisted of high frequency acoustic measurements of the volume backscatter of plankton and nekton throughout the water column and surface measurements of temperature, salinity, fluorescence, irradiance, and beam transmittance. The ship's ADCP unit was used to make continuous measurements of the water current profile under the ship, in order to construct the current field over the whole Bank. These data will be used to help in the interpretation of all the other observations made on the cruise.
A priority was assigned to each of the 38 stations which determined which equipment was deployed during the station's activities. At high priority "full" stations, a Bongo Net equipped with a SeaBird CTD was towed obliquely to near the bottom. A CTD-fluorometer profile to the bottom was made and rosette bottles collected water samples for salinity calibration, chlorophyll, phytoplankton
0 Consecutive Broad-Scale Stations and Cruise Track.
species counts, and O16/O18 water analysis. A large volume zooplankton pumping system was used to profile the water column. A 1-m2 MOCNESS was towed obliquely between the surface to the bottom cycling twice to first make vertically stratified collections for zooplankton (150 �m) and then to make collections of fish larvae (335 �m). Weather permitting, a 10-m2 MOCNESS was towed obliquely to make vertically stratified collections of the larger predators on the target species. At lower priority stations, a Bongo tow, CTD profile, and 1-m2 MOCNESS tow were made. On this cruise, additional 10-m2 MOCNESS tows were made at partial stations making them "super partials'". There were no real weather limitations during the ten days of the cruise, but the threat of tropical storm "Chantal" resulted in a slightly modified sampling schedule A summary of the sampling events that took place during the cruise is in Appendix 1.
Cruise Narrative
In this narrative, reference made to station numbers refers to "Standard Station Number" as opposed to sequential station number, except where explicitly stated otherwise.
The R/V ALBATROSS IV left Woods Hole, Massachusetts at 1930 hrs on 10 July 1995 on a warm, sunny evening with a 15-20 kt breeze out of the southwest. The departure was delayed several hours due to a mishap setting up the MOCNESS-10 trawl on deck caused by the trawl winch "running-away" on start-up. During the process two individuals were injured (not seriously) and time was spent having a doctor make sure they were still fit for sea. One suffered a knee injury and it was determined that he should remain on shore.
Shortly after leaving port, the R/V EDWIN LINK made radio contact with the ALBATROSS. The EDWIN LINK and companion submersible, the JOHNSON-SEA-LINK, had been diving at the Georges Bank site where the towed body, BIOMAPER, was lost on the February broad-scale cruise (see the report of ENDEAVOR Cruise 261 for details on the loss). They called to tell us that they had successfully recovered the towed body and were to return it back to WHOI the next day. The news was gratefully and joyously received
Steaming to the first station on the northern end of the Great South Channel took about 7.5 hrs. Work commenced about 0300 on the 11th with a Bongo Tow, CTD cast, and a 1-m2 MOCNESS tow. The towed acoustical system, Greene Bomber, was deployed at the end of the first station. Weather conditions were ideal for this and the next two stations; the sea state was low, the winds were light, and skies were sunny to partly sunny. This gave the scientific party, which was split into two watches, the opportunity to renew their skills with the equipment and the station routines under conducive conditions. (On this cruise the watches were 0000 to 0600, 0600-1200, 1200-1800, and 1800-2400.) Station #3 was the first station where all of the instruments should have been deployed, but a flowmeter, damaged during launch, prevented use of the 10-m2 MOCNESS.
The weather held beautifully (Georges Bank was a mill pond) for the first three days, but we were plagued by problems with winches and cables which slowed the completion of stations 4-8. A broken electrical conductor on the bridle of the 10-m2 MOCNESS at the start of 10-m2 MOCNESS #5 (station # 6) caused us to drop the tow and steam to the next station. But this was all that was dropped, the rest of the scheduled work at stations 1-12 took place.
The weather deteriorated a bit on Friday (July 14), the wind came up to 15 to 20 knots, white caps appeared for the first time this cruise, and the clouds partially covered the sky. Saturday continued cool, cloudy, and breezy 15-20 kts seas 2-4' and white caps abounded, but reasonably good working conditions prevailed. Stations 13 through 21 were completed with only minor glitches in the handling of the gear or sample collection. The first hint of real trouble with the weather, however, was the tropical depression seen developing south of us in tropical waters off Florida.
On Sunday, 16 July , we worked out on the northeast peak region of the Bank and then steamed across the Northeast Channel to the most eastern station (#25) on the Scotian Shelf. The winds diminished and the sea smoothed out. It was warmer and sunnier than during the previous two days and work progressed routinely. Work at Stations 22 to 26 was successfully completed. Serious attention was beginning to be paid to the tropical storm located south of us about 25 degrees north. Satellite images downloaded periodically gave us a precise picture of its location . Predictions then were that it would move north towards New England at about 10 knots which would give us a working window of about 60 to 80 hours.
It was a beautiful sunrise on Monday (17 July) because of the high cloud and open patches of sky in the east, but weather forecast was for more wind and building seas due to a low pressure system coming into New England. The winds did come up to 20 knots by evening and we did get a light rain after the end of station 29, but these did not compromise the working conditions. In the wee hours of 17 July, however, while working at station 27 on the Northeast Peak, the Sea Bird CTD used on the Bongo tows had electrical problems which caused some delays. Later, an apparent problem with the 1-m2 MOCNESS caused additional delays. Again at station 28, the Sea Bird CTD malfunctioned because of faulty conducting cable connections. Current shear in Georges Basin at Station #29 also caused the MOCNESS net tows to take much longer than normal. All of these were annoyances which cost us time, but did not ultimately interfere with the data collection, and stations 27 through 30 were completed. The forecast for the approach of the tropical storm in our area was more dire. The weather window for our work on George Bank shrank to 24 to 36 hours given the current information about the storm track. Discussions began about which stations to drop in an effort to compete the bank-wide survey and leave no major areas un-sampled by the time we would need to steam for a safe port.
Although work had progressed on schedule throughout Monday, upon completion of the work at Station #30 in the early hours of Tuesday, the decision was made to drop Station #31 and to go to Station # 32.. At the end of work at this station, however, new forecasts indicated the storm would veer to the east and not directly influence our working area. Thus, it was resolved to steam north to Station #31 and do the work at that station before progressing to Station #33.
Strong winds and heavy seas never materialized; winds remained below 20 kts and seas did not exceed 2 to 4'. A thick fog and an occasional drizzle were present for much of Tuesday (18 July), but work progressed on schedule. Stations 31 and 33-35, a mix of full, super partial, and partial, were completed. In going from Station 33 to 34, two satellite tracked drifters were deployed in a line perpendicular to the Bank contours which started in shallow (30 m) water just east of Cultivator Shoal and went through Station 34. A third drifter was deployed at Station 34 and the last two were deployed along the line at 5-6 nm intervals northwest of Station 34.
During the last full day of station work (Wednesday, 19 July), the weather stayed unchanged. Light winds and heavy fog started the day; but later the sun burned the fog away and the winds stayed light (< 15 kts) giving rise to a very nice afternoon and evening. The seas were low, but a long period swell from Chantal (with amplitudes up to 6') caused a noticeable increase in the roll of the vessel. Standard Stations 36-38 were completed. In addition, to study the distribution of sand particles in the water column ranging from the shallow mixed area to the stratified waters of the northern portion of the Southeast Channel (the most southern reach of the Wilkinson Basin), an experiment was conducted at station 36 plus two other locations east of Station 36 (Consecutive Stations 37 and 38). This involved making additional pump profiles where sampling was done at 5-10 meter intervals from the surface to the bottom, and filtering was done with a 50 �m mesh net. This latter add-on experiment was stimulated by the finding of large numbers of sand grains in many of the net tow and pump collections throughout the shallow areas of the Bank. The acoustic records may be reflecting the presence of the sand in the water column and could explain, in part, the high volume backscattering seen on top of the Bank.
The work of the cruise was completed when the activities scheduled at Standard Station 38 were finished about 0400 on 20 July under continued light winds and fair seas.
Although substantial number of Calanus finmarchicus were found at many areas on the flanks of the Bank, few nauplier stages were seen and at many locations, few females, much less those carrying eggs, were found. Calanus were mostly stages III to V and many had their oil sacs full. Relatively few individuals of our other target species, Pseudocalaus spp. were observed except on the western-most portion of the Bank. The top of the Bank was dominated by the copepods Centropages hamatus and C. typicus, the chaetognath, Sagitta elegans, and to a lessor extent, hydroids (Clytia sp.). It was good that we went back to Station 31, because the MOCNESS sampling revealed a very interesting layering structure at this area of the northern edge of the Bank. Surface water had the top of the Bank complex of species while the lower zones were dominated by Calanus.
Substantial numbers of yellow tail flounder were taken along the western and southern flank portions of the Bank. Window pane flounder larvae were also taken as some top of the Bank stations. Small -sized fish eggs were also noted at many locations. Disturbingly, only a single individual haddock post larvae was collected at Station 31; no other post larvae or juveniles of the target fish species, cod and haddock, were collected anywhere around the Bank and only a few hake were observed.
The steam into port was uneventful, but pleasant. We arrived at the dock in Woods Hole, MA at 1100 and commenced immediately to unload the vessel. Thus, ended a very successful broad-scale cruise and a fitting end to the first series of broad-scale cruises which in their entirety were highly successful.
Hydrography
(Dan Almgren and Marie Kiladis)
Objectives:
The objective of the hydrographic sampling on the broad-scale survey cruises is to characterize the physical environment within which the target organisms reside. Of particular interest is the seasonal development of thermal and density stratification of the Georges Bank waters. The temperature and salinity data can also give an indication of the source of the waters on the Bank: Gulf of Maine, Scotian Shelf, and Slope water.
Operations:
Most of the primary hydrographic data presented here was collected using a Neil Brown Mark V CTD instrument (MK5) which provides measurements of pressure, temperature, conductivity, and fluorescence. The MK5 records at a rate of 16 observations per second and is equipped with a rosette for collecting water samples at selected depths.
A SeaBird Electronics Seacat model 19 profiling instrument (SBE19 Profiler) was used on each Bongo tow to provide real-time depth information during the tow. Pressure, temperature, and salinity observations are recorded twice per second by the Profiler. The 1 m2 and 10 m2 MOCNESS systems aboard the ALBATROSS IV are both equipped with their own environmental sensing systems to measure pressure, temperature, and salinity at 4 second intervals during the tow.
The Profiler was also deployed during ten of the plankton pump hauls when strong currents caused a large wire angle on the boom cable. In addition, the Profiler was used during all three of the "Sand Storm" pump experiments (see acoustic section for details). This technique provided accurate depth readings while filtering water samples at 5-10 meter intervals throughout the water column.
The following is a list of the CTD data collected with each of the sampling systems used on the cruise:
| Instrument | # Casts |
|---|---|
| MK5 | 38 |
| SBE19/Bongo | 38 |
| SBE19/Pump | 10 |
| SBE19 calibration | 07 |
The MK5 was deployed with 6 bottles on the rosette and seawater samples were collected for various investigators. On each MK5 cast, samples were collected for oxygen isotope analysis at selected depths for R. Houghton (LDGO) and a sample was taken at the bottom for calibrating the instrument's conductivity data. On stations which included pump operations, rosette samples for nutrient analysis were collected at selected depths for J. Bisagni and J. O'Reilly (NMFS), and samples for chlorophyll analysis were collected from the bottom, 20 meters, and surface. Chlorophyll samples (three, 50 ml replicates) were filtered for three size fractions: total, < 20 �m, and < 5 �m. Total chlorophyll filtration results will also be used for comparing data from the MK5 fluorometer. In addition, surface samples for phytoplankton species composition were collected at all pump stations for J. O'Reilly (NMFS). Chlorophyll analysis was conducted at sea using an acetone extraction method and results were read 24 hours later on a fluorometer. These results are not presented here because the fluorometer calibration required before the conversion to chlorophyll-a can be made was unavailable at the time of the cruise.
| Parameter | # samples taken |
|---|---|
| MK5 calibration | 38 |
| Oxygen isotope | 129 |
| Nutrients | 78 |
| Chlorophyll | 459 |
| Species composition | 17 |
Data:
The raw hydrographic data collected during this cruise were greatly improved over that collected during the previous broad-scale cruise, AL9506. A new slip ring assembly installed by electronic technicians Bruce Stone and Nic Previsich on the Mark V winch made all the difference. Almost all Mark V data were error free. During SeaBird-Bongo casts 4 and 5, the data displayed evidence of a boom wire termination problem. After cast 5, the situation improved when the termination was re-spliced and re-poured by electronic technician Henry Jenkins. More problems returned during Profiler cast 27 when data transfer from the instrument was again intermittent. The pigtail cable from back up profiler 0853 was substituted on the original profiler and afterwards the data looked good. This was short lived, however, when cast 30 yielded still more spiking. Peter Wiebe assembled a new pigtail cable and this solved all further spiking problems.
The SBE19 Profiler and the MK5 data were post-processed at sea. The Profiler data were processed using the SeaBird manufactured software: DATCNV, ALIGNCTD, BINAVG, DERIVE, ASCIIOUT to produce 1 decibar averaged ascii files. The raw MK5 data files were processed using the manufacturer's software CTDPOST in order to identify bad data scans by "first differencing." The latter program flags any data where the difference between sequential scans of each variable exceed some preset limit. The "Smart Editor" within CTDPOST was then used to interpolate over the flagged values. The cleaned raw data were converted into pressure averaged, pressure centered 1 decibar files using algorithms provided by R. Millard of WHOI, which had been adapted for use with the MK5.
Mark V CTD profiles were made at all 38 broad-scale Standard Station locations (Figure 2). The surface and bottom temperature and salinity distributions are shown in Figures 3 - 4. Surface and bottom anomalies of temperature and salinity as well as a stratification index (sigma-t difference from the surface to 30 meters) were calculated using the NMFS MARMAP hydrographic data set as a reference (Figures 5-7). Profiles of each CTD cast with a compressed listing of the data is given in Appendix 4.
The surface distribution figures show that the majority of the Bank, with the exception of the southwest corner, was slightly colder and fresher than the MARMAP reference. Scotian shelf water has been observed on the Bank in varying degrees since the first broad-scale survey in February. Standard Stations 17-23 showed salinities in the surface layer of approximately 32.0 psu.
Standard Stations 24 and 25, which are located on either side of the Northeast Channel, showed salinities >34.0 psu at depths of 100 and 75 meters respectively indicating the entrance of Slope Water through the Channel and into the Gulf of Maine. Standard Station 34 located in the western portion of Franklin Basin, is characterized by a bottom salinity of >34.0 psu, indicating that Slope Water did extend westward into the Gulf of Maine.
The stratification anomaly distribution (Figure 7B) shows that the southwest region of the Bank was slightly more stratified than the MARMAP expected level which may be the result of the recent passage of a warm-core ring. Also, the Northeast peak region showed a positive stratification anomaly which may be caused by an entrainment of fresher water originating from the Scotian shelf.
The volume average temperature and salinity of the upper 30 meters were calculated for the Bank as a whole and for four sub-regions. These values are compared with characteristic values that have been calculated from the MARMAP data set for the same areas and calendar days (Figure 6). The volume of Georges Bank water (salinity < 34 psu) was also calculated and compared against the expected values. The Bank as a whole showed temperature and salinity properties slightly colder (0.1 - 1.0 ) and fresher (0.00 - 0.3 psu) than the expected conditions for mid July.
Table 1. Station/cast inventory of the primary hydrographic data during Broad-scale survey ALBATROSS 9508.
Cast# Instrument standard station # consecutive station #
001 MK5 001 001
002 MK5 002 002
003 MK5 003 003
004 MK5 004 004
005 MK5 005 005
006 MK5 006 006
007 MK5 007 007
008 MK5 008 008
009 MK5 009 009
010 MK5 010 010
011 MK5 011 011
012 MK5 012 012
013 MK5 013 013
014 MK5 014 014
015 MK5 015 015
016 MK5 016 016
017 MK5 017 017
018 MK5 018 018
019 MK5 019 019
020 MK5 020 020
021 MK5 021 021
022 MK5 022 022
023 MK5 023 023
024 MK5 024 024
025 MK5 025 025
026 MK5 026 026
027 MK5 027 027
028 MK5 028 028
029 MK5 029 029
030 MK5 030 030
031 MK5 032 031
032 MK5 031 032
033 MK5 033 033
034 MK5 034 034
035 MK5 035 035
036 MK5 036 036
---- ----- ---- 037
---- ----- ---- 038
037 MK5 037 039
038 MK5 038 040
Ichthyoplankton and Zooplankton Sampling Methods.
(J. Sibunka, Jim Gibson, C. Miller)
Bongo tows were made with a 0.61m diameter frame fitted with paired 335 �m mesh nets. A 45-kilogram ball was attached beneath the Bongo frame to depress the sampler. Digital flow meters were suspended in the mouth of each net to determine the volume of water filtered. Tows were made according to standard MARMAP procedures, (i.e., oblique from surface to within five meters of bottom or to a maximum depth of 200 meters while maintaining a constant wire angle throughout the tow). Wire payout and retrieval rates were 50 m/min and 20 m/min respectively. These rates were reduced down in shallow water (<60 m) to obtain a minimum of a five minute tow. A SeaBird CTD was attached to the towing wire above the Bongo to monitor sampling depth in real time mode and to measure and record temperature and salinity. Once back on board, the 335 �m mesh nets were each rinsed with seawater into a 335 �m mesh sieve. The contents of one sieve was preserved in 4% formalin and kept for ichthyoplankton species composition, abundance, and distribution. At selected stations, the sample from the other net was preserved in 10% formalin and kept cool at refrigerator temperature. These special samples are to be sorted for cunner (Tautogolabrus adspersus) larvae as part of a neurological study at the Virginia Institute of Marine Science (VIMS); otherwise the contents of this net was discarded.
The 1-m2 MOCNESS sampler was loaded with ten nets. Nets 1-4 were fitted with 150 �m mesh for the collection of older and larger copepod copepodite and adult stages of the zooplankton. Nets 0, and 5-8 were fitted with.335 �m mesh for zooplankton (nets 0 and 5) and ichthyoplankton (nets 6-8) collection. Tows were double oblique (W) from the surface to within 10 meters from the bottom. The maximum tow depth for nets 0, 1, and 5 was 500 m, and for net #6, 200 m (net #5 was deployed to 500 m and then brought up to 200 m whereby net # 6 was then opened). Winch rates for nets 0-5 were 15 m/min and for nets 6-8, 10 m/min. The depth strata sampled were 0-15 m, 15-40 m, 40-100 m, and >100 m. The first (#0) and sixth (#5) nets were integrated hauls. For shallow stations, with only 2 or 3 of the depth strata, not all nets were fished. The contents of nets 0-4 were sieved through 150 �m mesh, subsampled using a plankton splitter if the final volume was too large, then preserved in 10% formalin. Samples from nets 5-8 were sieved through 335 �m mesh and preserved in 95% ethanol. After 24 hours of initial preservation, the alcohol was changed. The used ethanol was retained for disposal or recycling ashore. At selected sites, 90-ml subsamples from the bottom and surface 150 �m mesh nets were removed and preserved separately in formalin. Fifteen live C-5 Calanus copepodites from each of the two depth strata sampled were sorted out for additional work. Digital still images of individual copepods were collected and the corresponding animals were frozen in liquid nitrogen for subsequent laboratory analysis. Thin layer flame chromatography will be used to determine total lipid amount and the ratio of triglycerides (TAG, thought to represent short term energy storage) and wax esters (WE, long term energy storage).
The 10-m2 MOCNESS was loaded with five 3-mm mesh nets. Tows were oblique from surface to 10 m from bottom or a maximum depth of 400 m. The same depth strata were sampled as with the 1-m2 MOCNESS. The winch rate for retrieval varied between 5 and 15 m/min depending on the depth stratum. The slow winch rates were used in order to filter at least 4,000-5,000 m3 of water per depth stratum sampled. A stepped oblique tow profile during retrieval was used, if needed, to achieve this. Catches were sorted for larval and juvenile cod and haddock. Specimens were to be measured to the nearest millimeter on a metric ruler and preserved in 95% ethanol. The rest of the sample was sieved through a 335 �m mesh, and preserved in 10% formalin.
A Pacer high-volume pump was used to collect nauplii and younger, smaller copepodite stages of zooplankton. The intake hose was deployed off the port side on the boom hydro-wire. The hose was attached to the wire by a section of PVC with Niskin bottle clamps. Two 45-kg weights were used to depress the array. A SeaBird CTD was attached to the winch wire below the hose intake and used to monitor cast depth. During favorable weather conditions, or at shallow water stations, the SeaBird CTD was not used. Cast depth was instead monitored by use of the meter block on the boom winch. Wire angles were usually close to zero and any deviation greater than 15 degrees was noted for depth corrections. Three 30-m sections of 7�cm diameter hose were connected to the pump, allowing the intake hose to attain a maximum depth of approximately 70 meters. At stations where the water depth was less than 50 m, only two sections of pump hose were generally used. At shallow stations the intake hose nozzle was lowered to 3-5 m off the bottom. Three integrated depth samples were collected with 50 �m mesh nets, sieved through a 40 �m mesh and preserved in 10% formalin. Sampling depths were from the maximum depth to 36 m, 36-12 m, and 12-0 m. Before samples were collected, water was diverted from going into the net and was allowed to flush for 60 seconds if three sections of pump hose were used, and for 45 seconds if only two sections of hose were used. This assured that the zooplankton from the desired strata were obtained. The hose was again flushed at the surface for 60 seconds. This allowed the water to pass completely through the hose. Wire retrieval rate was approximately 4 m/min. This rate was used to obtain volumes of 500 L per 5-m depth interval sampled.
Additional pump casts were made this cruise at both selected broad-scale Standard Stations and at designated new stations. The purpose was to define and quantify suspended sand particles within the water column and correlate their effect on acoustic profiling. Refer to the section "High Frequency Acoustics", by P. Wiebe et al., in this report for details of sampling protocol employed.
Equipment Notes:
The pump sampling system worked very well on the port side with the boom. The MKV-CTD winch was repaired since the June survey and functioned well. The wire from the boom winch was used for the bongo and 1-m2 MOCNESS tows and also for deployment of the pump hose needed to be reterminated during the cruise. Thereafter, it was used without any problems. The computer in the scientific study laboratory did not allow copying and down loading of certain files. This resulted in time spent re-entering data. Perhaps the hard drive should be reconfigured and all programs re-entered.
Suggest Equipment for Future Surveys:
1. A printer for the computed located in the scientific study laboratory.
2. A bottom topography display monitor would help for attaining maximum sampling depth with scientific instruments deployed and avoid sand hills.
Samples Collected by the Zooplankton and Ichthyoplankton:
Gear Tows Number of Samples
1. Bongo nets, 0.61-m 38 tows
0.335-mm mesh 50 preserved, formalin
2. MOCNESS, 1-m2 38 tows
0.150-mm mesh 154 preserved, formalin
0.335-mm mesh 182 preserved, EtOH
3. MOCNESS, 10-m2 29 tows
3.0-mm mesh 108 preserved, formalin
4. Pump 21 profiles
0.050-mm mesh 81 preserved, formalin
Ichthyoplankton studies based on Bongo and MOCNESS tows.
(J. Sibunka, A. Chute, R. Jones, and A. Tesolin.)
Objectives:
Principle objectives of the ichthyoplankton group in the broad-scale part of the U.S. GLOBEC Georges Bank Program were to study the composition of the larval fish community on Georges Bank, to define larval fish distribution across the Bank and vertically within the water column, to determine those factors which influence their vertical distribution, and to determine bank-wide versus "Patch-Study" mortality and growth rates. Emphasis in this study is on cod and haddock larvae along with their predators and prey. This study includes larval distribution and abundance, analysis of feeding habits, and age and growth determination.
Preliminary Findings.
Samples collected at 38 GLOBEC broad-scale Standard Stations for ichthyoplankton analysis from both the Bongo and 1-m2 MOCNESS (nets 6-9) were examined on shipboard for the presence of fish eggs and larvae. This was done in an attempt to determine their occurrence on the Bank and obtain a gross estimate of distribution, abundance and size range. The following discussion on ichthyoplankton catches is based on these findings.
Ichthyoplankton catches during this cruise were dominated by yellowtail flounder (Pleuronectes ferrugineous) larvae. This is the first occurrence of this species in the plankton samples collected on broad-scale cruises this year. Yellowtail flounder is a spring and summer spawner on Georges Bank, and their larvae should be present on the Bank into the early fall months. Most of the yellowtail larvae collected this cruise were found along the south-central portion of the Bank, with the largest numbers of larvae taken in the south-west portion of Georges Bank (Figure 8A). The size of larvae collected ranged from 4-20 mm total length, with most larvae between 8-16 mm in length. The smaller larvae (<5 mm total length) were collected at stations occupied in the south-central area of the Bank. The size range of larvae collected this cruise indicates that spawning for this species has been underway for several weeks and is currently in progress. The fertilized eggs of yellowtail flounder (size range 0.80-0.90 mm diameter) complete incubation in about five days at water temperatures between 10.0 to 11.0 C. This temperature range is similar to temperatures found on the Bank during this cruise. Metamorphosis (eye migration) for this species is complete at about 14 mm length. Thereafter, according to the literature, they become bottom oriented.
Windowpane flounder (Scophthalmus aquosus) larvae (size range 7-15 mm total length) were collected at several stations located across the central and north-central portion of Georges Bank. The largest catches were made at broad-scale standard stations 11, 12, and 32 (Figure 8B). This species is also a spring and summer spawner on the Bank. The incubation period of the fertilized windowpane flounder eggs (size range 0.95-1.05 mm diameter) is about eight days at water temperatures between 10.5 to 13.0 C, temperatures found to occur on the Bank during this survey. The larvae hatch at about 2.0 mm length. Metamorphosis (eye migration) is complete at approximately 10.0 mm length and the larvae at this stage are one month old. Thereafter these larvae become bottom oriented.
Examination of the ichthyoplankton samples collected this cruise showed concentrations of fish eggs (size 1.0 mm diameter) to occur on both the west-central portion and the Northeast Peak area of Georges Bank. This indicates that spawning for several fish species of summer spawners is underway on the Bank. Some of these summer spawners would include four-spot flounder (Paralichthys oblongus), yellowtail flounder (Pleuronectes ferrugineous), windowpane flounder (Scophthalmus aquosus), silver hake (Merluccius bilinearis), and hake (Urophysis sp).
Only one haddock (Melanogrammus aeglefinnus) larvae (size 18 mm total length) was collected this cruise at broad-scale Standard Station 31. No cod (Gadus morhua) larvae nor any cod/haddock eggs were seen in the ichthyoplankton samples examined from this survey. These results support the observation noted on previous broad-scale cruises made this year, that spawning for both of these species peaked an ended earlier than expected this spawning season. Historical MARMAP data indicated that both cod and haddock eggs and larvae should still be present on the Bank, but in small numbers.
Silver hake (Merluccius bilinerais) larvae were not seen in the ichthyoplankton samples collected this survey. As this is considered a spring and summer spawner on the Bank, their absence in catches this cruise is noteworthy. No explanation for this observation can be given at this time.
Miscellaneous Fish Larvae:
The following fish larvae were also identified in the ichthyoplankton samples collected during this broad-scale survey.
1. Lanternfish Myctophidae
2. Hake Urophycis spp.
3. Atlantic mackerel Scomber scombrus
4. Witch flounder Glyptocephalus cynoglossus
5. Fourbeard rockling Enchelyopus cimbrus
6. Cusk Brosme brosme
Zooplankton studies based on Bongo and MOCNESS tows.
(Charles B. Miller and Jim Gibson)
Objectives:
The primary objective of the zooplankton group was to carry out a Bank-wide area survey of Georges Bank to determine the distribution, abundance, and stage composition of the target species Calanus finmarchicus and Pseudocalanus spp. A second objective was to identify and quantify, the occurrence of the more abundant non-target species to describe the environment occupied by the target species. These objectives were implemented by using the 1-m2 MOCNESS, (a vertically discrete, multiple opening and closing net system) to sample the larger copepodite stages of the copepods and the other zooplankton, and a submersible pump system to sample the naupliar stages. See above section for more details on the sampling.
In addition, a continuing study of the lipids in Calanus finmarchicus was conducted by C. Miller. The objectives in this work were:
1) To examine the population development of C. finmarchicus, including the proportion of the population at each life history stage as well as the size frequency distribution of the stage V copepodite;
2) To compare the spatial and temporal variation in the lipid composition of individual stage V copepodites from a range of stations.
Preliminary Findings
Zooplankton samples were collected with the 1 m MOCNESS at all stations. Samples examined by C. Miller were those collected with 150 �m mesh nets in the target depth ranges of (>100-100 m), (100-40 m), (40-15 m), and (15-0 m). In July the zooplankton around and over Georges Bank were strongly segregated into two community groupings:
(A) Calanus finmarchicus and Sagitta elegans were present in deeper waters around the periphery of the Bank, especially on the western end, along the southern edge of the Gulf of Maine (GOM), and extending around onto the northeast peak (most notably at Station 26).. At night there were substantial numbers of Meganyctiphanes norvegica all through the water column. In contrast to May, surface samples mostly produced modest biomass of Calanus, while samples from below 100 m in GOM produced masses of resting copepodites. This was especially true of the Franklin Basin station 34. Stage composition of deep, apparently resting, stock was C5>C4>>C6 females. Deep C5's did not have evident ovaries; deep females were not full of ripening eggs. Oil accumulations were quite uniform in resting C5 in GOM, with few specimens showing the absolute bloating with oil observed in June 1994. At most stations the smaller surface stock included substantially more females, up to 30%. Some of those were definitely reproductive. Younger copepodites were occasionally significant at stations scattered in the SW sector and along the south flank. Why the stocks at those stations lagged in finishing the season is obscure. Pseudocalanus was only a major constituent of the zooplankton at early stations, particularly Station 1. In later parts of the cruise, Station 11 on, it was never a significant contributor to biomass.
(B) Centropages hamatus-Centropages typicus-Sagitta elegans-Clytia mixture at stations inside the 60 m line. Temora sp. was a minor component during this cruise. In some instances, particularly at Station 31, this mixture was found from 15-0 m suspended over plankton strongly dominated by C. finmarchicus. Both C. typicus and Clytia were not always present in this assemblage. C. typicus was in significant numbers, but by no means dominant, only at stations to the southwest and inside 60 m: e.g., 4, 11.
Herewith some further comments on particular species:
Sagitta elegans was very abundant at many sites. It was present in significant numbers at all stations inside the 60 m line. Some stations right along that isobath had massive numbers near the bottom. As in May, these were mostly juveniles with some seminal vesicle development, little ovarian growth. Over the entire region this species seems to be roughly in phase, no larger adults with advanced oocytes having been seen anywhere.
In contrast to May, coiled pteropods (Spiratella/Limacina) were not abundant at any station. A few specimens were seen from time to time in no readily discerned pattern. Similarly, Oithona, Metridia, and Euchaeta spp were not abundant at any station during this survey.
Amphipods and crab zoea were found in high numbers in some areas of the Bank.
Hydroids (Clytia) were present at a number of Standard Stations, particularly 4, 5, 10, 11, and 37. At a few stations to the southwest they made up a significant portion of the biomass, but none showed really high abundance as seen in 1994. They were absent (rare at least) from the NE peak and not seen at stations along the entire northern leg of the cruise. Again, as in May, "if on this expedition we had been looking freshly at the plankton without special attention to the possible presence of Clytia, we might have noted them, but certainly would not have been tempted to assign them special ecological significance." (from report of Al9505). At Station 37, there was a high concentration of hydroids at the bottom. About 100 colonies of these hydroids were removed from net 1 for culture studies being conducted by Barbara Sullivan at URI/GSO.
In contrast to all previous Broad-scale cruises through June, we saw no significant net phytoplankton anywhere. The very prolonged and patchy blooms of Coscinodiscus scattered over the Bank and Rhizosolenia blooms of the Nova Scotia current intrusion are clearly over.
Collections for Genetic Studies.
Knowledge of the origin or sources of the target species Calanus finmarchicus, which along with Pseudocalanus give rise to a late winter and spring time bloom of zooplankton on the Bank, is essential for understanding variations in the winter/spring production of zooplankton on the Bank. There are several sources for the individuals that come onto the Bank at the beginning of the production cycle (Gulf of Maine, Scotian Shelf, and Slope Water), but it is not possible on morphological grounds to tell where the individuals are coming from. Population genetics studies of Calanus, and Pseudocalanus and several other species (e.g. the euphausiid, Meganyctiphanes norvegica) are being conducted by A. Bucklin in an effort to identify genes which can be used to characterize dispersal patterns and pathways, and to provide a genetic basis upon which to gauge production on the Bank as a function of recruitment source. This work is tied directly to other efforts to identify sources of water coming onto the Bank and the fate of this water in the process of circulation and exchange across the Bank boundaries. On this cruise, samples were collected for genetic studies with net #5 on the 1-m2 MOCNESS which went obliquely from the surface to the maximum depth of tow (integrated downcast). Of the 38 MOCNESS tows made, 37 samples (all except station 4) were preserved in 95% ethyl alcohol for this analysis.
High Frequency Acoustics
(Peter Wiebe, Stein Kaartvedt, and Jackie Popp)
The primary focus of the bioacoustical effort on this cruise was to make high resolution volume backscattering measurements of plankton and nekton throughout the Georges Bank region. The acoustical data are intended to provide acoustical estimates of the spatial distribution of biomass of acoustical targets which span the size range of the target species (cod, haddock, Calanus, and Pseudocalanus) and their predators. Work on this cruise was designed to provide intensive continuous acoustic sampling along all the shipboard survey tracklines in order to cover the entire Georges Bank region. The spatial acoustical map is also intended to provide an essential link between the physical oceanographic conditions on the Bank and the biological distributions of the species as determined from the net collections at the stations distributed throughout the Georges Bank region. Continuous acoustic data between stations can be used to identify continuity or discontinuity in water column structure which can in turn be used to qualify the interpretation of biological and physical data based on the point source sampling.
The acoustic and environmental sensor packages were mounted in an ENDECO towed 5�foot V�fin fish nicknamed the "Greene Bomber". The towbody has dimensions of 1.5 m length x 1.5 m width x 0.9 m height, and, on this cruise, weighed approximately 100 kg in air. For the cruise, the interior of the fish was modified to provide mounting brackets for a pair of BioSonics, Inc. digital transducers (120 kHz and 420 kHz) and a transmit pressure case. The transducers were operated in a down-looking mode. In addition, an environmental sensing system was mounted inside the V-fin with temperature, conductivity, and fluorescence sensors placed in front of the fiberglass housing on a stainless steel round-stock framework. The tow-body was deployed from the starboard quarter of ALBATROSS and collected data both during and between stations. The preferred towing speed was 7 knots, but speeds up to 10 knots were reached; occasionally, under particular wind and sea conditions, slower speeds were required to prevent the v-fin from assuming a stable, albeit data destructive, position up against the hull. Acoustical data were successfully obtained along the entire cruise track (Standard Stations 1 to 38 - distance traveled was ~726 nm). A listing of the acoustic transects is given in Appendix 2.
The acoustical mapping revealed considerably higher backscattering than on previous cruises. The volume backscattering was so high that it originally was suspected that this might have been associated with new algorithms in the postprocessing software. All raw data are, however, stored, and this issue will be addressed after the cruise. Alternatively, the high backscatter may have been caused by sand in the water column (see below)
The large scale picture from the acoustical records showed relatively low volume backscattering off the Bank, increasing backscatter inwards on the Bank, with very high values on the top of the Bank (Figure 9). This large scale pattern was associated with changes in vertical structure. In the deeper part of the survey area (stratified waters), backscatter was typically stratified with highest values towards the surface, though considerable patchiness was observed both horizontally and vertically. As bottom depth shoaled and approached about 60-50 m, the vertical structure became more homogenous. This trend was substantiated further inward. At bottom depths of 40-30 m, the volume backscattering appeared to be completely homogeneously distributed vertically. At these depths, vertical striations (i.e. bands of horizontal patchiness) were recurrently observed, a phenomenon possibly associated with vertical circulation cells caused by tidal flow over a rough bottom.
The acoustics proved its potential to instantaneously map processes in the water column and should be a powerful tool in delineating regions of interests for later process studies. It is questionable, however, that the very high scattering at the top of the Bank is all of biological origin. Here, sand occurred both in the net and pump samples and was even sampled at the surface. As sand particles have a very different density from water they must be strong scatterers, and signals from sand may thus override those of biological origin.
Recognizing a need to quantify sand in the water column in order to provide a basis for interpreting the acoustic records, a short study was undertaken in the vicinity of Standard Station 36. Winds were light (< 10 kts) and the seas 1-2', except for a long period swell from Tropical Storm Chantal which was much less evident than earlier in the day. At that station which had a bottom depth of about 50 m, an additional pump profile was made from the surface to within 5 meters of the bottom. A SeaBird CTD was attached just above a clump weight and about 70 cm below the pump intake. Two 30 m sections of pipe were used during the deployments.
Samples were collected at 5, 15, 25, 35, and 45 m on both the down and up portions of the cast. Pumping at each depth was 5 minutes. A one minute flushing period preceded the actual filtering in order to clear the pipe of water from another depth. Filtering with a 50 �m mesh net was done for 5 minutes at each depth. Approximately, 2.0 m3 were filtered for each sample. Samples were carefully decanted in the collecting bucket and poured directly into the preserving jar with no intermediate sieving. A 5% buffered solution of formalin was the preserving fluid.
Little or no sand was present in the samples at Station 36. In examining the CTD profile, however, it was evident that the water was stratified due to a pcynocline about 10 m above the bottom. Mixing was not then taking place throughout the water column and sand would not be expected above the bottom mixed zone.
Following the completion of the pump profile at Station 36, we steamed east for an hour to a location (Consecutive Station 37) in somewhat shallower water (40-45 m). We had intended to work in still shallower water, but we were quickly set off the shallow area by the strong tidal current (~1.7 knots) which was then flowing to the northwest. There we did a profile to the bottom at 5 meter intervals (i.e. 5,10,15,20,25,30 35, 40 m) sampling only in the down direction. The water column was isothermal and isohaline from top to bottom; it appeared to be well-mixed. Sand was present in all but the 5 meter sample. There was a gradient with increasing sand in the deeper samples.
In order to get a profile at an even shallower area, we steamed about 7 nm to a point just south of a shoal area with minimum depths of about 20 m (Station 38). The pump profile was started as we drifted north with the tidal current back over the shallowest area at a speed of about 1.5-2.0 kts. Sampling was again at 5 m intervals. On the down cast, depths of 5, 10, and 15 m were sampled. On the up cast, those depths plus the surface were sampled. About 10 minutes after completion of the first cast, a second lowering (still the same cast number) was started in slightly deeper water which started out at ~25 m and ended at 35 to 40 m. Sampling on only the down cast was at 0, 5, 10, 15, 25, and 35 m. In the first cast, sand was present at all depths; more was collected deeper, but a substantial amount was collected at the surface. In the second cast, sand was also present at all depths.
During the Sand Experiments, the acoustic backscattering throughout the water column was strongest at Consecutive Station 38, the shallowest area, was lower at Consecutive Station 37, and was lowest at Standard Station 36. The sv for the 420 kHz system was higher than for the 120 kHz at Consecutive Stations 38 and 37, but not Station 36. Qualitatively, the volume backscattering appeared to be directly related to the amount of sand present in the water column. The differences in sv between the two frequencies may be due to differences in the grain size of the sand at study sites.
These facts, together with observations of sand being collected in other pump and net tows strongly suggests that "sand storms" are a broadly occurring feature of the shallow areas of Georges Bank. This phenomena must have significant ecological impact on the ecology of the region causing some species (such as mucilaginous filter feeders such as pteropods and salps) to have a difficult time in regions of high sand suspension.
Internal waves were particularly evident in the stratified waters at the edge of the Bank. They were usually centered between 15 and 30 meters (in the pcynocline) and typically had amplitudes of 10 to 15 meters. Between Stations 23 and 24 on the Northeast Peak, a particular large internal wave packet was observed with amplitudes of about 25 meters (Figure 10).
No diel changes in vertical distribution could be seen in the acoustical records on the Bank, while diel vertical migration was apparent in deep waters off the Bank (Slope Water, Northeast Channel, Georges Basin, and Wilkinson Basin).
Equipment Notes:
On future cruises, it would be very useful to have a second monitor displaying the acoustic records in the location where the MOCNESS is flown so that the bottom topography and volume backscattering in the water column can be directly observed by the MOCNESS operator.
Drifter Deployments.
As part of the physical oceanographic studies of the current structure and circulation on Georges Bank being conducted by R. Beardsley and R. Limeburner, GLOBEC Drifter Buoys are deployed at strategic locations periodically throughout the year to track the Lagrangian flow from the point of deployment. This drifter is constructed with a holey sock drogue (a Dacron cylinder 90 cm diameter by 3 m tall with 5 circular hoop stays) at the bottom connected by 15 m of cable to a small float (18 cm diameter) which in turn is connected by about 2.6 m of cable to a larger
spherical surface float (about 32 cm diameter). The surface float contains a sea surface temperature sensor, a GPS receiver, and an ARGOS satellite transmitter. Temperature, time, and position data are transmitted periodically to shore through the ARGOS telemetry system. On this cruise, five drifters were deployed along a line running from east of Cultivator Shoal out into the Gulf of Maine (Franklin Basin) and including Standard Station 34. Their positions are given in the event log.
Shipboard ADCP (Acoustic Doppler Current Profiler) measurements.
The flow field over Georges Bank is driven by a complex set of forces. A primary factor is the strong semidiurnal tides which dominate the high frequency variability (< 1cpd) of the currents. Tidal rectification gives rise to a persistent subinertial clockwise circulation over the Bank. This circulation process can be substantially modified by the frequent storms common to the area, changes in the stratification of the Bank, and interactions with currents generated by offshore circulation features (i.e. Warm-Core Rings).
The Acoustic Doppler Current Profiler is one of the instruments being used to study the circulation processes on the Bank by J. Candela and C. Flagg. Water current measurements were obtained using a 300 kHz RDI ADCP continuously during the entire cruise. The transducers were mounted on the hull of the ship (5 m below the surface). The instrument was programmed to measure the current profile under the ship with a vertical resolution of 2 m, from 10 m depth to about 10 m from the bottom or up to a depth of about 120 m, whichever was shallower at a given location. The ADCP measures currents with respect to the ship. To obtain the water current with respect to the ocean bottom, the ship's motion needs to be removed from the current observations. The ship's motion will be removed using the bottom track (BT) velocity measured by the ADCP. Depending upon sea conditions, the ADCP can perform this operation in water depths shallower than 200 to 230 m. When the BT is lost, accurate navigation will be used to remove the ship's velocity from the current.
The ADCP data collected on this cruise will be post-processed at Woods Hole Oceanographic Institution by Candela and Flagg.
Scientific
Name Title Organization
1. Peter H. Wiebe Chief Scientist WHOI, Woods Hole, MA
2. Charles B. Miller Scientist OSU, Corvallis, OR
3. John Sibunka Scientist NMFS/NEFSC, Sandy Hook
4. Stein Kaartvedt Scientist Univ. Oslo, Oslo, Norway
5. Jackie Popp Research Assoc. Cornell Univ. Ithaca, NY
6. Daniel Almgren Hydrographer NMFS/NEFSC, Woods Hole
7. Maria Kiladis Biol. Sci. Technician NMFS/NEFSC, Woods Hole
8. Jim Gibson Biol. Sci. Technician URI/GSO, Narragansett, RI.
9. Anthonie Chute Biol. Sci. Technician NMFS/NEFSC, Narragansett
10. Amy Tesolin Biol. Sci. Technician NMFS/NEFSC, Sandy Hook
11. Alyce Jaquet Biol. Sci. Technician URI/GSO, Narragansett, RI.
12. Rebecca Jones Biol. Sci. Technician NMFS/NEFSC, Narragansett
13. Jamie Bechtel Biol. Sci. Technician URI/GSO, Narragansett, RI.
14. Jenny Wunder Graduate Student URI/GSO, Narragansett, RI.
ALBATROSS IV NOAA Officers and Crew
15. John Moakley Commanding Officer
16. Jason Maddox Executive Officer
17. Christopher Kock Operations Officer
18. Leslie Redmond Navigation Officer
19. John Hurder Chief Marine Engineer
20. Charles Hersey 2nd Assist. Engineer
21. Larry Jackson 3rd Assist. Engineer
22. Orlando Thompson Oiler
23. John Cravo Lead Fisherman
24. Antonio Alvernaz Lead Fisherman
25. Eugene Magan Skilled Fisherman
26. Harold Bowen Ordinary Fisherman
27. John Braxton Chief Steward
28. Jerome Nelson 2nd Cook
29. Henry Jenkins Rotating Electronics Engineer
30. E.T. Allen Exchange Officer
Appendix 1. Data inventory - List of Underway and station Activities.
Appendix 2. Acoustic Data Summary and concomitant observations.
| Station | LAT N | LON W | Local | GMT | Data files | Concurrent or overlapping measurments | Remarks |
| Date Time on stn Time off stn | Date Time on stn Time off stn | ||||||
| 1 | 40 59.60 40 57.85 | 69 00.00 69 00.74 | July 11 0302 0550 | July 11 0702 0950 | GB001a.pro GB001b.pro
| Bongo, CTD, MOC 1, ADCP | 0516: Sunrise The Greene Bomber is in the water and acoustic data acquisition was initiated as we steamed to station 2. Salinity not giving good values. |
| 2 | 40 38.80 40 41.90
| 68 59.30 68 55.96 | July 11 0902 1050 | July 11 1302 1450 | GB002.pro | Bongo, CTD, MOC 1, ADCP | Pulled the Bomber out between 1039 and 1050 to check the connection on the CTD sensor. The Greene Bomber was lowered to ~ 3m below the sea surface. Salinity still not giving good values. |
| 3 | 40 31.68 40 32.05 | 68 26.81 68 27.21 | July 11 1400 1801 | July 11 1800 2201 | GB003a.pro GB003b.pro | Pump, Bongo, MOC 1 and ADCP | The MOC 10 trawl was not done due to a damaged flow meter. Salinity values no good. |
| 4 | 41 00.10 40 58.80 | 68 14.25 68 14.80 | July 11 2145 0207 | July 12 0145 0607 | GB004.pro | Pump. Bongo, MOC 1, MOC 10 and ADCP | 2012: Sunset MOC 10 did not drop the nets - re-deployed Seccond trial OK |
| 5 | 40 50 94 40 51.29 | 68 00 17 67 57.47 | July 12 0400 0910 | July 12 0800 1310 | GB005a.pro GB005b.pro | Bongo, MOC 1, MOC 10, ADCP | 0515: Sunrise Problems with the winch retrieving the MOC 10, but resolved. |
| 6 | 40 39.86 40 40.40 | 67 46.05 67 46.60 | July 12 1110 1330 | July 12 1510 1730 | GB006a.pro GB006b.pro | Bongo. CTD, MOC 1, MOC 10, ADCP | Cable broke - no MOC 10 taken at stn |
| 7 | 40 27 18 40 27.00 | 67 18 37 67 17.00 | July 12 1654 2303 | July 12 2054 0303 | GB007.pro | Pump, Bongo, MOC 1, MOC 10, ADCP | 2010: Sunset |
| 8 | 40 51.83 40 52.50 | 67 03 22 67 03.50 | July 13 0310 0613 | July 13 0710 1013 | GB008a.pro GB008b.pro | Bongo, MOC 1, CTD, ADCP | 0507: Sunrise 1 1/2h delay to fix termination on the boom winch cable. |
| 9 | 40 58.05 41 00.06 | 67 18.90 67 23.90 | July 13 0800 1057 | July 13 1200 1457 | GB009a.pro GB009b.pro | Pump, Bongo, MOC1, CTD, ADCP | 3 WHOI buoys sighted. |
| 10
| 41 04 95 41 04.90 | 67 38 98 67 38.40 | July 13 1225 1422
| July 13 1625 2022
| GB010a.pro GB010b.pro | Bongo, MOC 1, MOC 10, ADCP | |
| 11 | 41 13.78 41 12.76 | 67 57.78 67 57.50 | July 13 1640 1840
| July 13 2040 2240 | GB011a.pro Gb011b.pro | Bongo, CTD,MOC1, MOC10, ADCP | |
| 12 | 41 24.20 41 25.50
| 67 32.14 67 31.90 | July 13 2144 0015
| July 14 0144 0415 | GB012a.pro GB012b.pro | Pump, Bongo, CTD, MOC 1, MOC 10, ADCP | 2008: Sunset Copied data (acoustic and ESS) files. |
| 13 | 41 16.26 41 14.90 | 67 10 15 67 11.00 | July 14 0230 0525 | July 14 0630 0925 | GB013a.pro GB013b.pro | pump, bongo, MOC 1, MOC 10, ADCP | 0509: Sunrise Increasing wind, lots of noice near surface |
| 14 | 41 12.60 41 11.90
| 66 57.15 66 56.50 | July 14 0712 0925 | July 14 1112 1325 | GB014a.pro GB014b.pro
| Bongo, CTD, MOC 1, MOC10, ADCP | Greene Bomber out of the water for maintenance of transponder battery and to check the CTD connections. |
| 15 | 41 02 07 41 02.50 | 66 41 90 66 40.50 | July 14 1137 1305 | July 14 1537 1705 | GB015a.pro GB015b.pro | Bongo, CTD, MOC 1, ADCP | Possible damage of transducers (especially 420) underway to stn (see report) File GB0015a started about 30 min after arriving stn |
| 16 | 40 55.36 40 54.70 | 66 26.69 66 23.9 | July 14 1455 2227 | July 14/15 1855 0227 | GB016a.pro GB016b.pro | Pump, Bongo, MOC 1, MOC 10, ADCP | Transducers appear to have recovered |
| 17 | 41 11.74 41 12.80 | 66 27 10 66 25.60 | July 15 0035 0328 | July 15 0435 0728 | GB017a.pro GB017b | Pump, Bongo, MOC 1, MOC 10, ADCP | |
| 18 | 41 24.47 41 25.80 | 66 42.03 66 43.70 | July 15 0611 0910 | July 15 1011 1320 | GB018a.pro GB018b.pro | Pump, Bongo, CDT, MOC 1 MOC 10, ADCP | No time found for sunrise in ship's log. Copied acoustic data files to Bernoulli disk. Copied ESS data to diskette and then moved gb004*.*- gb014.*.* to d:\al9508\ESS_data (hd on the computer). |
| 19 | 41 36.13 41 40.80 | 66 58.39 66 54.50 | July 15 1103 1325 | July 15 1503 1725 | GB019a.pro GB019b.pro
| Bongo, CTD, MOC 1, MOC 10, ADCP | Problem with MOC 10, but resolved. |
| 20 | 41 43.92 41 42.40 | 66 32.32 66 30.40 | July 15 1525 1803 | July 15 1925 2203 | GB020a.pro Gb021b.pro | Pump, Bongo, CTD, MOC 1, MOC 10, ADCP | All logging systems turned off because ships GPS is down. On later turn off of GPS we let all our logging systems operating without any apparent problems. |
| 21 | 41 32.80 41 31.24 | 66 24.00 66 24.14 | July 15 1921 2151 | July 15/16 2321 0151 | GB021a.pro GB021b.pro | Bongo, CTD, MOC 1, MOC 10, ADCP | Sunset 2002: On the way to #22 crossed over a front. |
| 22 | 41 33.01 41 34.20 | 66 02 12 66 03.30 | July 16 0016 0154 | July 16 0416 0554 | GB022a.pro GB022b.pro | Bongo, CTD,MOC 1, ADCP | |
| 23 | 41 47.92 41 46.50 | 66 11 35 66 10.70 | July 16 0410 0657 | July 16 0810 1057 | GB023a.pro GB023b.pro | Pump, Bongo, MOC 1, MOC 10, ADCP | 0517: Sunrise Pump seen on the acoustics. GB23b.pro started at 0720 not right after the MOC 10 was retrieved at 0657. |
| 24 | 42 02.96 42 02.60 | 65 57.12 65 56.50 | July 16 0938 1210 | July 16 1338 1610 | GB024a.pro GB024b.pro | Bongo, CTD, MOC 1, ADCP | The Greene Bomber was pulled to check for damage due to going under the hull while steaming from 23 to 24. Everything seems to be operational. Acoustic and ESS data files were copied to other drives. |
| 25 | 42 14.48 42 11.80 | 65 39 80 65 36.80 | July 16 1425 1730 | July 16 1825 2130 | GB025a.pro GB025b.pro | Pump, Bongo, CTD, MOC 1, MOC 10, ADCP | Pump seen on acoustics |
| 26 | 42 04.05 42 05.88 | 66 25.86 66 28.61 | July16 2206 0017 | July17 0206 0417 | GB026a.pro GB026b.pro | Bongo, CTD, MOC 1, MOC 10. | 1959: Sunset |
| 27 | 41 56.56 41 54.30 | 66 41 79 66 39.70 | July 17 0210 0640 | July 17 0610 1040 | GB027a GB027b | Pump, Bongo, MOC 1, MOC 10, ADCP | Problems with the SeaBird. Problems with MOC 1 and MOC 10 on this station as well. |
| 28 | 42 06.00 42 06.21
| 66 53.80 66 53.84 | July 17 0903 1127 | July 17 1303 1527 | GB028a.pro Gb028b.pro | Bongo, CTD, MOC 1, MOC 10, ADCP | Bongo delayed due to communication problems, so the MOC 10 was deployed first. Problem was resolved and the Bongo flew after the MOC 10. |
| 29
| 42 17.95 42 16.90 | 66 53 72 66 51.10 | July 17 1250 1828 | July 17 1650 2228 | GB029a GB029b GB029b2.pro | Pump, Bongo, MOC 1, MOC 10, ADCP | GB029b.pro stopped prematurely, so GB029b2.pro contains the ESS data for the remainder of this leg. |
| 30 | 41 55.44 41 56.70 | 67 14.25 67 16.70 | July 17 2136 0048
| July 18 0136 0448
| GB030a.pro GB030b.pro | MOC 10, CTD, Bongo, MOC1, ADCP | The Greene Bomber was pulled to change the battery in the transponder. When the data acquistion was initially started, verical lines were apparent in the 120 (not normal). Reset the computer and 48v. Initially there were more lines, but as we got u/w they disappeared. NO acoustic data between 2314-2330. May have spurious data between 2309-2314. Problems with the cable on the SeBbird.. We are skipping stn 31 due to weather forcast, and are heading directly for stn 32 |
| 32 | 41 42.47 41 42.57 | 67 39 42 67 39.08 | July 18 0435 0621 | July 18 0835 1021 | GB032a.pro GB032b.pro | Bongo, MOC 1, MOC 10, ADCP | heading directly for stn 32 |
| 31 | 42 03.05 42 02.20 | 67 38.90 67 42.00 | July 18 0912 1046 | July 18 1312 1446 | GB031a.pro GB031b | Bongo, CTD, MOC 1, ADCP | Decide to go back and do station 31. Fish went under the hull at 0650 for less than 1 minute. CTD cast seen on the acoustics. |
| 33 | 41 50.02 41 50.70 | 68 00 05 68 00.60 | July 18 1302 1433 | July 18 1702 1833 | GB031a.pro GB031b.pro | Bongo, CTD, MOC1, ADCP | |
| D1 | 41 41.30 | 68 07.5 | July 18 1608 | July 18 2008 | GB031b.pro | Drifter # 1 deployed | |
| D2 | 41 46.20 | 68 11.8 | July 18 1705 | July 18 2105 | GB031b.pro | Drifter #2 deployed | |
| D3 | 41 50.67 | 68 17.61 | July 18 1805 | July 18 2205 | GB031b.pro | Drifter #3 deployed while on station #34. | |
| 34
| 41 50.60 41 51.70 | 68 17.68 68 16.40 | July 18 1803 2215 | July 18 2203 0115 | GB034a.pro GB034b.pro | Pump, Bongo, CTD, MOC 1, MOC 10, ADCP
| 1952: Sunset Pump seen on the echogram.
|
| D4 | 41 56.86 | 68 20.14 | July 18 2301 | July 19 0301 | GB034b.pro | Drifter #4 deployed. | |
| D5 | 42 01.00 | 68 24.40 | July 18 2354 | July 19 0354 | GB034b.pro | Drifter #5 deployed. | |
| 35 | 41 36.21 41 36.30 | 68 26 92 68 26.3 | July 19 0340 0450 | July 19 0740 0850 | GB035a.pro GB035b.pro | Bongo, CTD, MOC 1, ADCP | |
| 36 | 41 23.59 41 24.60 | 68 18.09 68 20.30 | July 19 0654 0852 | July 19 1054 1252 | GB036a.pro | Pump, Bongo, CTD, MOC 1, MOC 10 | GB036a.pro-starts at 0710 and ends at 1135 |
| 36(sand) | 41 24.10 41 23.48 | 68 20.1 68 20.05 | July 19 1003 1137 | July 19 1403 1537 | GB036a.pro | Pump, Seabird | Down and up sampling. |
| Sand 1 | 41 24.40 41 26.42 | 68 09.0 68 10.38 | July 19 1240 1407 | July 19 1640 1807 | Gbsand1.pro | Pump, Seabird | Down sampling only. Gbsand1.pro was not started. Consecutive Station 37 |
| Sand 2 | 41 19.70 41 21.85 | 68 10.2 68 10.10 | July 19 1539 1620 | July 19 1939 2020 | Gbsand1b.pro | Pump, Seabird | Down and up sampling. Gbsand1b.pro starts at 1417 and ends at 1958. Consecutive Station 38 |
| Sand 3 | 41 22.13 41 22.75 | 68 10.01 68 09.88 | July 19 1622 1705
| July 19 2022 2105
| Gbsand1b.pro | Pump, Seabird | This is where we drifted to a deeper area--downcast only. Consecutive Station 38 (continued) |
| 37 | 41 17.92 41 16.34 | 68 35.80 68 36.50 | July 19 1956 2103 | July 19 2356 0103 | GB037a.pro | Bongo, CTD, MOC 1 | 1954: Sunset Greene Bomber pulled at the end of this station for 5 minutes to untwist cables. Consecutive Station 39 |
| 38 | 41 29.40 41 30.30 | 68 57.20 69 00.20 | July 20 0010 0345 | July 20 0410 0745 | GB038.pro | Pump, Bongo, MOC 1, MOC 10 | lat and long recorded about 40 min after arrival stn. Acoustic powerd down before end of data aquisition of ESS. Was not able to close file GB038. Consecutive Station 40 |
Appendix 3. Summary of observations made of the zooplankton samples.
A few notes follow taken from C. Miller's station-by-station (but not including all stations) log of sample observations:
At Station 1 Calanus were C4 (some), C5 (mostly) and adults (some). At Station 2 there was a complete range of copepodites: C1-C5. Hard to say what was dominant. At Station 3, we were back to the mix of Station 01. I looked carefully again at Station 6; it too was mostly C4 and C5. Some C4 molt skins were present. Females were moderately abundant, far more that a typical resting stage mixture. C5 seem small on average, probably attributable to the much warmer development temperature than that of any I've seen before. Pseudocalanus have been very numerous, giving the impression at Station 1 of being the biomass dominant. We have seen only occasional Centropages typicus (one prominently blue), no C. hamatus. Sagitta elegans is extremely abundant at some of the stations, with some samples looking like straw piles. I have yet to see a phytoplankton cell.
13 July - Station 10 - MOC-1, Net 1 (50-40m). This is an on-bank assemblage. Lots of Temora, Pseudocalanus, some Centropages typicus, chaetognaths, a few hydroids. There are Calanus in the mix, most of the live ones are C3-C4. The C5 and C6F were DOA, well decayed in a sample pretty well handled.
Station 10, Net 3 (15-0): By the time I studied this sample, most individuals were dead. They do not, however, look to be in advanced decay like those in Net 1. This is mostly Calanus, a mixture of all stages, although C1 are rare. So, essentially, C1-C5. I see no females. Since there were not so many in either the bottom or middle samples as in this top sample, it is clear there is no major diel vertical migration in progress. The sample was taken at ca. 13:30 DST.
13 July ca. 1700 - Station 11 - up on the Bank. Here the plankton is completely converted to shallow bank character: Clytia, Sagitta, Centropages hamatus. The Clytia are quite abundant. Those three species share the biomass about equally. There are a few Calanus, Pseudocalanus, Centropages typicus, Temora, but not significant as contributors to biomass. This situation was apparently also found in June, but I did not see it in May. So, it appears to develop rapidly in conjunction with early water column warming. Centropages hamatus is present in all copepodite stages in good abundance. Males and females are about equally abundant and some females are carrying spermatophores.
14 July, Station 15, 12:03 hr, south edge of Bank at 80 m. Subsamples from Nets 1 and 3. All nets had very little plankton, and Net 2 hardly had enough to justify a subsample (I didn't take one). Net 1 had mostly C5 Calanus, some C4. The C5 were very fatty. Net 3 had mostly C4 Calanus, the C5 individuals were small with small oil accumulation.
15 July, Station 17, 01:30 hr, south edge of the Bank farther east. Again, very small samples, even smaller than at Station 15.
15 July, Station 19, 12:00 hr, just short of up on the Bank at 60 m. Chaetognath, Centropages spp. mix, with a small admixture of Calanus.
15 July, Station 20, 17:30 h. Again, the chaetognath-Centropages mix with a small admixture of Calanus.
15 July, Station 21, 20:30 h. Looks just like Station 20, perhaps somewhat less biomass.
16 July, Station 22, 00:30 hr. Water column depth=113. It was just barely possible to find 16 Calanus C5 in Net 1 (deepest). Females were slightly more abundant. The bulk of the biomass was Thysanoessa gregaria and Nematocelis megalops, with very little else in the sample. Nets 2 and 3 were quite rich in those two euphausiids, plus some Meganyctiphanes. Net 3 had more of all than Net 2. There were a few Calanus C5 and females.
16 July, Station 22, 11:30 hr, Water column=180m. Net 1 - very few copepods; mixture of mostly T. gregaria and N. megalops. Net 2: a few amphipods and very few copepods. Net 3: No euphausiids; almost exclusively Calanus C5. Net 4: Like Net 3, somewhat less (less volume filtered).
16 July, Station 25, 15:30 hr. Water column=114 (over on Nova Scotian shelf). Nets 1 to 3 all very small amounts of plankton. Net 1 had most, a mix of Calanus late stages and some salps. Net 2 virtually empty. Net 3 had Calanus late stages (C4 to female), numerous Oithona, an admixture of lower latitude copepods, and T. gregaria. There was also one large (well, 8 cm diameter) brown jellyfish.
16 July, Station 26, 23:30 hr. Nets 1 and 3 with modest numbers of late stage Calanus, mostly C5 (some C4, few females). By no means a strawberry daquiri haul. C5 in net 3 with variable oil quantity (mostly quite a bit); all feeding, showing pale green guts. Net 2 very sparse, same stuff. Some Meganyctiphanes. Almost nothing else in these samples. No chaetognaths. I saw one Centropages copepodite. Few small copepods of any kind.
17 July, Station 29 , 23:00 hr. Net 1 (>300 to 100 m) loaded with late stage Calanus: C5>females (quite abundant)>C4. All other nets looked like contamination from passing through this layer twice. Nothing in them but a teaspoon of Calanus. Net 4 (15-0 m) had somewhat more than 2 and 3; however, all specimens were in very battered shape (not DOA, just died in net).
18 July, Station 31, 1:15 hr. was fascinating. We were over ca. 120 m and towed to 115 m. This is just at the bank edge as the bottom slopes off into the GOM. The bottom tow was just 15 m thick, and it contained almost exclusively resting Calanus. The next tow (100-40 m) was nearly empty, the next contained some Calanus, and the top 15 m was a nearly pure bank assemblage. I thought we should interpret this as bank stuff being wafted out over the GOM, breaking through the wall, or the wall taking a surface loop to the north. Peter Wiebe thinks it could be on shore flow from depth turning at back gulfward near the surface, hence the Calanus in Net 3, and carrying entraining some surface layer full of bank stuff. Stein Kaartvedt thinks we may just have moved inshore as we towed. Well, it was interesting, and I haven't seen it before.
18 July, Station 33, 14:00 hr. was pure Bank stuff all the way down. Except, there are now no hydroids. I think that is because I have a Barbara Sullivan request to collect them for culture.
19 July, ca. 22:30 hr, Station 34, off the bank edge. Abundant Calanus in Net 1 (215-100 m over 220 m), mostly C5, all resting. Many less in Net 2. More again, this time with perhaps 40% females in Net 3. Net 4 had a small admixture of Calanus in mostly 'bank mix.' The water column is warm at surface, cool in intermediate layers and warmer again (8C) near the bottom.
19 July, O4:30 hr, Station 35, along bank edge at 72 m. Net 1 predominantly chaetognaths with some Centropages hamatus (no C. typicus) and more Pseudocalanus than I've seen since early in the cruise (we're back west). There were a few Calanus C5, not an important component. Nets 2 and 3 had small catches that were the same stuff on gross inspection. They both included substantial numbers of Pleurobrachia that weren't present in Net 1. The alcohol preserved sample from Net 6 is loaded with chaetognaths.
20 July, Station 38, 03:00, water column 155 m. Net 1 (155-100 m) was a massive load of Calanus resting stages: C5>>C4>C6F. Nets 2, 3 and 4 were all light. Net 4 had more Calanus than anything else, with ca. 10% females, some ripe.
Appendix 4. CTD plots and compressed listing of the data.
Figure 8. (A) Preliminary distribution and relative abundance of yellowtail flounder larvae from Bongo and 1-m2 MOCNESS catches. R/V ALBATROSS IV GLOBEC broad-scale cruise AL9508, 10-20 July 1995. (B) Preliminary distribution and relative abundance of larval windowpane flounder larvae from Bongo and 1-m2 MOCNESS catches.
Figure 9. A 3-D view of the volume backscattering at 120 kHz along tracklines between Standard Stations 9-10, 10-11 and 11-12. The first two tracklines run from south to north from the stratified region on the southern flank of the Bank to the top of the Bank. The latter runs from west to east (perpendicular) to the first two lines along the top of the Bank. Note the very intense backscattering along the top of the Bank which may be due to sand particles in the water column. See color bar on Figure 10 for color scaling.
Figure 10. An example of the acoustic characterization of internal waves which were a common feature in the acoustic records from the stratified regions of Georges Bank during cruise R/V ALBATROSS IV cruise 9508.