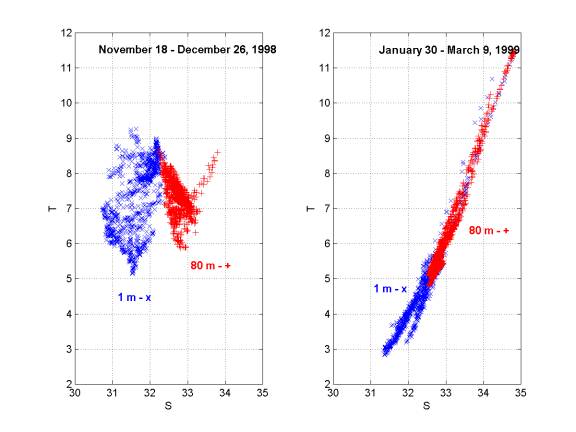
Figure D2. Temperature-salinity diagrams at EF for the 38-day period
November 18 - December 26, 1998 (left) and the 38-day period January 30 - March 9, 1999
(right). Note the existence of Scotian
Shelf water with S < 32 during both periods, but the presence of tighter
mixing lines during the second period between the much colder Scotian Shelf
water (T<4,S<32) and slope water (T>11, S>34.7).