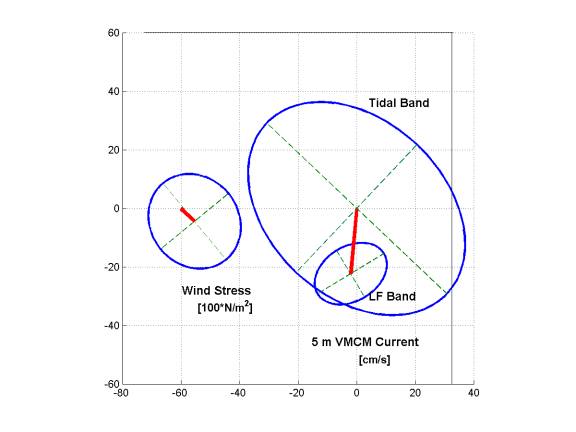
Figure D3. Plot of the
principal axes ellipse for the 5-m current at EF and the wind stress at NDBC
44011. The ellipses for the tidal band
current (T<33hr) and the low-frequency (subtidal: T>33hr) current are
shown. The subtidal ellipse is plotted
at the end of the mean current vector, oriented almost due south.
The wind stress ellipse is also plotted at
the end of the mean wind stress, oriented towards the southeast.
The wind stress has been scaled up by 100 to
simply plotting; the mean wind stress is about 0.06 N/m2.