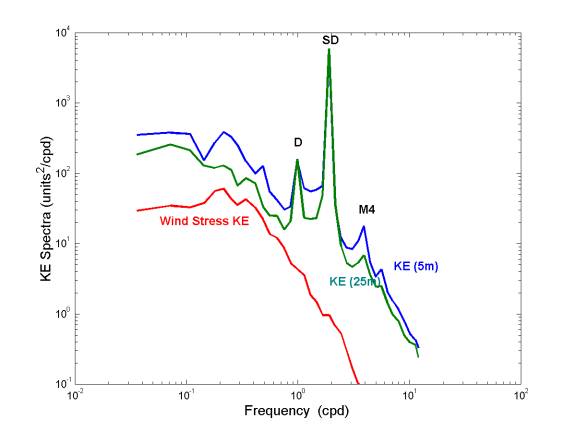
Figure D4. Spectrum of kinetic energy at EF at 5 m (blue) and 25 m (brown) and wind
stress variance at NDBC 44011 computed using hourly data for the initial
112-day winter period. The wind stress
KE has been scaled up so that all spectra are of comparable magnitude.
Units are cm/s for current, and N/m2 for
wind stress. Note the general
similarity in the 5- and 25-m records, with the dominant spectral peak at the
semidiurnal period.