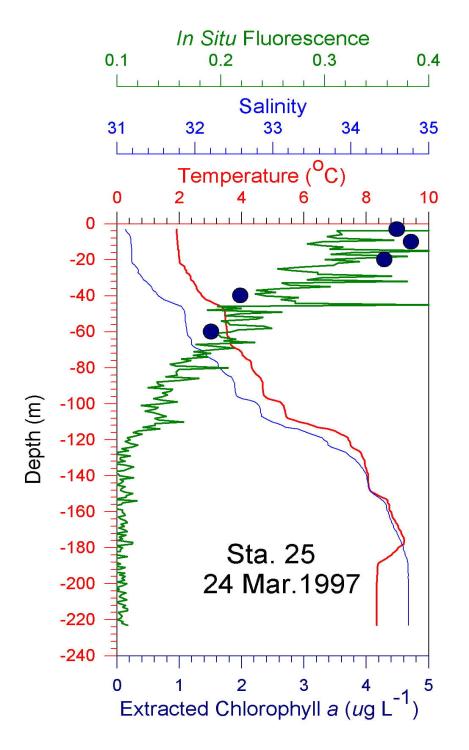
Figure H2. Profiles of temperature (red), salinity (blue), fluorescence (green), and extracted chlorophyll from broadscale station Station 25 on the eastern side of Northeast Channel.