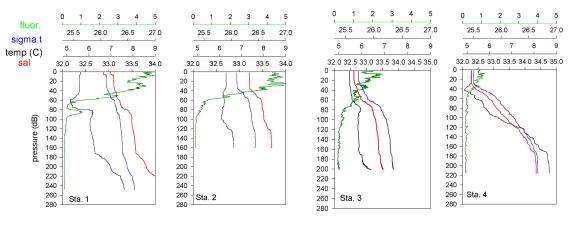
Figure H4. Profiles of temperature (black), salinity (red), density (
t
, blue), and fluorescence (green) at stations across the central Gulf of Maine.
 t, blue), and fluorescence
(green) at stations across the central Gulf of Maine.
t, blue), and fluorescence
(green) at stations across the central Gulf of Maine.