Figure 1. Cruise track of R/V Endeavor Cruise 330 (October 16-25, 1999).
Acknowledgements
We would like to thank the captain and crew of the R/V Endeavor for a productive cruise; their professionalism and good humor was greatly appreciated. We also thank the US GLOBEC Georges Bank Program for supporting this cruise, with research support provided by NOAA. Support for the bio-optical oceanographic research conducted on this cruise was provided by an award from the ONR Young Investigator Program.
TABLE OF CONTENTS
INTRODUCTION
CRUISE NARRATIVE
INDIVIDUAL REPORTS
R/V Endeavor cruise 330 was conducted as a U.S. GLOBEC process cruise to examine early autumn conditions in the Gulf of Maine relevant to ecosystem processes on Georges Bank. The major scientific objectives of the cruise included:
Summaries of the two primary projects supported by this cruise are presented in the sections following the cruise narrative.
R/V Endeavor cruise 330 was planned as a broad-scale, bio-optical and bioacoustical survey cruise traversing the major basins of the Gulf of Maine. We had weather-based contingency plans for conducting this survey cruise in either a clockwise manner (Wilkinson Basin - Jordan Basin - Georges Basin) or the reverse. A grid of regularly spaced transect lines was laid out for the survey of each basin. In addition to the survey itself, time was allocated for daytime and nighttime MOCNESS tows as well as mid-day light stations.
The R/V Endeavor departed Woods Hole on cruise EN-330 at 11:00 on 16 October 1999. Departure had been delayed one day while preparing the new handling system for the BIOMAPER II (BIo-Optical Multiple-frequency Acoustical and Physical Environmental Recorder). After departure, we tested deployment and recovery of BIOMAPER II with the new system in Vineyard Sound. After a satisfactory test, we set out to Wilkinson Basin in the Gulf of Maine via the Cape Cod Canal. A map of the cruise track for EN-330 provides an outline for the work described in this cruise (Figure 1). The meteorological conditions that occurred on this cruise ranged from ideal (i.e. virtually no wind and calm seas) to about the worst that are experienced on cruises to this region resulting from hurricanes diminished to tropical storms and full gales (Figure 2).
Figure 1. Cruise track of R/V Endeavor Cruise 330 (October 16-25, 1999).
Figure 2. Meteorological conditions during R/V Endeavor Cruise 330.
We arrived at our first deployment site in Wilkinson Basin during the late evening of 16 October. The BIOMAPER II was deployed at 23:49 (BMP 1 - Appendix 1), and all systems were checked. A failure of the acoustic system's saltwater switch forced us to recover the instrument. The BIOMAPER II was redeployed at 04:07 on 17 October (BMP 2), and all systems were operational. At 04:00, we began towyoing in Wilkinson Basin along the first east-west transect line (1WBEW) and collected our first survey data of the cruise. All systems operated properly for the first four towyos (1WBEW1-4) until 08:37, when the acoustic system's 43-kHz down-looking transducer lost sensitivity. We continued towyoing, completing two more towyos along the east-west transect line (1WBEW5,6) and two towyos along a north-south transect line (1WBNS1,2) prior to arriving at the mid-day light station at 11:47.
At 11:57, we began the first mid-day light station activities. The BIOMAPER II was towed near the surface while these activities were conducted. The activities included deployment of a tethered, free-fall vertical Satlantic profiling multi-channel radiometer (SPMR 1) and a CTD/Niskin bottle rosette (CTD 1). The SPMR and CTD profiles were collected successfully; however, the Niskin bottles failed to fire properly. The light station activities were completed by 13:25.
A daytime MOCNESS tow (MOC 1) was conducted from 14:33 until 15:16. During the MOCNESS tow, the BIOMAPER II continued collecting data near the surface. At 15:38, the BIOMAPER II was recovered to troubleshoot a problem in recording data from several of the bio-optical instruments. The problem was determined to be a leaky connector and was repaired.
The BIOMAPER II was redeployed at 17:40 on 17 October (BMP 3), and we began towyoing in Wilkinson Basin along the second east-west transect line (2WBEW). Three towyos (2WBEW1-3) were completed along this transect line before we turned toward our second north-south transect line (2WBNS) at 22:22. One towyo (2WBNS1) was completed along this transect line prior to arriving at the site of our nighttime MOCNESS tow at 23:52.
A nighttime MOCNESS tow (MOC 2) was conducted from 00:23 until 01:15 on 18 October. During the MOCNESS tow, the BIOMAPER II continued collecting data near the surface. After the MOCNESS tow at 01:43, the BIOMAPER II was recovered, and the ship steamed toward Provincetown to avoid the conditions associated with extra-tropical storm Irene.
We sat out Irene in the lee of Cape Cod for most of 18 October and part of 19 October. When wind and sea conditions subsided, we departed the protection of the Cape to resume our work in Wilkinson Basin. Prior to departure, we picked up a new 43-kHz transducer that was delivered to us by the Coast Guard near the mouth of the Cape Cod Canal. The transducer had been sent out from Hydroacoustic Technology Incorporated (HTI) in Seattle the day before via United Parcel Service.
The BIOMAPER II was redeployed at 20:09 on 19 October (BMP 4), and we began towyoing in Wilkinson Basin along the third east-west transect line (3WBEW). Four towyos (3WBEW1-4) were completed along this transect line before we turned toward our third north-south transect line (3WBNS) at 01:35 on 20 October. Two towyos (2WBNS1, 2) were completed along this transect line before we turned toward our fourth east-west transect line (4WBNS) at 03:26. Three towyos (4WBEW1-3) were completed along this transect line before we turned toward our fourth north-south transect line (4WBNS) at 08:04. One towyo (4WBNS1) was completed along this transect line prior to arriving at the site of our mid-day light station. While waiting for the light station activities to commence, we collected acoustic noise measurements and tested different echo sounder configuration files.
At 11:31, we began the second mid-day light station activities. The BIOMAPER II was towed near the surface at 5 m while these activities were conducted. The activities included deployment of the Satlantic profiling multi-channel radiometer (SPMR 2) and a CTD/Niskin bottle rosette (CTD 2). The light station activities were completed by 13:02, and the BIOMAPER II was recovered at 13:15. This completed all operations in Wilkinson Basin and we began the transit to Jordan Basin.
We arrived at our first deployment site in Jordan Basin at 22:00 on 20 October. The BIOMAPER II was redeployed to 5 m at 22:27 (BMP 5) to begin collecting data during the nighttime MOCNESS tow. We began the MOCNESS tow (MOC 3) at 22:43, and it was completed at 23:54. The first north-south transect line in Jordan Basin (1JBNS) was begun at 00:11 on 21 October. Three towyos (1JBNS1-3) were completed along this transect line before we turned toward our first east-west transect line (1JBEW) at 05:00. One towyo (1JBEW1) was completed along this transect line before we turned toward our second north-south transect line (2JBNS) at 03:26. Three towyos (2JBNS1-3) were completed along this transect line before we suspended operations at 10:19 to assist in the rescue of three Canadian fishermen. The Canadian fishermen had abandoned their boat when it overturned and sank. Canadian and US Coast Guard aircraft directed us to the life rafts and the recovery went very smoothly. After transferring the fishermen to a Canadian Coast Guard cutter, we returned to work in the eastern portion of Jordan Basin.
The BIOMAPER II was redeployed at 15:43 (BMP5) ) to begin collecting data during a daytime MOCNESS tow. We began the MOCNESS tow (MOC 4) at 15:59, and it was completed at 17:09. A CTD/Niskin bottle rosette cast (CTD 3) was conducted between 17:16 and 17:50. When we resumed our transects in Jordan Basin at 17:52, we started along the last transect line (3JBEW) and worked our way back to where we had suspended work for the recovery of the fisherman. One towyo (3JBEW1) was completed along this transect line before we turned toward the fourth north-south transect line (4JBNS) at 19:30. Three towyos (4JBNS1-3) were completed along this transect line before we turned to cross the Hague Line and began the third north-south transect line (3JBNS) at 22:33. Three towyos (3JBNS1-3) were completed along this transect line, with a MOCNESS tow conducted between the first and second towyos (with the BIOMAPER II at 5 m). We began the MOCNESS tow (MOC 5) at 00:13 on 22 October, and it was completed at 01:16. After completing the last two towyos on this transect line, we made a turn toward the second east-west transect line (2JBEW) at 04:07. One towyo (2JBEW1) was completed along this transect line before we returned to transect line (2JBNS) that was interrupted by the fishermen recovery operations. We completed the last towyo on this transect (2JBNS4) at 07:47 and recovered the BIOMAPER II for our transit to Georges Basin.
The BIOMAPER II was redeployed at 12:50 (BMP6), and we began the first mid-day light station activities at 13:04. The BIOMAPER II was towed near the surface while these activities were conducted. The activities included deployment of the Satlantic profiling multi-channel radiometer (SPMR 3) and a CTD/Niskin bottle rosette (CTD 4). The light station activities were completed by 14:18.
At 14:30, we started towyoing along a transect line (1PGBEW) toward our Georges Basin survey grid. One towyo (4PGBEW1) was completed along this transect line.
We began the first east-west transect line on our Georges Basin survey grid (1GBEW) at 19:30. Four towyos (1GBEW1-4) were completed along this transect line before rough sea conditions and unsteady ship speeds forced us to tow BIOMAPER level at 100 m for the remainder of the transect line (1GBEW4*).
At 02:43 on 23 October, we reversed course and began towing the BIOMAPER II level at 100 m along an east-west transect (2GBEW1*). The wind and sea conditions forced us off our planned line, and we steamed a sinuous transect toward the west. Sometime around 05:40, the strobe for the VPR burned out. Despite this, as sea conditions improved near the end of the transect, we conducted a towyo (2GBEW1) to determine if this type of operation could resume safely.
When we were satisfied that towyoing could resume, the ship turned and steamed an east-west transect (3GBEW) in the direction from which we had come. Eight towyos (3GBEW1-8) were completed along this transect, although VPR data were not collected. At 06:28 we reversed course and began towyoing along a new east-west transect line (4GBEW). One towyo (4GBEW1) was completed without collecting VPR data. When sea conditions improved after breakfast (08:53), we recovered the BIOMAPER II and replaced the strobe.
The BIOMAPER II was redeployed at 14:34 (BMP7) with a functional VPR, and we resumed towyoing along the same transect line (4GBEW). Twelve additional towyos (4GBEW2-13) were completed along this transect that began in the main portion of Georges Basin and continued through most of Franklin Basin. A nighttime MOCNESS tow (MOC6) was conducted at the junction of the two basins, between the fourth and fifth towyos. The MOCNESS tow began at 20:13 and was completed at 21:47; the BIOMAPER II was towed at 15 m during this time.
After the final deep towyo was completed at 07:28 on 25 October, we conducted our final daytime MOCNESS tow and mid-day light station activities. A shallow, 50-m towyo preceded the light station to collect appropriate bio-optical data. We began the mid-day light station activities at 10:36. The BIOMAPER II was towed near the surface while these activities were conducted. The activities included deployment of the Satlantic profiling multi-channel radiometer (SPMR 4) and a CTD/Niskin bottle rosette (CTD 5). The light station activities were completed by 11:46 and the BIOMAPER II was recovered by noon. With all scientific operations completed, we started steaming to Narragansett, RI.
1.0 Principal Project: Processes Regulating the Recruitment of Calanus finmarchicus from the Gulf of Maine to Georges Bank
Principal Investigators: C.H. Greene (Cornell), M.C. Benfield (LSU), P.H. Wiebe (WHOI)
1.1 Introduction
Calanus finmarchicus dominates zooplankton secondary production on Georges Bank during spring. The Georges Bank Calanus population is derived from diapausing populations in the deep basins of the Gulf of Maine, the Slope Water, and the Scotian Shelf east of the Bank. It is hypothesized that processes that regulate the survivorship and supply of Calanus from diapausing populations in the deep basins of the Gulf of Maine determine this copepod species' annual production on Georges Bank. To test this hypothesis, research is being conducted 1) to determine what processes regulate the abundance and survivorship of the diapausing Calanus populations in these deep basins, and 2) to determine how physical and biological processes interact to seed Georges Bank with recruits from these basins each year.
Acoustic and video remote-sensing methods are used to survey diapausing populations of Calanus in Georges, Jordan, and Wilkinson Basins of the Gulf of Maine. Broad-scale survey cruises conducted in early and late autumn during 1998 and 1999 will be used to estimate survivorship of the diapausing Calanus and the scale-dependent spatial coupling of Calanus and its principal invertebrate predators - the euphausiid, Meganyctiphanes norvegica, and the siphonophore, Nanomia cara.
Results from field studies will focus on quantifying the relative contribution of predation to the overall mortality of the diapausing Calanus population. The results from field studies also will be used as input to coupled physical-biological models to examine how physical transport processes in the Gulf of Maine interact with Calanus' seasonal and diel vertical migration behaviors to seed Georges Bank with new recruits during winter.
1.2 Methods
1.2.1 Broad-scale survey
A broad-scale survey of the Gulf of Maine deep basins was conducted from October 15 - 26, 1999. The survey track included multiple transect lines in Wilkinson, Jordan, and Georges Basins (Figure 1). The survey was conducted using a high-speed, deep-towed system, the BIOMAPER II, configured with multiple-frequency (43 kHz, 120 kHz, 200 kHz, 420 kHz, and 1 MHz) acoustics, a video plankton recorder (VPR), and several bio-optical sensors (down- and upwelling spectral radiometers, spectrally matched attenuation, scattering, and absorption meters) (See Appendices II, III, and IV for data logs). The acoustic frequencies were chosen to bracket the transition from the Rayleigh to geometric scattering regions for the target species under investigation. A down- and up-looking transducer operated at each frequency to provide more complete coverage of the water column when the instrument was towyoed. Echo integration was conducted at 12-second intervals to provide volume-backscattering data at all five frequencies. Split-beam data were collected at the four lower frequencies. All raw acoustic data were recorded on digital audio tape, while the processing for echo integration was carried out in real time.
The software to acquire the data, which was provided by HTI, enabled the simultaneous acquisition of data on five frequencies each with two transducers (one up-looking and one down-looking). The range of the 0.5 meter depth strata allocated for each transducer was dependent on frequency with the lowest frequencies given the longest range and highest frequency the shortest range i.e. 43 kHz = 200 m, 120 kHz = 200 m, 200 kHz = 149 m, 420 kHz = 100 m, 1000 kHz = 35 m). A ping cycle for all frequencies and transducers took about 2.5 seconds with a firing sequence of down-looking 43, 120, 200, 420, 1000 kHz and then up-looking 43, 120, 200, 420, 1000 kHz. Target strength measurements were also collected on the lower 4 frequencies out to 20 meters from the surface of the split beam transducers. In addition, the raw data for each ping were recorded on DAT tape for post-processing of either target strengths or echo-integrations on a different time averaging basis. Each tape recorded two gigabytes of data and a total of 68 tapes were recorded during the cruise.
Post-processing software was used to combine the up-looking and down-looking data for a given frequency and then display the data as color enhanced echogram. On this cruise, a MATLAB version of the program to translate HTI-DES formatted acoustic data to a MATLAB compatible format (the Wiebe format) was used by Joe Warren to post-process the acoustic data. The post-processing software was used to combine the up-looking and down-looking data for a given frequency and then display the data as color enhanced echograms.
The VPR mounted on BIOMAPER sampled a volume of 41.7 liters min-1. All video images were recorded on S-VHS tape for post-cruise processing, while real-time processing enabled us to capture in-focus images to hard disk. GPS data were synchronized with the VPR signal and stamped on the video time code.
1.2.2 The BIOMAPER II handling system.
On this cruise, BIOMAPER II was deployed, towed, and recovered using a unique, self-contained handling system newly-built by Dynacon, Inc. specifically for BIOMAPER II, with funding from DURIP (Figure 3). It is powered and controlled electrically and driven hydraulically. The system was delivered in early October and installed on the R/V ENDEAVOR in the three days prior to the ships sailing on 16 October. The first-time installation required some extra time to arrange the placement of the components on the main deck of the vessel, to fabricate metal tie-down plates and get them installed, and to test and evaluate the launch and recovery mechanism prior to leaving port.
The system consists of a winch and electro-optical cable, slack tensioner, J-frame/docking mechanism, power pack/hydraulic system, and local and remote controls. The J-frame, slack tensioner, and power pack are all mounted on a single structural steel tubing platform with a base of 2.4 m (8') by 5.3 m (17.5').
The stand-alone hydraulically driven drum winch has a core diameter of 1.9 m (32"), a core width of 2.3 m (48"), a flange diameter of 2.3 m (48"). It has a bolt-on drum liner (Liebus grooving) grooved for 17.3 mm (0.68") electro-optical cable. The winch is designed to hold 1500 m of this cable. The drum shaft is hollow to accommodate slip rings and a water proof junction-box is mounted externally within the confines of the drum flange metal structural supports. The winch gearbox has a hydraulically released fail-safe brake and there is, additionally, a hydraulically actuated caliper disk brake installed on the drum assembly.
The level wind assembly is a separate unit that bolts onto the front of the winch base support. Wire leads off the winch drum and into a levelwind sheave/carriage assembly which is driven by an ACME screw. The sheave is equipped with sensors to measure wire tension, line speed, and line count. Wire coming out of the level wind sheave goes to a horizontal turning sheave where it is fairled into fixed input sheave of the slack tensioner.
The structural steel tubing framework for the slack tensioner has a rectangular base 1.7 m (67") by 1.4 m (56") and a height of 3.2 m (125"). Within the frame are seven 1.2 m (48") diameter polyamide sheaves with four sheaves mounted in a fixed position at the bottom and three sheaves positioned above them on a vertical-traveling carriage assembly. Two 1.2 m (48") stroke hydraulic cylinders, secured to the rigid base and the carriage, drive the top three sheaves in response to the motion of the ship. The hydraulic cylinders are connected to two piston style accumulators. Cable tension is controlled by hydraulic oil movement between the cylinders and the nitrogen charged accumulators. The slack tensioner can take up 7.3 m (20') of cable.
Figure 3. The Dynacon BIOMAPERII handling system. Upper left, a 3D drawing
of the winch, hydraulic power pack, slack tensioner, and J-frame.
Lower left, a drawing of BIOMAPERII. Right, three schematic drawings of the
components of the handling system.
The J-frame is also constructed of structural steel tubing and has dimensions of length 5.1 m (200"), width 2.2 m (87"), and height (when in the lowered overboard position) 2.9 m (113 "). The J-frame extension makes the overall width of the over board end of the frame 4.2 m (164") The framework is attached to a base plate with a pivot-pin assembly that allows the frame to rotate approximately 60 degrees from horizontal to its most vertical position. Two double-acting cylinders are attached to the base plate and inner structural frame members and are extended to move the frame to the outboard position. On the outer portion of the frame is a turning sheave which leads to an over-boarding sheave. The over-boarding sheave is part of an assembly that mounts in a steel cylinder welded into the outer margin of the framework and provides the J-extension. Below the over-boarding sheave is a docking mechanism for BIOMAPER II which enables the towed body to be deployed or recovered with very restrained motion even in rough seas. The docking mechanism captures and latches the cable termination and the upper part of the BIOMAPER II towing bale. There are two remote controlled hydraulic pistons on the docking assembly. One is used to operate the latch and the other is used to adjust the fore/aft alignment of the docking assembly and the towing wire.
The power pack/hydraulic system is a 23 kw (30 HP) unit mounted in a separate framework [length 1.7 m (66"), width 1 m (38"), height 2 m (77")] that bolts onto the main platform. It houses the hydraulic reservoir, electric motor and pump assembly, heat exchanger, and circuitry for high voltage electric supplies and low voltage control modules. The system requires 460 VAC 3 phase 60 Hz electrical power.
The local control station (a M/D TOTCO LM 2000) mounts on a moveable pedestal that enables flexible placement in the vicinity (8 m/ 25') of the handling system. Controls to operate the winch, J-frame, and docking mechanism hydraulic rams are located on a stainless steel enclosure. A panel displays line tension, line out, and line speed. The unit provides for the setting and activation of alarms to indicate when parameter values exceed minimum or maximum limits. The data can be output for computer logging via an RS232 bus at up to 4 Hz. A remote control unit on a 15 m tether (50') is also available for operation of the winch and for displaying and logging of the data. A switch is present on the local unit to enable/disable the remote control unit. Normally, the local unit is used for launch and recovery of BIOMAPER II and the remote unit is used to "fly" the vehicle from the BIOMAPER II control van.
The sub-units have weights of: J-Frame assembly - 9,136 kg (20,100 lbs) , Slack Tensioner - 5,118 kg (11,260 lbs), Hydraulic Power Unit - 1,546 kg (3,400 lbs), Winch - 2,241 kg (4,930 lbs - without cable), 1000 m of cable - 1114 kg (2,450 lbs), Level wind - 1,155 kg (2,540 lbs), and Turning Sheave - 218 kg (480 lbs). Total weight is about 20,527 kg (45,160 lbs).
A description of one of the recoveries provides an indication of how different the recoveries are now with the new handling system as compared to what they were like on previous cruises (i.e., see the Cruise Report for OC334 - December 1998).
"09:17 (24 October): We just did a very nice rough water recovery of BIOMAPER II. Seas are pretty awful with the long period of 25 to 35 knot winds i.e 7 to 10' waves with some larger. Before trying to recover the fish, we let air out of the nitrogen cylinders to give the slack tensioner more dynamic range at the surface. The tensioner had been topping out with a pressure setting of 320 lbs or so. I (P. Wiebe) am not sure how much pressure we ended up with, but whatever it was, it prevented ship movements from topping the tensioner out. With Andy Girard at the controls of the handling system, and Charlie Baker, Dave Nelson, Fred Curtis, and myself on the deck, the procedure was as follows. With the two quick-release hooks on poles in place and the lines going to the air-tuggers, we asked for the ship to slow down. In this case, the ship slowed down too much and the fish started to wallow around and was not parallel with the hull which it must be for the towing bail to come into the docking mechanism properly. So we had the ship speed up to a knot or better and waited a few minutes for the fish to straighten out. Once ready, we turned off the slack tensioner. I turned off the valve on the aft side (a squeeze fit to get to the lever controlling the valve) and Andy did the one next to the control console. Then, Andy hauled in on the cable and was able with one motion to get the cable termination and boot to go up into the docking mechanism. The towing bail was quickly captured. The fish was pitching fairly extremely, but the forward stop at the back of the VPR framework stopped the motion reasonably well. Dave Nelson got a snap-hook into the front side rail and Karen put tension on the line as Andy got the gantry coming up lifting BIOMAPER II above the waves. Once it was coming inboard, the second hook was snapped into the lower rung of the tail and tension put onto it's line. From that point the fish was well secured and it came up off the water and over the rail with almost no free motion. Once the gantry was inboard all the way, Andy hauled up on the wire to take the pressure off the latching mechanism so that it could be released (backed off) and then he slowly lowered the fish to the deck while the tugger lines were kept tight. It landed smoothly on the deck without any unwanted motion. Once on deck, the four hold-down straps were put in place and Andy put a little slack in the cable. It was a great recovery under difficult sea conditions."
1.2.3 MOCNESS stations and zooplankton studies
1.2.3.1 Zooplankton characterization from MOCNESS samples.
During the broad-scale survey cruise of the Gulf of Maine deep basins, MOCNESS tows were conducted at two stations in Wilkinson and Georges/Franklin Basins and three in Jordan basin (Table 1).
| Tow Number | Start Date (yearday) | Lat(N) Lon(W) | End Date | Lat(N)Lon(W) |
|---|---|---|---|---|
| M-01-001 | 17 Oct 1999 (290.600926) | 42.2544 -069.2484 | 290.634236 | 42.2570 -069.2823 |
| M-01-002 | 18 Oct 1999 (291.183229) | 42.4172 -069.8229 | 291.214410 | 42.4170 -069.7968 |
| M-01-003 | 20 Oct 1999 (294.115764) | 43.3389 -067.9801 | 294.157963 | 43.3509 -067.9423 |
| M-01-004 | 20 Oct 1999 (294.833275) | 43.5090 -067.1749 | 294.878993 | 43.5343 -067.2164 |
| M-01-005 | 21 Oct 1999 (295.176609) | 43.6426 -067.5096 | 295.216042 | 43.6090 -067.5227 |
| M-01-006 | 24 Oct 1999 (298.012836) | 42.3215 -067.6027 | 298.070440 | 42.3267 -067.6797 |
| M-01-007 | 25 Oct 1999 (298.510035) | 41.7686 -068.5549 | 298.543877 | 41.7706 -068.5923 |
The MOCNESS samples were collected for ground-truthing and inter-comparisons between the acoustic and VPR data. Splits from the MOCNESS samples were preserved in formalin for quantitative studies and preserved in alcohol or frozen in liquid nitrogen for molecular studies of Calanus and Meganyctiphanes population genetics by Ann Bucklin (University of New Hampshire) and diapause physiology by Patrick Hassett (University of Ohio) and Charles Miller (Oregon State University), and nitrogen stable isotope analysis by Karen Fisher (Cornell University).
All MOCNESS tows were conducted with ship speeds of 1.5 - 2.5 knots. The nets began collecting samples quantitatively from 10 m above the bottom to the surface. The zero net was fished from the surface to within 10 m of the bottom. Sampling strata for nets 1 through 8 was dependent on water depth, with intervals of 25 m sampled near the bottom and the surface, and remaining intervals ranging from 25 to 75 m. The down cast (net 0) was fished at a wire speed of 15 m/minute, and the up cast (nets 1-8) was hauled in at a speed of between 5 and 10 m/minute. From approximately 100 to 300 cubic meters of water was filtered for each of nets 1 through 8.
Samples were processed at sea in the following manner. The sample taken from net zero on all hauls was preserved in 95% ethanol for Ann Bucklin. Plankton samples from nets 1 through 8 were split with a box splitter. One-half split was preserved in 5-10% buffered formalin for silhouette analysis to ground-truth the acoustic and VPR data. The other half split was made up to 600 ml, and 100 ml were removed and preserved in 9% formalin for Charles Miller's life history studies. The remainder of the 600 ml was either sieved and spooned into ethanol for Ann Bucklin's genetic studies or placed into plastic bags and frozen for Patrick Hassett's diapause physiology studies. In addition, approximately 30 individual Meganyctiphanes specimens were picked out and frozen for Ann Bucklin's genetic studies of this species. Finally, one teaspoon was taken from nets 0, 5, 6, 7 and 8 from the nighttime Georges Basin tow for Karen Fisher. Preliminary observations were made of the presence of zooplankton (Appendix V)
1.2.3.2 Calanus life history studies
Jennifer Crain and Charlie Miller have been conducting studies of Calanus finmarchicus lipid volumes and gonad development on GLOBEC Broad-scale cruises, from January through June. Participation in cruise EN330 has enabled them to expand those studies to include assessments of diapausing Calanus stocks in the major Gulf of Maine Basins.
Video images were taken of fifth copepodites from the surface and deep nets of each net tow. These images will be used for calculation of oil sac volume, using image analysis and a volume integration program, with corrections made for areas with non-circular cross-sections. Oil sac volumes will be compared with data gathered from their January through June Georges Bank studies to assess differences between "diapausing" and non-diapausing Calanus fifth copepodites.
Sub-samples (100/1200 ml) were taken from nets 1-8 of hauls 1 through 4, 6 and 7. These sub-samples were preserved in 9% formalin for laboratory-based gonad analyses. Additionally, 100 fifth copepodites from a deep net of the Wilkinson Basin nighttime haul were frozen for diapause studies, to be carried out by Dr. Nancy Marcus.
1.3 Results
1.3.1 Broad-scale survey
1.3.1.1 Multi-frequency acoustics and Environmental Sensing System (ESS)
The multi-frequency acoustics, bio-optical (including VPR), and physical oceanographic data were collected during six major deployments of BIOMAPER II throughout the Gulf of Maine (Table 2). As described in the narrative, there was a test deployment of the handling system in Vineyard Sound at about noon on Saturday, 16 October. The first deployment where data were collected was in the southern portion of Wilkinson Basin at 23:10 on the 16th of October. This data collection was terminated when Hurricane Irene (a tropical storm by the time it reached us) forced a run for a lee in Cape Cod Bay about 13:34 on Monday, the 18th. After the high winds and seas had subsided, the work in Wilkinson Basin re-started where it had left off on 19 October at 20:09. It was finished the next day at 13:08. A half-day steam took us to Jordan Basin where work began in the southwestern portion of the basin on 20 October at 22:30. About mid-way through the work on 21 October, the U.S. Coast Guard requested that we break off and go to the rescue of three fishermen whose boat had sunk. Rather than take the time to steam back to where the work was stopped, we elected to steam a short distance to the end of the trackline and work our way back to the stopping point. This second portion of the work in Jordan Basin started on 21 October at 15:46 and ended on 22 October at 07:39.
| Area | km | nm |
|---|---|---|
| Wilkinson Basin (Before Irene) | 155.4 | 83.9 |
| Wilkinson Basin (After Irene) | 150.1 | 81.1 |
| Jordan Basin (Before Rescue) | 111.0 | 59.9 |
| Jordan Basin (After Rescue) | 137.6 | 74.3 |
| Georges/Franklin Basin | 531.5 | 287.0 |
| Total | 1085.6 | 586.2 |
With wind and seas starting to build, we steamed down to Georges Basin and began BIOMAPER II work about 13:00 on 22 October. By about midnight, the wind and seas had reached full gale and it was decided to stop towyoing BIOMAPER II and instead tow it a constant depth of about 100 m until sea conditions became good enough to resume towyoing. We were able to start towyoing again about 17:30 on 23 October. During the mid-day of 24 October, BIOMAPER II was brought on board for repair of the VPR strobe light assembly, which had failed during the gale. There were three recoveries and launches of the towed body during the process of repair and testing of the strobe light. These were done safely in spite of winds of 25 to 33 kts and seas of 8 to 12' (2.4 to 3.6 m). Work continued in Georges Basin and then into Franklin Basin and ended about noon on 25 October. The total trackline distance along which data were collected was 1086 km (586 nm - Table 2). During the deployments, data were collected in a down-looking mode with BIOMAPER II towed just below the surface, in a down and up-looking mode while towed horizontally at some sub-surface depth, or towyoed from the surface to within 10 to 30 m of the ocean bottom. As described above, during some periods of BIOMAPER II data acquisition, MOCNESS tows were taken to collect planktonic animals.
The instrument systems on BIOMAPER II worked well on this cruise with two minor exceptions. The down looking 43 kHz transducer failed at mid-depth during a towyo during the first period of work in Wilkinson Basin. Fortunately, HTI, Inc. was able to send a replacement transducer overnight by UPS while we were waiting for Irene to pass. The new transducer was in place by the time the second period of work was started in Wilkinson Basin. As mentioned above, during the gale in Georges Basin, the VPR strobe light failed. It was replaced with a backup unit as soon as the weather permitted BIOMAPER II to be brought back on board the ENDEAVOR. The Bio-Optical subsystem had some minor connector problems that were corrected by cleaning and re-greasing them.
Evaluation of the performance of the handling system.
The extended period of high winds and rough seas between 22 to 24 October 1999 provided an opportunity to make observations of the effectiveness of the motion compensation system under sea states that would normally render over-the-side operations impossible (Figures 4 and 5). The last period of work in Jordan Basin constitutes a baseline for comparison because winds were light and seas nearly calm. During that period, the wire tensions during towyos of BIOMAPER II between 0 and 200 m (1 to ~ 500 meters of wire out) were between 445 and 1168 kg (980 - 2570 lbs - Table 3). The pitch of BIOMAPER II varied between 0 and 5 degrees while the roll had an offset of about 10 degrees (Figure 5). The latter was caused by a mis-alignment of the tail which was corrected later in the cruise. Both the roll and pitch varied with the shooting or hauling of the towing cable. There was a tendency for the nose to be pointed down while shooting the cable and for it to be pointed up while hauling. The roll bias tended to be minimized close to the surface and to increase with wire out (Figure 5). The power spectra for the wire tensions (collected at 4 Hz) revealed two peaks. Most of the variance was centered at the frequency of the towyo i.e. the maximum variation in wire tension was associated with the paying out and hauling in of the wire (Figure 6A). A secondary maximum in variance, 3 to 4 orders of magnitude lower, was between 5 and 10 seconds and was associated with the roll and pitch motion of the ship.
Table 3. Summary of wind speed and wire tension for BIOMAPER II handling system performance
(See Figures for data used to compute statistics).
| Time Period | Wind Speed (kts) | Wire Tension | Comment |
|---|---|---|---|
| Start end | min mean max | min mean max | |
| 295.0 295.3 | 0 3.6 7.5 | 980 1975 2570 | Light winds in Jordan Basin- towyo |
| 295.6 296.0 | 16.1 29.0 41.8 | 30 2030 3600 | Increasing winds in Georges Basin -towyo |
| 296.0 296.4 | 9.6 28.0 43.7 | 10 1864 2780 | Sustained high winds - horizontal tow |
| 296.5 296.7 | 21.3 29.2 39.3 | 960 1875 2890 | Sustained high winds - horizontal tow |
| 296.7 297.0 | 4.9 24.0 37.1 | 20 1971 4400 | Decreasing winds - towyo (slow ship speed) |
| 297.0 297.4 | 3.2 20.1 35.3 | 20 2004 3820 | Sustained Moderate winds - towyo |
| 297.6 298.0 | 12.9 21.3 28.9 | 950 1818 4210 | Sustained Moderate winds - towyo (only two tension points above 3380 lbs |

Figure 4. Digital images of BIOMAPERII and the Dynacon handling system taken
on R/V ENDEAVOR cruise 330. A) BIOMAPER II at the end of a recovery. B) BIOMAPER II
coming out of the water after a successful series of towyos. C) The J-frame with
BIOMAPERII being towed at 100 m depth (160 mwo) in 15 to 20' seas. D) The J-frame
getting dunked during a heavy roll in the gale. E) The drum winch with 1000m
of electro-optical cable and level wind positioned on the main deck of the ship.
The power pack and slack tensioner are behind the winch.
Figure 5. BIOMAPERII tow engineering data collected during a gale in Georges
Basin, 22-24 October 1999. Wind speed data were collected at 1 minute intervals;
wire tension and line out data were collected at 0.25 second intervals; BIOMAPERII
depth, roll and pitch data were collected at 4 second intervals.

Figure 6. Wire tension data and power spectra from sections of the data
collected during the period 22-24 October 1999. A) Towyo during light winds
in Jordan Basin. B) Towyo with increasing wind at the start of work in Georges
BAsin. C) Horizontal tow during high sustained winds in Georges Basin. D) Continuation
of horizontal tow in high sustained winds. E) Resumption of towyos with decreasing winds.
F) Towyo during sustained moderate winds. G) Towyo during sustained moderate
winds after BIOMAPER II VPR repair. The dotted vertical lines in the power spectra
plots mark the approximate position of the towyo frequency and the positions
of the 5-second and 10-second frequencies that typically bracket the ship's roll
and pitch motion.
In Georges Basin, a towyo survey was begun while winds and seas were still moderate. As the wind and seas picked up, the slack tensioner was unable to fail to compensate for the ships motion when BIOMAPER II neared the surface. As the tension was reduced by the smaller amount of cable over board and the motion of the ship had increased influence on the wire tension variation, the slack tensioner reached the "topping out point" and the cable went slack, but only momentarily. This was because the gas pressure in the compensation tanks was too high. Adjusting the gas pressure relieved the problem, but not entirely (Figure 6B). Still, the mean wire tension remained low and the maximum wire tensions only reached 1636 kg (3600 lbs). However, at midnight on 22 October with wind and seas still building, the towyos were discontinued in favor of a horizontal towing mode with BIOMAPER II at about 100 m. For the next seventeen hours, BIOMAPER II was towed with a constant amount of wire out (~160 m), except for a short period when it was hauled closer to the surface while the ship reversed course. Variations in BIOMAPER II's depth were determined by variations in ship speed. In spite of considerable vessel motion in seas of 4.5 to 6 m (15 to 20') during this period, wire tensions were maintained by the slack tensioner in the same range as experienced during light winds in Jordan Basin (Table 3), with the exception of the few low values experienced when the turn was made. The power spectra for the two periods of horizontal towing were dominated by ship's motion in the five to ten second range and no significant contribution at lower frequencies (Figure 6C and 6D).
The resumption of towyoing as the winds and sea decreased, resulted in some increase in the wire tension variation because of slack tensioner "topping out" when BIOMAPER II was near the surface. Never-the-less, the mean wire tension level stayed nearly constant (Figure 6E, F, and G) and there was no evidence of shock loading of the wire or spiking. On the morning of 24 October, BIOMAPER II was recovered to service the vehicle and to repair the VPR strobe light. The wire tensions experienced during the recovery and subsequent launch were significantly higher than any observed during the towing. This occurs because in the process of docking or undocking BIOMAPER II, the operator must haul the cable and cable termination up against a stop before the docking latch can be opened. This usually results in the higher wire tension values.
The wire tension records and the power spectra demonstrate the substantial protection the slack tensioner system provides against excessive shock loading of the cable and the vehicle in sea states that are not normally workable. Improvements to the way in which the gas compensation system is configured will make it possible to reduce further or eliminate the problem with "topping out" when BIOMAPER II is at the surface in heavy seas.
Hydrographic results.
The physical structure of the three basins differed substantially. In Wilkinson Basin, the surface mixed layer (0 to 35 to 40 m) had the warmest temperatures of the three basins (11.6 - 14.6 degrees C) and lowest salinities (32.2 - 32.4 PSU - Figure 7). There was a pronounced subsurface temperature minimum zone in most of the towyo profiles between 50 and 120 m with minimum temperatures ranging between 4.7 and 6 C. Near the bottom temperatures increased to about 8 C. Salinities increased monotonically from the bottom of the mixed layer until reaching maximum values greater between 34.2 and 34.4 PSU at the bottom of the basin (~ 250 m).
The surface temperature structure of Jordan Basin was the coldest of the three with values ranging between 11.3 and 12.1 C (Figure 8). The surface mixed layer depths were more variable (0 to ~ 40 m to 75 m). Surface salinities were the highest 32.9 - 33.75. Salinities increased monotonically from the bottom of the mixed layer until reaching maximum values greater between 34.6 and 34.85 PSU at the bottom of the basin (~ 200 to 230 m). This basin also had a subsurface temperature minimum zone ranging in depth between ~68 and 130 m, but the minimum temperatures were not quite as low as observed in Wilkinson Basin ( 6.8 to 8 C). Temperatures then increased to the bottom where values ranged between 8.8 to 9.7 C.
In Georges Basin, the surface mixed layer (0 to ~ 50 m) was relatively warm (11.6 - 13.5 degrees C) and fresh (32.3 - 33 PSU - Figure 9). There was a pronounced subsurface temperature minimum zone in most of the towyo profiles between 60 and 140 m with minimum temperatures ranging between 5.5 and 7.5 C. Near the bottom temperatures increased to between 8 and 9 C. At the northeastern portion of Georges Basin at the start of the work there , the minimum zone was not present. Salinities increased from the surface mixed layer values until reaching maximum values greater than 35 PSU at depths ranging between 100 and 150 meters. These high salinities then extended down to the bottom at 300 m depth. Thus, the Gulf of Maine basins seemed to be in a state of transition from one in which the deeper portions of the basins were filled with relatively cold and fresh water (of "cold Labrador Slope Water") as exemplified by the properties found in Wilkinson Basin, to the more recent common state in which the basins were filled with relatively warm and salty water (of "warm Atlantic Slope Water" origin). The latter best exemplified by the properties found in Georges Basin.
Figure 7. 3D (latitude, longitude, and depth) and time/depth plots of BIOMAPER II Temperature (C), salinity (PSU),
and fluorescence (Volts) from Wilkinson Basin collected on R/V ENDEAVOR Cruise 330.
The star marks the start of the trackline; the white lines mark the towyo path of BIOMAPER II.

Figure 8. 3D (latitude, longitude, and depth) and time/depth plots of BIOMAPER II
Temperature (C), salinity (PSU), and fluorescence (Volts) from Jordan Basin
collected on R/V ENDEAVOR Cruise 330. The star marks the start of the trackline; the white
lines mark the towyo path of BIOMAPERII.
Figure 9. 3D (latitude, longitude, and depth) and time/depth plots of BIOMAPER II
Temperature (C), salinity (PSU), and fluorescence (Volts) from Georges Basin
collected on R/V ENDEAVOR Cruise 330. The star marks the start of the trackline; the white
lines mark the towyo path of BIOMAPERII.
The fluoresecence patterns seemed to be related to the strength of the stratification of the upper water columns of the three basin (Figures 7-9). Highest values were observed in Wilkinson Basin where the stratification was strongest. Intermediated values were observed in Georges Basin which was less well stratified. Lowest values were seen in Jordan Basin which also had the weakest stratification and deepest mixed layers.
Some preliminary acoustic findings.
Backscattering intensities throughout the Gulf of Maine were relatively high (Figures 10-14). They were about the same in Jordan Basin and Georges Basin and were somewhat lower in Wilkinson Basin.
There was evidence for a sizeable diel migration of animals in Jordan and Georges Basins on the lower three frequencies (43, 120, and 200 kHz) and a weaker diel migration in Wilkinson Basin. The diel migration layers seemed to aggregate in the vicinity of the pycnocline just below the surface mixed layer and to some extent avoid the surface layer. This may have been due to turbulence at the surface caused by the strong winds we experienced during a good portion of the cruise. In spite of the migrations, there were persistent deep layers of sound scatterers in the deeper reaches of Wilkinson, Jordan, and Georges Basin both day and night.
A new occurrence was the presence of a large internal wave near the bottom on YD296.3 (about 0700) while doing the horizontal tow during the gale. This wave was most evident on the two lower frequencies (43 and 120 kHz), but could be seen in the 200-kHz record. It started in the eastern portion of the acoustic record at mid-depths around 150 m, and then, as the ship progressed west, the wave (Figure 13) moved very close towards the bottom at 300 m. It occurred at the start of the high volume backscattering deep layer in Georges Basin.
There were some interesting smaller scale features that appeared on the echograms during YD297 (Figure 14). These were upward vertical projections of scattering zones from the top of the pycnocline layer at the base of the mixed layer. These may have been caused by the interaction between vertical circulation cells created by the surface wind mixing and animals swimming downward to avoid the higher turbulence zones at the sea surface.
One problem that has not yet been resolved concerns the enhanced backscattering that is observed on towyos as BIOMAPER II is passing through the 100 to 150 m depth zone and the decreased backscattering observed at deeper depths. As on past BIOMAPER II cruises, this pattern in a zone 10 to 15 m beyond the near field zone of the upward and down-looking 43, 120, and 200 kHz transducers was clearly evident on most of the towyos on this cruise. Since we have rearranged the positions of the transducers to eliminate reflection between transducer pairs and put additional backing on the transducers to prevent back sound transmission, it would appear that the problem may be related to pressure deforming the face of the transducers and affecting near-field.

Figure 10. BIOMAPER II acoustic data for the five up and down-looking transducers. Data collected
on 19 October 1999 (YD292).
Figure 11. BIOMAPER II acoustic data for the five up and down-looking transducers. Data collected
on 20 October 1999 (YD293).
Figure 12. BIOMAPER II acoustic data for the five up and down-looking transducers. Data collected
on 22 October 1999 (YD295).
Figure 13. BIOMAPER II acoustic data for the five up and down-looking transducers. Data collected
on 23 October 1999 (YD296).
Figure 14. BIOMAPER II acoustic data for the five up and down-looking transducers. Data collected
on 24 October 1999 (YD297).
1.3.1.2 Video plankton recorder (VPR)
BIOMAPER II was equipped with a single camera Video Plankton Recorder (VPR) mounted on the front of the upper surface of the vehicle with the camera (starboard) and strobe (port) facing inward (Figure 15). During this cruise, the VPR was mounted on an extension that raised the camera and strobe 43 cm above the dorsal surface of BIOMAPER and extended it 11.5 cm forward of the leading edge of the vehicle's nose (Figure 16). This was incorporated as an attempt to reduce avoidance behavior by euphausiids and other large taxa.
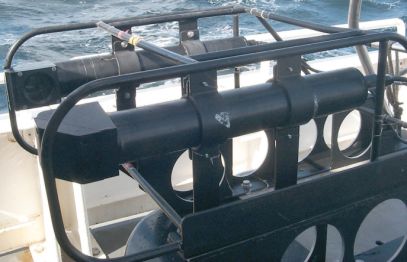
Figure 15. The single camer VPR on BIOMAPER II. Strobe is in the canister in the background
and camera is in the foreground.

Figure 16. The extension bracket used to elevate and move the VPR forward.
The separation between the camera and strobe transparent ports was approximately 28.5 cm. The camera imaged a
fixed volume based on depth of field of 6.1 ml with dimensions of 17.5 mm wide x 12.5 mm tall x 28 mm deep. The
center of the volume was located approximately 12 cm from the camera pressure port. The actual volume that was
detected by the frame grabber has a more limited height because the lower thirty lines of the video image where the
time-code is displayed are masked from the RTVPR. Further, the volume imaged varied as a function of the in-focus
threshold setting on the real time VPR extraction program (RTVPR). The RTVPR in-focus threshold determines
how far the depth of field extends. Thus, the effective volume perceived by the RTVPR depends on the in-focus
threshold setting and to a lesser degree, the binarization threshold setting (Figure 17).
Figure 17. Relationship between the in-focus threshold and the VPR depth of field for two
binarization thresholds: 60 and 100.
Binarization Threshold: 100, Depth of Field (mm) = -1.029(In-Focus Threshold) + 102.087 (R2=0.97)
Binarization Threshold: 60, Depth of Field (mm) = -0.598(In-Focus Threshold) + 81.607 (R2=0.99)
Real-Time Image Processing
The video signal was encoded with a VITC timecode containing the UTC time. Therefore it is important to note that all video timecodes are 4 h ahead of the corresponding local time recorded on the acoustic and ESS data. Our standard operating procedure was to archive the timecoded video data from the VPR on 2-h SVHS video tapes. These tapes were numbered consecutively with the 2-h DAT tapes used to store the acoustic data.
Real-time Regions of Interest (ROI ) extraction was run concurrently with archiving to tape. The extraction parameters were: binarization threshold = 60; in-focus threshold = 40; growth scale = 125; and minimum blob size = 150. These parameters resulted in an image volume of 11.6 ml with dimensions: depth of field = 57 mm, width = 17.5 mm and height = 11.7 mm. ROIs were archived to CD in directories that corresponded to their tape numbers (e.g. tape001). The filename of each ROI is roi.nnnnnnnn.tif where the number corresponds to the elapsed time since midnight (UCT) in seconds. For example, a ROI with the filename roi.34723801.tif represents an image that was recorded at: 09:38:43.8 UCT.
Operations
The VPR was operational for most of the cruise. Tapes 002-020 were recorded in Wilkinson Basin. Tapes 021-035 were recorded in Jordan Basin. Tapes 036-068 were recorded in Georges Basin including a transect through Franklin Basin. On 23 October, the VPR strobe failed during tape 044. The failure was due to a blown capacitor. We replaced the strobe board with another and were operational again beginning with tape 059 on 24 October. Note that tape 059 was recorded concurrently with DAT 059.
The system functioned extremely well. ROIs were collected for a wide variety of taxa including euphausiids, which were either more abundant this year or were less able to avoid the modified VPR mount. Most euphausiids were imaged in an escape posture (Figure 18) suggesting that avoidance continues to be a problem. Calanus were abundant in all three basins and concentrated at depths greater than 80-100 m.
Figure 18. VPR images of euphausiids exhibiting escape response.
1.3.2. MOCNESS stations and zooplankton studies
1.3.2.1 Zooplankton characterization from MOCNESS samples
At all three sites, Calanus finmarchicus stocks, which were made up of nearly 100 percent fifth copepodites, were abundant from 150 to 200 m during the day and night tows. Differences between day and night tows were seen in the relative abundance of Calanus at the surface, with noticeably more C. finmarchicus present in surface waters
during night tows. Centropages spp. and other copepods, including Oithona and younger stages of Calanus, were predominantly found in the upper 75 m of the water column, with greater numbers present in our samples taken from nighttime hauls. Euchaeta were most abundant in Wilkinson Basin, but found in all basins at depths greater than 150m. Many Euchaeta were carrying egg sacs. Other copepods species, such as Metridia, were present, but it was difficult to estimate their abundance.
The most common euphausiid sampled was Meganyctiphanes norvegica, although Thysanoessa gregaria and T. longicaudata were also present. They exhibited diel vertical migration, with more individuals sampled in surface nets during nighttime hauls. The amphipod Themisto gaudichaudii was present throughout the water column and exhibited a large size range. A few small patches of the pteropod Limacina were found in all three basins, with the greatest numbers found in Jordan Basin. Clione, a predatory pteropod, was also found in scattered patches in all basins, with the largest concentrations found in Georges Basin. Chaetognaths, medusae (usually Aglantha digitale), and siphonophores were present in nearly all samples taken. The net, which often came up covered with parts of siphonophores, may not have adequately sampled these animals. Salps were not found in Wilkinson Basin, but were present and sometimes very abundant near the surface in both Jordan and Georges Basins.
1.3.2.2 Calanus life history studies
In general, the Calanus assemblages seen on this cruise were composed of nearly 100% fifth copepodites, with only a few adult females and males or younger stages (mostly fourth copepodites) seen. The copepodites caught in the 1-m MOCNESS hauls were generally quite active, in contrast to what we had expected of diapausing animals. They also showed significant vertical migration, with only a small fraction of the number of C5's present at depth during the nighttime net tows. The copepodites that remained at depth were not noticeably less active than the ones that had migrated to the surface waters. In general, oil sacs seen on this cruise ranged from moderately full to full (Figure 19). No animals with very small oil sacs were seen.
Figure 19. Video image of Calanus finmarchicus fifth
copepodites for oil sac volume integration.
Observations of gonad development in the Calanus fifth copepodites revealed that they are in all stages of gonad maturation. Many animals with obviously developing gonads were seen in all nets examined, including a number with distinguishable ovaries, although no developing testes were identified. Gonad rudiments were present in animals from all nets. During the broad-scale cruises, two separate types of gonad rudiments have been observed (Figure 20 and 21). One type was suspended above the oil sac, while the other (which was significantly longer and thinner) lies directly on top of it. On this cruise, none of the latter type of rudiment was seen. Additionally, a type not observed in our earlier work was observed in all nets. This new type had the general appearance of the longer, thinner type, but was positioned above the oil sac like the former. An onboard rearing experiment was set up to try to link the first (shorter) rudiment type to the animal's sex as an addition to previous onboard experiments conducted on broad-scale cruises, but all of the individuals died for reasons unknown.
Figure 20. Calanus finmarchicus fifth
copepodite with short wide gonad rudiment, suspended above oil sac.

Figure 21. Calanus finmarchicus fifth
copepodite with possible thin elongate type of gonad rudiment, suspended above oil sac
(not lying on oil sac as expected).
2.0 Ancillary Project: Spatio-Temporal Variability of Bio-Optical Properties in the Gulf of Maine
Principal Investigator: H.M. Sosik (WHOI)
2.1. Introduction
The optical properties of coastal waters are influenced by a variety of materials and processes. Inherent optical properties (e.g., absorption and scattering coefficients) depend strongly on local production of phytoplankton and other optically-active particulates, but are also influenced by advection of constituents, such as dissolved organic material of terrigenous origin, and other processes such as resuspension of bottom sediments. Our objectives are to determine important sources and scales of optical variability by observing distributions of inherent and apparent optical properties in both space and time. Separately assessing particulate and dissolved material properties and making spectral measurements (which can be used to characterize broad classes of material) will allow this to be accomplished. The work conducted on this cruise is part of a larger program supported by the Office of Naval Research and which includes measurements made from a vertically-profiling mooring, a towed vehicle (BIOMAPER II), earth-orbiting satellites (SeaWiFS, AVHRR, etc.), and research vessels conducting conventional station surveys.
2.2. Methods
Several bio-optical sensors were deployed on BIOMAPER II. These included two ac-9 dual-path spectral absorption and attenuation meters (Wet Labs, Inc.), as well as a spectral downwelling irradiance sensor (OCI-200 series, Satlantic, Inc.), a spectral upwelling radiance sensor (OCR-200 series, Satlantic, Inc.), and a HydroScat-6 spectral backscattering sensor (HOBI Labs, Inc.). One of the ac-9's measured whole-water properties and the other was configured with an in-line 0.2 m water filter to assess absorption by dissolved material; particulate absorption will be determined by difference between total and dissolved. The instruments were configured with matching wavelength bands selected to cover the visible spectrum and to reflect those on the SeaWiFS ocean color sensor [ac-9's: 412, 440, 488, 510, 532, 555, 650, 676, 715 nm; radiometers: 412, 443, 490, 510, 555, 665, 683 nm; HydroScat: 442, 488, 532, 589, 620, 671;]. The data acquisition system (designed and assembled at WHOI) for these instruments is based on a subsurface PC-104 and includes 2 serial ports, a 16-channel/16-bit A/D converter, an 8 MB flash disk, and an ethernet adapter for communication with the BIOMAPER II Lantastic network. Through network access, this system allows storage of data files on a desktop PC aboard the ship. In addition to the measurements made from BIOMAPER II, continuous logging of surface spectral irradiance was also carried out with a spectral downwelling irradiance sensor (MVDS, Satlantic, Inc.) connected to the same PC. Data from the Hydroscat was logged internally and downloaded through an RS-232 connection to a PC in the lab each time BIOMAPER II was recovered. The PC-104 and Hydroscat were both powered from the "spare power" circuit.
The ac-9's on BIOMAPER II were deployed with a new mounting system. The instruments are in the same location as in the previous design, however, they are now mounted on a hinged plate that allows them to be swung out of the vehicle for convenient access during at-sea maintenance and calibration (Figure 22). When locked in place on this new plate the instruments are no longer horizontal with respect to water flow through the optical tubes, but instead are inclined approximately 30 degrees upward toward the tail of BIOMAPER II. The Hydroscat was mounted directly behind the ac-9's with the face of the sensor sampling water below the vehicle through a hole in the bottom of the frame (Figure 22).

Figure 22. New mounting system for the ac-9s on BIOMAPER II. Anne Canaday conducting a pure
water calibration of the ac-9s. The Hydroscat-6 is visible in the aft bay.
Sampling conducted on the cruise also included water collection and measurements of downwelling irradiance and upwelling radiance with a tethered, free-fall vertical profiling radiometer (SPMR/SMSR system, Satlantic, Inc.) deployed away from the ship. This work was conducted as close to mid-day as possible on each day of the cruise. Water samples were collected for pigment analysis and for estimation of light absorption by particulate and dissolved material. Pigment samples were collected on Whatman GF/F filters and extracted in 90% acetone for fluorometric estimation of chlorophyll a and phaeopigment concentrations. Spectrophotometric determinations of particle absorption were made on freshly filtered samples (GF/F filters) before and after extraction of phytoplankton pigments with methanol, and dissolved absorption was measured on 0.2 m filtrate in 10-cm cuvettes. These spectra were acquired with 1 nm resolution between 300 and 800 nm. At all stations water samples also were collected and frozen or preserved for several other types of post-cruise analysis, including determination of macro-nutrient concentrations, flow cytometric measurement of individual particle optical properties, and microscopic identification of phytoplankton.
The vertically profiling radiometer deployed at mid-day CTD stations has the same spectral bands as the optical heads on BIOMAPER II. The system also includes a subsurface reference sensor (spectral downwelling irradiance at 30-cm depth). Vertical profiles were conducted within 2 hours of local apparent noon, immediately prior to or immediately after the CTD/water sampling casts.
Underway measurements with a Fast Repetition Rate Fluorometer (FastTracka FRRF, Chelsea Instruments) also were made in flow-through mode using the ship's uncontaminated seawater throughout the cruise duration. This instrument allows the photosynthetic physiology of phytoplankton to be measured rapidly and non-invasively. Dark-adapted measurements of variable fluorescence yield, the functional absorption cross-section for photosystem II reaction centers, and the turnover time for electron transport were made.
A Coulter Multisizer was used to make measurements of particle size distribution on water sampled with the CTD and the underway flow-through system. The counter was fitted with a 50-m aperture such that reliable distributions were obtained in the size range of 1 to 30 m.
2.3. Results
Optical data were collected from the BIOMAPER II during the deep basin surveys. Initial processing of data collected showed spatial variations in scattering and absorption coefficients associated with water column structure. Highest values were found near the bottom and in conjunction with phytoplankton patches in the upper 50 m (e.g. Figure 23).
Figure 23. Distributions of absorption and scattering coefficients in
Wilkinson Basin based on ac-9 measurements from BIOMAPER II.
Absorption at blue wavelengths (e.g. 440 nm, upper panel) is highest in
the upper 50 m, but also shows peaks near the bottom in some areas. In
contrast, red absorption (676 nm, middle panel) is only elevated in the
surface layer, consistent with phytoplankton pigments as the source.
High scattering coefficients (lower panel) associated with both the
phytoplankton-dominated layer and the bottom confirms that the near
bottom material is predominately particulate. [Optical data were not
collected on the first leg transect leg through the basin.]
Approximately 30 water samples were analyzed for pigment, high spectral resolution absorption and particle size distribution. Water was collected from 6 depths selected from throughout the water column on 4 CTD/rosette casts and from two days of surface sample collection. During the surface sampling collection days, samples were coordinated with the closest BIOMAPER II upcast so that BIOMAPER was near the surface. Pigment concentrations and particle absorption coefficients were high in the surface mixed layer (around 1 ug l-1), with magnitudes falling off rapidly below 50 m. Absorption by non-phytoplankton particulates was low in the surface waters.
The free-fall radiometer was successfully deployed at 4 stations with 2-3 replicate vertical profiles conducted during each deployment. Casts with the radiometer covers in place were also carried out to allow correction for temperature dependence of dark values. These data will be analyzed to determine vertical profiles of diffuse attenuation coefficients and remote-sensing reflectance.
Throughout the entire cruise data were collected with the FRR fluorometer. Preliminary results show daily variations in photosystem II efficiency, with inhibition evident just after local noon on sunny days and absent on cloudy days.
Scientific personnel
1. Charles Greene Cornell University(Chief Scientist)
2. Karen Fisher Cornell University
3. Mark Benfield Louisiana State University
4. Peter Wiebe Woods Hole Oceanographic Institution
5. Ru Morrison Woods Hole Oceanographic Institution
6. Mari Butler Woods Hole Oceanographic Institution
7. Yoshi Endo Woods Hole Oceanographic Institution
8. Anne Canaday Woods Hole Oceanographic Institution
9. Rebecca Green Woods Hole Oceanographic Institution
10. Joseph Warren Woods Hole Oceanographic Institution
11. Andrew Girard Woods Hole Oceanographic Institution
12. Andone Lavery Woods Hole Oceanographic Institution
13. John Tolli Woods Hole Oceanographic Institution
14. Jennifer Crain Oregon State University
15. David Nelson University of Rhode Island
Ship's officers and crew
1. Rhett McMunn Captain
2. Bill Appleton Chief Engineer
3. Fred Curtis AB Seaman
4. Steve Vetra First Mate
5. Tom Hickey Assistant Engineer
6. Carol Lee Harrington AB Seaman
7. Dick Fole Second Mate
8. Tim Varney Assistant Engineer
9. Jay St. Germain AB Seaman
10. Charlie Baker Bos'n
11. Dan Butler Steward
APPENDIX I. R/V ENDEAVOR Cruise 330 Event Log.
APPENDIX II. R/V ENDEAVOR Cruise 330 Acoustic Log
APPENDIX III. R/V ENDEAVOR Cruise 330 VPR Log
APPENDIX IV. R/V ENDEAVOR Cruise 330 "All" Tapes cross-Comparison Log
APPENDIX V. R/V ENDEAVOR Cruise 330 Observations of Zooplankton Collected with MOCNESS