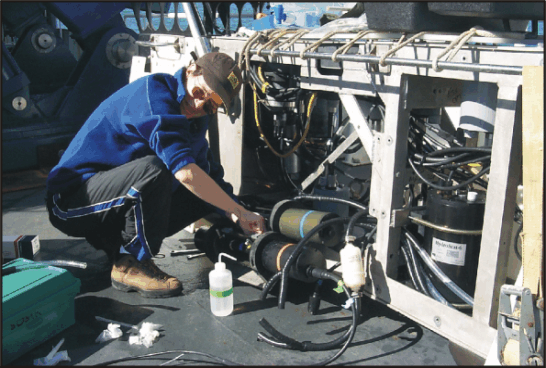
 Figure 22. New mounting system for the ac-9’s on BIOMAPER II. Anne Canaday conducting a pure
water calibration of the ac-9's. The Hydroscat-6 is visible in the aft bay.
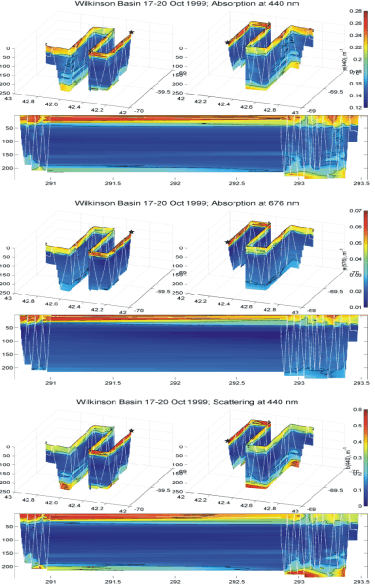
 Figure 23. Distributions of absorption and scattering coefficients in
Wilkinson Basin based on ac-9 measurements from BIOMAPER II.
Absorption at blue wavelengths (e.g. 440 nm, upper panel) is highest in
the upper 50 m, but also shows peaks near the bottom in some areas. In
contrast, red absorption (676 nm, middle panel) is only elevated in the
surface layer, consistent with phytoplankton pigments as the source.
High scattering coefficients (lower panel) associated with both the
phytoplankton-dominated layer and the bottom confirms that the near
bottom material is predominately particulate. [Optical data were not
collected on the first leg transect leg through the basin.]
 Figure 22. New mounting system for the ac-9’s on BIOMAPER II. Anne Canaday conducting a pure
water calibration of the ac-9's. The Hydroscat-6 is visible in the aft bay.
 Figure 22. New mounting system for the ac-9’s on BIOMAPER II. Anne Canaday conducting a pure
water calibration of the ac-9's. The Hydroscat-6 is visible in the aft bay.
 Figure 23. Distributions of absorption and scattering coefficients in
Wilkinson Basin based on ac-9 measurements from BIOMAPER II.
Absorption at blue wavelengths (e.g. 440 nm, upper panel) is highest in
the upper 50 m, but also shows peaks near the bottom in some areas. In
contrast, red absorption (676 nm, middle panel) is only elevated in the
surface layer, consistent with phytoplankton pigments as the source.
High scattering coefficients (lower panel) associated with both the
phytoplankton-dominated layer and the bottom confirms that the near
bottom material is predominately particulate. [Optical data were not
collected on the first leg transect leg through the basin.]