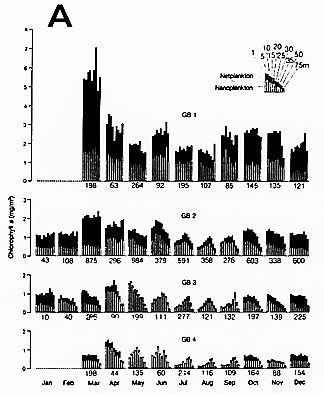
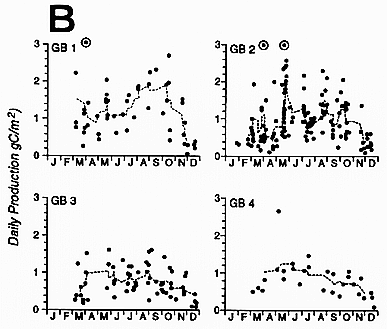
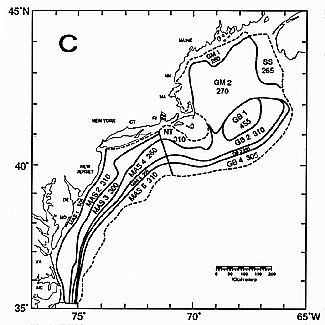
Figure 10. Seasonal chlorophyll abundance and seasonal primary productivity
in well-mixed and stratified areas on Georges Bank (from O'Reilly et al., 1987). Numbers
at base of histograms in (A) are samples in each month. Circled points in (B)
are offscale; dashed line is running average (N=7). Numbers in (C) are primary
production in gC per m2 per year.


