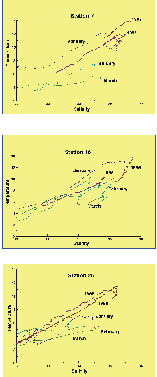
Temperature and salinity curves for water properties
in January, February and March 1998 at (Top) Standard
station 7, (Middle) Standard station 16 and (Bottom)
Standard station 25. The curves for each station in
March 1995 and March 1996 are also included as
dashed lines.
TIF image (2.3Mbytes)
Images are the property of the contributor. Contact the
Data Management Office
if you wish to use or reproduce any of these images.

