U.S. GLOBEC:
R/V OCEANUS Cruise 332
to the Gulf of Maine
Acknowledgments
We would like to thank the captain and crew of the R/V OCEANUS for a
productive cruise; their professionalism was greatly appreciated. We also thank the US
GLOBEC Georges Bank Program for supporting this cruise, with research support
provided by NOAA. Support for the bio-optical oceanographic research conducted on
this cruise was provided by an award from the ONR Young Investigator Program.
This report was prepared by Chuck Greene, Mark Benfield, Heidi Sosik, Peter Wiebe,
Louise McGarry, and Karen Fisher. The cruise was sponsored by the National Science
foundation and the National Oceanographic and Atmospheric Administration.
TABLE OF CONTENTS
INTRODUCTION
CRUISE NARRATIVE
INDIVIDUAL REPORTS
1.0 Principal Project: Processes Regulating the Recruitment of Calanus
1.1 Introduction
1.2 Methods
1.2.1 Broad-scale survey
1.2.2 MOCNESS stations
1.3 Results
1.3.1 Broad-scale survey
1.3.1.1 Multi-frequency acoustics
1.3.1.2 Video plankton recorder (VPR)
1.3.2. MOCNESS stations
2.0 Ancillary Project: Spatio-Temporal Variability of Bio-Optical Properties
2.1. Introduction
2.2. Methods
2.3. Results
CRUISE PARTICIPANTS
Scientific Personnel
R/V OCEANUS Officers and Crew
APPENDICES
Appendix 1: Eventlog
Appendix 2: Acoustics log
Appendix 3: Cross Reference log
INTRODUCTION
R/V OCEANUS 332 was conducted as a U.S. GLOBEC process cruise to
examine autumn conditions in the Gulf of Maine relevant to ecosystem processes on
Georges Bank. The major scientific objectives of the cruise included:
1. conducting broad-scale surveys to map the spatial distribution of Calanus
finmarchicus and its major invertebrate predators in the deep basins of the
Gulf of Maine,
2. conducting broad-scale surveys to map the spatial distribution of bio-optical
properties in the Gulf of Maine.
Summaries of the two primary projects supported by this cruise are presented in sections
following the cruise narrative.
R/V OCEANUS 332 was planned as a broad-scale, bio-optical and bioacoustical
survey cruise traversing the major basins of the Gulf of Maine. We had weather-based
contingency plans for conducting this survey cruise in either a clockwise manner
(Wilkinson Basin - Jordan Basin - Georges Basin) or the reverse. A grid of regularly
spaced transect lines was laid out for the survey of each basin. In addition to the survey
itself, time was allocated for daytime and nighttime MOCNESS tows as well as mid-day
light stations.
CRUISE NARRATIVE
The R/V OCEANUS departed Woods Hole on cruise OC-332 at 16:00 on 19
October 1998. After departure, it became clear that deployment of the BIOMAPER II
(BIo-Optical Multiple-frequency Acoustic and Physical Environmental Recorder) would
be problematic from the ship's crane. The ship returned to Woods Hole, and the next day
was spent modifying the instrument's bale and winch. The ship departed again at 0600 on
21 October. All scientific events conducted during the cruise can be found in the cruise
report event log (see Appendix 1).
The BIOMAPER II was deployed in Nantucket Sound at 09:13 (BMP 1) for a
systems check. During the check, a ground fault was detected in the Environmental
Sensing System (ESS). Otherwise, we were satisfied with the instrument's performance.
After recovering the BIOMAPER II, we changed course and headed for our first station in
Wilkinson Basin. During the transit, we attempted to troubleshoot the ground fault
problem in the ESS. We determined that the light sensor in the ESS option case was
weakly grounded to the pressure case and frame. This was fixed and the instrument was
reassembled.
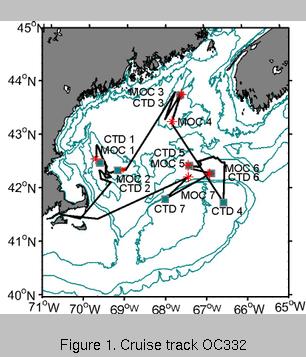
We arrived at our first deployment site in Wilkinson Basin during the late
afternoon of 21 October (Figure 1, below left). The BIOMAPER II was deployed at 17:17 (BMP 2)
and all systems were checked. The ESS failed to respond, and we were forced to recover
the instrument. Upon examination of the ESS, it was determined that the transmissometer
cable was plugged in improperly. After correcting this problem, the BIOMAPER II was
redeployed at 19:52 (BMP 3). By 20:00 that evening, we were towyoing in Wilkinson
Basin and collecting our first survey data on the cruise. At 21:25, we lost communication
with the ESS options case. We continued towyoing until midnight and then recovered the
instrument. Upon examination of the options case, we determined that it had leaked
seawater through the light sensor and the damage was irreparable. The BIOMAPER II
could be operated without the options case, but we lost the abilities 1) to pump water
through the conductivity and temperature sensors and 2) to operate the ESS's fluorometer
and transmissometer.
The BIOMAPER II was deployed again at 03:05 on 22 October (BMP 4). All
systems operated properly and we continued towyoing until the mid-day light station.
Towyos during this period were difficult and frequently disrupted as the wind constantly
forced the ship towards the tow cable. The problem was particularly acute when the
BIOMAPER II was being towed deep. Most survey transects had to be altered from the
planned track to handle the wind-induced towing problems. Nevertheless, we still were
able to acquire towyo survey data with reasonably good spatial coverage.
At 13:00, we began the mid-day light station activities. The BIOMAPER II was
towed at 5 m while these activities were conducted. The activities included deployment of
a tethered, free-fall vertical profiling radiometer (SMPR 1) and a CTD cast (CTD 1). The
CTD cast was completed at 14:55.
After completion of this station, we began surveying with the BIOMAPER II
again, initiating the first towyo at 15:30. Towyoing was continued until 16:45, at which
point the instrument was brought to a depth of 20 m. An evening MOCNESS tow (MOC
1) was conducted from 18:18 until 20:26 with BIOMAPER II collecting data at 20 m.
Towyoing with the BIOMAPER II began again at 23:06 and continued throughout
the night and next morning until we reached the site of our second mid-day light station at
10:20 on 23 October. During the eleven hours of towyoing, we continued to have wind-induced towing problems
that forced us to alter our cruise track. In addition, we had a
number of sporadic computer crashes that temporarily disrupted data acquisition.
At 10:44, we began the mid-day light station activities. The BIOMAPER II was
towed at 20 m while these activities were conducted. The activities included a CTD cast
(CTD 2) and deployment of the vertical profiling radiometer (SMPR 2). The radiometer
deployment was completed at 12:00.
 At 14:20, we began a daytime
MOCNESS tow (MOC 2). The
BIOMAPER II was towed at 20 m
during the net tow. The MOCNESS
tow was completed at 15:22 and the
BIOMAPER II was recovered at 15:30.
This completed all operations in
Wilkinson Basin and we began the 7.5
h transit to Jordan Basin.
At 14:20, we began a daytime
MOCNESS tow (MOC 2). The
BIOMAPER II was towed at 20 m
during the net tow. The MOCNESS
tow was completed at 15:22 and the
BIOMAPER II was recovered at 15:30.
This completed all operations in
Wilkinson Basin and we began the 7.5
h transit to Jordan Basin.
We arrived at our first
deployment site in Jordan Basin just
after midnight on October 24. The
BIOMAPER II was redeployed at
00:55 (BMP 5) to begin the first north-south transect line. North-south
transect lines were chosen to minimize
the wind-induced towing problems we
encountered in Wilkinson Basin.
Towyoing began at 01:34 and
continued without technical problems throughout the night and next morning.
Occasionally towyo operations had to be suspended when fixed fishing gear was observed
from the bridge. At 09:35, the BIOMAPER II was recovered to allow rapid steaming to
the top of the next north-south transect line.
On the transit to the next transect's starting point, we stopped for our
third mid-day light station. The BIOMAPER II was redeployed at 12:16 (BMP 6) and a short,
shallow (50 m) towyo was conducted to collect bio-optical data. We began the mid-day
light station activities at 13:00. The BIOMAPER II was towed at 10 m while these
activities were conducted. The activities included a CTD cast (CTD 3) and deployment of
the vertical profiling radiometer (SMPR 3). The radiometer deployment was completed at
14:30.
At 14:47, we began a daytime MOCNESS tow (MOC 3). The BIOMAPER II was
towed at 10 m during the net tow. This MOCNESS tow was completed at 16:00.
Towyoing with the BIOMAPER II began again at 16:34 and continued throughout
the remainder of the afternoon and evening until we reached the site of our fourth
MOCNESS tow. Few technical problems were encountered, but again we had to avoid
fixed fishing gear on several occasions.
At 23:02, we began a nighttime MOCNESS tow (MOC 4). The BIOMAPER II
was towed at 10 m during the net tow. This MOCNESS tow was completed at 00:15 on
25 October . At 00:25, the BIOMAPER II was recovered to allow rapid steaming to the
top of the next north-south transect line. Once the instrument was on the ship's deck, it
was observed that the weak-link shear pin in the bridle assembly was missing. It was
incredible luck that we did not lose BIOMAPER II during this recovery.
At this point in the cruise, it became unclear whether or not we would be able to
continue survey operations with the BIOMAPER II. Hence, the decision was made to
abandon the remaining transect line in Jordan Basin and head to the NE Peak mooring
site on Georges Bank where we would conduct bio-optical work until a new plan could be
formulated. The following morning, the captain; Joe Coburn, of WHOI ship operations;
and the scientific party's principal investigators held a phone conversation to determine
BIOMAPER II's fate as well as that of the cruise itself. It was decided that the
BIOMAPER II could be operated with a solid shear pin if we agreed to towyo the
instrument with less tow cable paid out than the depth of the water column we were
working in. Since the final survey work was planned for Georges Basin, the deepest of
the three basins we intended to visit, this decision had little impact on our science plan,
only forcing us to slow the ship's speed during the deepest portions of our towyos. The
cruise would continue.
We arrived at the NE Peak mooring site for our fourth mid-day light station at
approximately 11:00. The BIOMAPER II was deployed at 11:02 (BMP 7) and a short,
shallow (50 m) towyo was conducted to collect bio-optical data. We began the mid-day
light station activities at 11:27. The BIOMAPER II was towed at 10 m while these
activities were conducted. The activities included deployment of the vertical profiling
radiometer (SMPR 4) and a CTD cast (CTD 4). The CTD cast was completed at 12:30.
At 12:45, a bucket sample was collected at the surface when it became clear that the
surface bottle on the CTD rosette had not tripped. Another short, shallow (50 m) towyo
was conducted with the BIOMAPER II to collect bio-optical data at the end of the light
station. The BIOMAPER II was recovered at 13:38 for the transit to Georges Basin.
We arrived in Georges Basin and deployed the BIOMAPER II at 18:17 (BMP 8).
We began towyoing along an east-west transect at 18:44. This transect was planned to
avoid the wind-induced towing problems we had experienced earlier in the cruise. An
intense current shear in Georges Basin, with a strong southward component in the surface
waters and a strong northward component at depth, foiled this plan by constantly forcing
the ship towards the tow cable. Hence, as with the wind-induced problems described
previously, our transect had to be altered constantly northward from the planned track to
handle the current-induced towing problem. We continued to towyo until 22:13, when it
was decided to give up this losing battle. At this point, we decided to tow the
BIOMAPER II shallow until we reached the end of the transect line, where we would
then turn back and begin towyoing along an east or southeast heading. At 01:18 on 26
October, we began the return transect, only to find that the current-induced problems
were still with us. We altered course to a more southerly heading and continued to towyo
throughout the night and early morning. The rotary tidal currents forced us to constantly
alter our heading in a clockwise manner. By 05:00, we had actually swung completely
around and were heading back to the north. With the 08:00 watch change, the chief
scientist had the ship turn back on a southeast heading. Towyos were continued until the
fifth light station, although the ship continued to deviate in a clockwise manner from the
intended heading.
At 10:46, we began the mid-day light station activities. The BIOMAPER II was
towed at 20 m while these activities were conducted. The activities included a CTD cast
(CTD 5) and deployment of the vertical profiling radiometer (SMPR 5). The radiometer
deployment was completed at 12:12.
At 12:40, we began a daytime MOCNESS tow (MOC 5). The BIOMAPER II
continued to be towed at 20 m during the net tow. This MOCNESS tow was completed at
13:58.
At approximately 15:00, we began a new survey track that we hoped would
reduce our problems with the rotary tidal currents. We began towyoing on a southern
heading at 15:20. During the first towyo, we approached the Hague Line which had large
quantities of fixed fishing gear deployed along it. After receiving a warning from the
bridge, we began raising the BIOMAPER II very rapidly. Unfortunately, when the
instrument was at about 70 m, it snagged lines from one of the lobster pots. The
BIOMAPER II was recovered at 17:26 and inspected for damage. Damage to the tow
cable forced us to once again make a difficult decision. Although we could repair damage
to the tow cable at sea, there were no means to test its strength after the repair. Without an
ability to test the repaired cable, we decided to cease BIOMAPER II operations for the
remainder of the cruise.
With the BIOMAPER II out of commission, we decided to end all scientific
operations by the evening of 27 October and return to Woods Hole two days early. The
remaining time for scientific operations would enable us to conduct two more
MOCNESS tows in Georges Basin and one more mid-day light station on the North
Flank of Georges Bank.
At 20:30, we began a nighttime MOCNESS tow (MOC 6) in Georges Basin. The
MOCNESS tow was completed at 21:48. After the MOCNESS tow, a light trap was
deployed for testing by Mark Benfield. When the light trap was recovered after
approximately 0.5 h of testing, we began steaming to the North Flank station on Georges
Bank. On route, we conducted a CTD cast at 23:30 (CTD 6) to collect water samples for
Karen Fisher. This CTD cast was completed by 00:10 on 27 October, and we resumed our
transit to Georges Bank.
At 10:05, we began the mid-day light station activities on the North Flank of
Georges Bank. The activities included a CTD cast (CTD 7) and deployment of the
vertical profiling radiometer (SMPR 6). The radiometer deployment was completed at
10:56. We then began steaming to the site of our last daytime MOCNESS tow in Georges
Basin.
At 14:20, we began the last MOCNESS tow (MOC 7) in Georges Basin. This
MOCNESS tow was completed at 15:55. We then began the steam back to Woods Hole.
INDIVIDUAL REPORTS
1.0 Principal Project: Processes Regulating the Recruitment of Calanus
finmarchicus
from the Gulf of Maine to Georges Bank
Principal Investigators: C.H. Greene (Cornell), M.C. Benfield (LSU), P.H. Wiebe
(WHOI)
1.1 Introduction
Calanus finmarchicus dominates zooplankton secondary production on Georges
Bank during spring. The Georges Bank Calanus population is derived from diapausing
populations in the deep basins of the Gulf of Maine, the Slope Water, and the Scotian
Shelf east of the Bank. It is hypothesized that processes which regulate the survivorship
and supply of Calanus from diapausing populations in the deep basins of the Gulf of
Maine determine this copepod species' annual production on Georges Bank. To test this
hypothesis, research is being conducted 1) to determine what processes regulate the
abundance and survivorship of the diapausing Calanus populations in these deep basins,
and 2) to determine how physical and biological processes interact to seed Georges Bank
with recruits from these basins each year.
Acoustic and video remote-sensing methods are used to survey diapausing
populations of Calanus in Georges, Jordan, and Wilkinson Basins of the Gulf of Maine.
Broad-scale survey cruises conducted in early and late autumn during 1998 and 1999 will
be used to estimate survivorship of the diapausing Calanus and the scale-dependent
spatial coupling of Calanus and its principal invertebrate predators - the euphausiid,
Meganyctiphanes norvegica, and the siphonophore, Nanomia cara.
Results from field studies and feeding experiments will focus on quantifying the
relative contribution of predation to the overall mortality of the diapausing Calanus
population. The results from field studies also will be used as input to coupled physical-biological models
to examine how physical transport processes in the Gulf of Maine
interact with Calanus' seasonal and diel vertical migration behaviors to seed Georges
Bank with new recruits during winter.
 1.2 Methods
1.2.1 Broad-scale survey
A broad-scale survey of the Gulf of
Maine deep basins was conducted from
October 21-28, 1998. The survey track
included multiple transect lines in
Wilkinson, Jordan, and Georges Basins
(Figure 2, at right). The survey was conducted using
a high-speed, deep-towed system, the
BIOMAPER II (BIO_optical Multiple-
frequency Acoustic and Physical
Environmental Recorder), configured with
multiple-frequency (43 kHz, 120 kHz, 200
kHz, 420 kHz, and 1 MHz) acoustics, a
video plankton recorder (VPR), and several
bio-optical sensors (down- and upwelling
spectral radiometers, spectrally matched
attenuation and absorption meters). The
acoustic frequencies were chosen to bracket
the transition from the Rayleigh to
geometric scattering regions for the target species under investigation. A down- and up-looking transducer operated at each frequency to provide more complete coverage of the
water column when the instrument was towyoed. Echo integration was conducted at 30-second intervals to provide volume-backscattering data at all five frequencies. Split-beam data was collected at the four lower frequencies. All raw acoustic data were
recorded on digital audio tape, while the processing for echo integration was carried out
in real time.
The VPR mounted on BIOMAPER sampled a volume of .234 liters min-1. All
video images were processed for regions of interest (ROI) in real time and recorded on S-VHS tape for additional post-cruise processing at WHOI. GPS data were synchronized
with the VPR signal and stamped on the video time code.
1.2.2 MOCNESS stations
During the broad-scale survey cruise of the Gulf of Maine deep basins,
MOCNESS tows were conducted at two stations in Wilkinson and Jordan Basins and at
three stations in Georges Basin. The MOCNESS samples were collected for ground-truthing and inter-comparisons between the acoustic and VPR data. Splits from the
MOCNESS samples were preserved in formalin for quantitative studies and preserved in
alcohol or frozen in liquid nitrogen for molecular studies of Calanus population genetics
by Ann Bucklin (University of New Hampshire) and diapause physiology by Patrick
Hassett (University of Ohio) and Charles Miller (Oregon State University).
All MOCNESS tows were conducted with ship speeds of 1.5 - 2.0 knots. The nets
began collecting samples quantitatively from 10 m above the bottom to the surface. Eight
nets were used for sampling during oblique tows through the water column. The nets
were fired to achieve maximum vertical resolution (25 m) in the deepest and shallowest
nets. Approximately 150-350 m3 of water was filtered by each net.
1.3 Results
1.3.1 Broad-scale survey
1.3.1.1 Multi-frequency acoustics
The BIOMAPER II system consisted of the towed body, the Nomad winch with 0.68"
fiber optic cable, and a standard 20' shipping Van converted into a sea-going laboratory.
For this cruise, BIOMAPER II was carrying the HTI acoustic system with 5 pairs of
transducers (43, 120 200, 420, and 1000 kHz -up and down looking), a Video Plankton
Recorder (VPR), an Environmental Sensing System (pressure, temperature, conductivity,
fluorescence, downwelling light, beam transmission), and the Sosik Bio-optical package
(2 ac-9's, and upwelling and downwelling Spectral Radiometers). Two subsurface and
six van based PC microcomputers were used in the real-time data acquisition and data
processing (Figure 3).
The multi-frequency acoustics, bio-optical (including VPR), and physical oceanographic
data were collected during eight deployments of BIOMAPER II throughout the Gulf of
Maine (Table 1). Deployment 1 was a test of the gear in Nantucket Sound; deployments 2
to 4 were in Wilkinson Basin; deployments 5 and 6 were in Jordan Basin, deployment 7
was on Georges Bank, and deployment 8 was in Jordan Basin. On this cruise, straight
transect lines were not often obtained because of the difficulties in keeping the towing
wire away from the hull of the vessel. The total trackline distance along which data were
collected was 559 km (302 nm - Table 1). During the deployments, data were collected
in a down-looking mode with BIOMAPER II towed just below the surface, in a down and
up-looking mode while towed horizontally at some sub-surface depth, or towyoed from
the surface to within 10 to 30 m of the ocean bottom. As described above, during some
periods of BIOMAPER II data acquisition, MOCNESS tows were taken to collect
planktonic animals.
Figure 3. Schematic drawing of computer and sensor systems used in the acquisition and
processing of data from BIOMAPER II in October 1998.
Table 1.
Distance of BIOMAPER II Trackline Sections on R/V OCEANUS
Cruise332(19-28 October 1998).
| Deployment | Year-day Time
Start | Year-day Time
End | km | nm |
| 1 | 294.38403 | 294.47569 | 10.7 | 5.8 |
| 2 | 294.72014 | 294.80347 | 7.5 | 4.0 |
| 3 | 294.82778 | 295.00347 | 21.9 | 11.8 |
| 4 | 295.12847 | 296.64583 | 227.9 | 123.1 |
| 5 | 297.03819 | 297.39931 | 60.7 | 32.8 |
| 6 | 297.51111 | 298.01736 | 70.8 | 38.3 |
| 7 | 298.45972 | 298.56806 | 6.3 | 3.4 |
| 8 | 298.76181 | 299.72639 | 152.8 | 82.5 |
| Total | | | 558.6 | 301.6
|
The instrument systems on BIOMAPER II worked well with the exception of the options
case on the Environmental Sensing System (ESS). The options case leaked during the
first deployment in Wilkinson Basin and had to be taken off the system. This resulted in
the loss of the data from the transmissometer, fluorometer, and the downwelling light
sensor for the remainder of the cruise. The software to acquire the data, which was
provided by HTI, enabled the simultaneous acquisition of data on five frequencies each
with two transducers (one up-looking and one down-looking). The range of the 0.5 meter
depth strata allocated for each transducer was dependent on frequency with the lowest
frequencies given the longest range and highest frequency the shortest range i.e. 43 kHz =
200 m, 120 kHz = 200 m, 200 kHz = 149, 420 kHz = 100, 1000 kHz = 35). Data were
collected in 12 second intervals (averages). A ping cycle for all frequencies and
transducers took about 2.5 seconds with a firing sequence of down-looking 43, 120, 200,
420, 1000 kHz and then up-looking 43, 120, 200, 420, 1000 kHz. Target Strength
measurements were also collected on the lower 4 frequencies out to 20 meters from the
surface of the split beam transducers. In addition, the raw data for each ping were
recorded on DAT tape for postprocessing of either target strengths or echo-integrations on
a different time averaging basis. Each tape recorded two gigabytes of data and a total of
61 tapes were recorded during the cruise.
Post-processing software was used to combine the up-looking and down-looking data for
a given frequency and then display the data as color enhanced echogram. During the
cruise significant progress was made by Joe Warren and Karen Fisher in making
improvements in the PERL and MATLAB code used in the post-processing and it is now
possible to create plots of the volume backscattering in the water column shortly after a
BIOMAPER II section has been completed.
Deployment of the gear: On this cruise, BIOMAPER II was deployed from the starboard
side of the vessel aft of where the CTD was launched using the ships side boom. The
NOMAD winch equipped with 0.68" electro-optical cable and the power pack which
supplied the hydraulic fluid to the winch were located on the O-1 deck forward of the
ships crane and the Markey winch with 0.322 conducting cable. There were two sets of
winch controls, one placed next to the controls on the O-1 deck for the Markey winch and
normally operated by a seaman, and one placed in the Van for operation by the science
party after BIOMAPER II was deployed. The cable from the NOMAD winch was led out
to a 36" sheave which was shackled to the outboard end of the primary portion of the
crane boom and down to the towing bridle of BIOMAPER II. The crane was used to
deploy and recover BIOMAPER II, and was also used to tow it after the boom was
dropped into a boom crotch at point forward of the crane base. With the crane boom in
the boom crotch and a forward stay line in place to provide additional support, the towing
wire was about 1.5 m off the side of the vessel.
Deployment of the fish was complicated. The Bosun, Jeff Stolp directed the operation.
He gave hand signals to the crane operator and the winch operator. Two member of the
science party held restraining lines going to BIOMAPER II, a third controlled the quick
release, a fourth held the forward stay line and the line to the sheave, and a fifth did other
jobs. To get the fish into the water, Jeff undid the forward stay going to the crane boom
and then motioned to have the boom lifted up and brought forward of the boom crotch to
get the towing cable close to the ship's hull. This was done so that he could move the
crane's headache ball and whip cable aft of the towing wire. Then he directed the crane
to swing aft of the boom crotch to a position adjacent to the fish while walking the
headache ball aft along the rail. Once the crane boom was in position, the quick release
mechanism with green 8' lifting straps were led through the towing bail and the
mechanism hooked into the headache ball hook. With the sheave hanging about 35'
above the deck and just outboard of the rail, and the two restraining lines (going from a
eye bolt on the deck to the SS rail on BIOMAPER II over to the SS rod on the air tugger
stand and then down to a cleat next to the eye bolt) held tight, the four aircraft straps
holding the fish to the deck were removed. Jeff motioned for the crane to haul in on the
whip and the fish was lifted off the deck, the two lines creaking with the stress of holding
the fish inboard. Once the fish was above the rail, Jeff motioned for the crane to be
lowered while the whip was still being hauled in. This caused the fish to rise above the
rail and move outboard, still straining against the lines holding it inboard. Slowly the fish
was moved to a position about 15' outboard of the rail and then a transfer of weight from
the crane whip to the towing cable was made. As the fish entered the water, the quick
release mechanism was released and the headache ball pulled back to the rail with a line
attached to it. Simultaneously, the restraining lines were released and pulled free. The
winch operator was directed by Jeff to lower the fish down about 20 meters to get it well
clear of the ship's hull. Then the crane was moved forward and down into the boom
crotch. Finally, the forward boom stay was re-installed into the towing position. The
winch operator switched the control of the winch to the van and the fish was ready to be
towyoed from inside the van.
This procedure was essentially reversed to bring BIOMAPER II back on board.
Some Results: There are several general observations that result from an initial look at
the post-processed acoustic data. Highest volume backscattering throughout the water
column was present in the upper 25 to 50 meters both day and night in all three Gulf of
Maine Basins. Diel vertical migration was evident in the echograms from all three basins
with somewhat lower volume backscattering in the surface waters during the day and
higher levels in this depth interval at night (Figure 4). During the same period, increased
scattering occurred at mid-depth levels (i.e. >100 meters) which became much weaker at
night, but not absent. In fact, in Wilkinson and Jordan basins, there was substantial
subsurface volume backscattering layers at night.
There were other subtle basin to basin differences in the acoustic structure as well. A
distinct layer was present near the bottom in both Wilkinson and Jordan Basins which did
not show up as well in Georges Basin. Also in Wilkinson Basin there were some
isolated, but quite strong targets (perhaps small fish schools) which occurred between 100
and 150 m depth during the daytime which were not evident in the other two basins
(Figure 5). Interpretation of these trends in terms of the biological entities present must
await the analysis of the VPR video tapes and the MOCNESS samples.
Instrumentation improvements: As with any new instrument system, this second scientific
cruise of BIOMAPER II was not without some difficulties. Some of the problems were
similar to those experience on ENDEAVOR 307 in October 1997 while others are new.
These include:
1) Extending the VPR camera and strobe to position further in front of the
BIOMAPER II nose to get around probable avoidance problems. As
described in the section on the VPR by M. Benfield, there was still some
evidence that some of the animals were making move to avoid the region
where their picture was taken.
2) A problem of concern, but of uncertain origin, has to do with the volume
backscattering anomalies that are evident in the echograms within 10 to 15
meters above and below BIOMAPER II when the system is being
towyoed. In regions of the water column where volume backscattering is
high, the values within 10 to 15 m of the towed body are enhanced and
where volume backscattering is low, the values are depressed. The effect
is not apparent when BIOMAPER II is held at a constant depth either near
the surface or at some depth below the surface. The effect may have
something to do with the towing wire and tow-bar assembly, but it is not
clear at this writing how these structures could have an effect on both the
up-looking and the down-looking transducers.

Figure 4. The afternoon diel migration of acoustic scatterers in Georges Basin in October
1998.
Figure 5. The discrete acoustic targets at depths of 100 to 150 meters are likely to be
small schools of fish.
1.3.1.2 Video plankton recorder (VPR)
 BIOMAPER II was equipped with a single-camera VPR mounted on the front of
the upper surface of the vehicle with the camera (starboard) and strobe (port) facing
inward (Figure 6). The separation distance between the camera and strobe transparent
ports was approximately 28.5 cm. The camera imaged a volume of 4.6 ml with
dimensions of 17 mm wide x 13.0 mm tall x 21 mm deep. The center of the volume was
located approximately 12 cm from the camera pressure port. The actual volume that was
detected by the frame grabber has a more limited height because the section of the video
image where the time-code is displayed is not included. Thus, the effective volume was
3.9 ml per field with dimensions of 17 mm wide by 11 mm tall by 21 mm deep. The
strobe was not equipped with a red filter and it illuminated targets with white light that
flashed at 60 Hz synchronized to the
camera with a 20 s pulse length.
Light from the strobe was aimed
obliquely relative to the camera so
that dark field illumination of
targets was achieved.
BIOMAPER II was equipped with a single-camera VPR mounted on the front of
the upper surface of the vehicle with the camera (starboard) and strobe (port) facing
inward (Figure 6). The separation distance between the camera and strobe transparent
ports was approximately 28.5 cm. The camera imaged a volume of 4.6 ml with
dimensions of 17 mm wide x 13.0 mm tall x 21 mm deep. The center of the volume was
located approximately 12 cm from the camera pressure port. The actual volume that was
detected by the frame grabber has a more limited height because the section of the video
image where the time-code is displayed is not included. Thus, the effective volume was
3.9 ml per field with dimensions of 17 mm wide by 11 mm tall by 21 mm deep. The
strobe was not equipped with a red filter and it illuminated targets with white light that
flashed at 60 Hz synchronized to the
camera with a 20 s pulse length.
Light from the strobe was aimed
obliquely relative to the camera so
that dark field illumination of
targets was achieved.
Several modifications to the VPR
were implemented on this cruise.
These were:
1. placement of the camera
and frame further forward on the
instrument;
2. increasing the image
volume;
3. modification of the VPR
frame; and
4. incorporation of real-time
image processing.
Placement of the camera and frame further forward on the instrument: Images from the
previous cruise suggested that many animals (particularly Calanus) were in alarm or
escape postures, and this was probably due to the turbulent flow field deflected from the
nose cone of the vehicle into the imaged volume. To remedy this, we mounted the VPR
further forward on the vehicle so that the image volume was 9.5 cm in front of the leading
edge of the vehicle nose and almost directly above the foremost point on the rubber
fender. Originally, we had planned to move the VPR forward and raise it on an elevated
frame. Prior to deployment it was pointed out that the large surface area of this extension
would act as a vertical canard and would probably overcome the stability provided by the
vertical stabilizer at the tail. For this reason, we did not use it.
The results of this modification were mixed. The majority of Calanus were still
observed in various alarm postures; however, euphausiids were imaged in moderate
numbers for the first time (Figure 6). It appears that unless we move the cameras further
forward, possibly raise them, and increase the separation between camera and strobe, we
will have to accept that measurement of in situ orientation is not possible with the VPR
on BIOMAPER II. The only real disadvantages created by the present configuration are 1)
the potential for damage to the VPR if BIOMAPER II strikes another object with the nose
and 2) the loss of a diagnostic taxonomic characteristic for the identification of Calanus -
the presence of setae on the distal ends of the antennae.

Figure 7. Composite of Calanus finmarchicus
images from the VPR. All animals are shown at the same size scale and in
their observed orientations. Note their prominent oil sacs. Very few
individuals were seen with outstretched antennae, indicating that they
still detect and respond to hydrodynamic disturbances from the BIOMAPER II.
Increasing the image volume: The image volume of the camera had been approximately
0.6 ml during the October 1997 cruise. While this provided excellent images of Calanus,
it was too small to permit adequate identification of the gelatinous plankton, particularly
siphonophores. Such a small portion of the animal was imaged that it was difficult to
distinguish siphonophores from ctenophores, salps and medusae. The present image
volume (8.2 ml) allows identification of Calanus while providing a large enough image
of siphonophores to distinguish them from other gelatinous taxa. Further, very few if any
images of Meganyctiphanes norvegica were collected during the previous cruise. We
know that the probability of detection is a function of the abundance of a taxon, the image
sample volume, and avoidance behavior. By increasing the volume and moving the
camera forward, we hoped to be able to detect euphausiids and were rewarded with fairly
frequent images of M. norvegica.
Modification of the VPR frame: During the last cruise, it was common for siphonophore
colonies to become entangled on the leading horizontal bar of the VPR frame. That bar
was located immediately above the image volume. The colonies appeared as out-of-focus
strands that flapped in and out of the image. Prior to this cruise we had moved that bar
further to the rear so that it could no longer entangle siphonophores. This modification
had the additional potential of reducing avoidance by euphausiids.
Incorporation of real-time image processing: During this cruise we had an image
processing computer (IPC) system in the BIOMAPER II control van running the real-time
VPR (RTVPR) program. Video data were archived on videotape and were also processed
by the IPC in real time. The IPC digitizes each video field at 60 Hz. Each digitized image
is examined to locate targets that meet user-defined criteria for brightness, focus, and
size. Targets that meet these criteria are termed regions of interest (ROI), and ROIs are
cropped with a user-defined border and written to disk. This entire process runs in real-time
on a Pentium-Pro personal computer (PC) equipped with hardware and software
from Imaging Technologies Inc. Although we have ordered a system to extract ROIs, it
was not available in time for this cruise and we are grateful to Cabell Davis (WHOI) for
loaning one to us.
The RTVPR application ran on a 200-MHz dual-processor Pentium Pro PC
running Windows NT Workstation 4.0 (service pack 3) and equipped with 64 MB of
RAM, two 2.1 GB SCSI internal hard drives and an external 1 GB Jaz drive. Two
Imaging Technologies PCI boards performed the majority of the image processing
operations. This system generally worked well; however, it appeared to be very sensitive
to warmer temperatures. Whenever the computer had been running for an extended period
of time and the temperature in the van warmed up the system would crash. Subsequent
attempts to restart the computer generally failed due to errors in recognizing hard drives
or an apparent lack of ROM information. Our solution was to allow the system to cool
down and to reduce the temperature in the van. We eventually resorted to removing the
cover from the computer and that, combined with maintaining a cool temperature in the
van, generally eliminated crashes to one or two per day.
 The RTVPR program
provides a simple interface
(Figure 8, at right) that allows the user to
control four parameters that
determine whether an imaged
target is selected as a ROI or
not.
The RTVPR program
provides a simple interface
(Figure 8, at right) that allows the user to
control four parameters that
determine whether an imaged
target is selected as a ROI or
not.
The threshold can
range from 0-255 (8 bit images
have 255 levels of grey), and
this parameter determines how
distinct a ROI must be relative
to the background
illumination. On this cruise,
the level of illumination was
not as high as we had
experienced during the
October 1997 cruise because
of difficulty in providing an
even illumination level over
the entire field of view.
Consequently, images did not
have as much contrast as in the
prior cruise. Threshold levels were initially established after recording a short (10 min)
section of tape (TAPE000) in Vineyard Sound. That water had many small particles that
required a relatively high threshold of 56.
The in-focus threshold controls the degree of sharpness or focus that each target
must have to be selected. While a threshold of approximately 15 appeared to do a good
job of excluding small targets that were out of focus, it also led to the unwanted exclusion
of many large gelatinous organisms. At a level of 5, few gelatinous targets were excluded.
The minimum blob size is used to set a minimum size cut-off level below which, targets
are not considered as ROIS. This was set to 40 so that small copepods would be included.
The growth scale allows a user-defined border, expressed as a percentage of the
ROI diameter, to be added to each ROI. This ensures that small appendages, such as
antennae, are included in the image even though they may not be bright enough to exceed
the threshold. The growth scale was set to 110%.
Based on the organisms in the test tape, the initial program settings (threshold =
56, in-focus threshold = 5, minimum blob size = 40, growth scale = 110%) appeared to do
a good job of capturing targets that appeared to the viewer to be in focus organisms.
Later in the cruise, there was an opportunity to examine the performance of these
settings. The water in Wilkinson Basin had much less fine particulate matter which
allowed us to set a lower threshold. We were also getting a lot of small copepods of the
size of Oithona as well as other small out of focus targets while we were missing some
siphonophores. In some cases where we were towing for extended periods near the
surface, ROI counts were exceeding 15,000. The settings were modified (threshold = 44,
in-focus threshold = 10, minimum blob size = 40, growth scale = 110%) to reduce the
numbers of small ROIS while ensuring that we still were capturing images of Calanus
and gelatinous organisms. This appeared to help, but we were still plagued by large
numbers of very small targets and there was some evidence that we were missing
gelatinous targets near the surface. Consequently, the minimum blob size was increased
to 80 and the in focus threshold was reduced back to 5. Numbers of ROIS and ROI
extraction parameters are summarized in Table 2.
File Structure: The IPC generated a large number of ROIS
during each 2-h tape. Each
Year-Day (based on local time), a new directory was created (D294, D295,..., D302).
Within this directory, a subdirectory was created that corresponded to each 2-h VPR tape
recorded during that year-day. All ROIS extracted during the period a given tape was
recording, were stored in the TAPE### subdirectory. The problem with this file structure
was that the large numbers of ROIS (Table 2) within single directories imposed a high
overhead on the system. System performance was degraded, data could not be written at a
rate that was sufficient to burn a CD, and more than half of each 1 GB Jaz disk's storage
space was taken up by directory overhead. To alleviate this problem, a regular sequence
of subdirectories that corresponded to approximately 16.5 min were created within each
tape directory. These subdirectories were named with the start and end range of ROIS that
they contained. This greatly reduced the overhead and performance problems that we
originally encountered. Data were stored on the IPC and after each tape had finished, all
ROIS from that tape were copied to a 1 GB Jaz drive.
Operations: The VPR was operational during all BIOMAPER II deployments. Our
standard operating procedure was to start and stop the 2-h VPR video tapes and acoustic
DATs at the same times. Shortly after a video tape ended, the RTVPR program was
halted and it was not restarted until after recording began on a new video tape. Generally
there was a delay of 2-10 min in restarting ROI acquisition because of the need to transfer
ROIS from the previous tape to Jaz and then re-configure the RTVPR application. In
some cases, ROIS were not extracted because of RTVPR configuration errors, system
crashes, or delays due to transferring of large numbers of files to Jaz drives. System
crashes were relatively frequent events and for this reason, there are gaps in the ROI
record. Tapes were always archived and post-processing can extract ROIS to fill in these
gaps or to evaluate alternate RTVPR settings.
Results: The RTVPR program allowed us to extract ROIS on-the-fly, but, unfortunately,
it has not automated the analysis of our data. Still, one of the principal benefits of having
the RTVPR system aboard was that we could see the distributions of zooplankton at a
more leisurely rate than the 60-Hz near-subliminal glimpses that we were afforded on the
previous cruise. As the ROIS advanced across the display monitor, it was possible to
identify individual organisms and to get some sense of the relationship between
abundance and the vertical position of BIOMAPER. Regrettably, we did not have enough
people on watch to task anyone solely with watching ROIS and annotating the VPR log.
Still, several admittedly subjective impressions arose from watching the ROIS: (1) while
patches of Calanus were present at depth, they were also distributed throughout the water
column in both Wilkinson and Jordan Basins; (2) physonect siphonophores were
abundant at depth and near the surface; and (3) large calanoid copepods, which were not
C. finmarchicus nor Euchaeta norvegica, were present at depth in Wilkinson and Jordan
Basins.
The images from the VPR were striking in their clarity and quantity. We observed
numerous ctenophores (Figure 8) and siphonophores (Figure 9) in feeding postures with
tentacles extended. Other gelatinous forms included salps, appendicularians, and several
species of medusae (Figure 8). Euphausiids, which were probably Meganyctiphanes
norvegica, were reasonably common (Figure 8), and almost all were in escape postures.
The pteropod Limacina retroversa was highly abundant near the surface; however, its
distribution was very patchy. Tomopterid polychaetes were observed periodically at
depth.
Recommendations: This cruise will be followed by a companion voyage during the first
half of December 1998. In the month between the completion of this cruise and the onset
of the next, several issues that will improve the quality of VPR data need to be
considered. Long-term archiving of VPR data to CD-ROM was not possible during this
cruise because of the difficulties created by excessively large directories. Data were
archived to Jaz cartridges and a system of segregating ROIS into several subdirectories
should reduce file system overhead. However, acquisition of a CD-ROM burner devoted
to the VPR IPC should be seriously considered. Finally, careful review of several tapes
collected on this cruise needs to be undertaken to determine the most appropriate RTVPR
extraction parameters for use in our next cruise.

Figure 9. VPR ROIS containing (A) ctenophores, (B) euphausiids, and (C)
anthomedusae.

Figure 10. Composite of siphonophore images from
Wilkinson and Jordan Basins.
Although no single colony could be completely imaged by our camera because of
the focal length, colonies are clearly distinguishable from other gelatinous taxa (e.g.
ctenophores and medusae in Figure 9). Nectophores, gastrozooids and tentacles are
clearly visible and pneumatophores were imaged on multiple occasions.
Table 2. Numbers of ROIS generated during each VPR tape and the corresponding
RTVPR extraction criteria and archive disk identity.
Upper Level
Directory |
Number
ROIS |
Size
(MB) |
Threshold |
In-Focus
Threshold |
Minimum
Blob Size |
Growth
Scale |
Storage
Location |
|---|
| \D294\TAPE001 |
1,965 |
10.4 |
56 |
5 |
40 |
110 |
JAZ-1 |
| \D294\TAPE002 |
477 |
3.7 |
56 |
5 |
40 |
110 |
JAZ-1 |
| \D295\TAPE003 |
1,344 |
7.7 |
56 |
5 |
40 |
110 |
JAZ-1 |
| \D295\TAPE004 |
1,855 |
6.1 |
56 |
5 |
40 |
110 |
JAZ-1 |
| \D295\TAPE005 |
2,354 |
8.1 |
56 |
5 |
40 |
110 |
JAZ-1 |
| \D295\TAPE006 |
607 |
2.5 |
56 |
5 |
40 | 110 |
JAZ-1 |
| \D295\TAPE007 |
5,088 |
17.7 |
56 |
5 |
40 |
110 |
JAZ-1 |
| \D295\TAPE008 |
298 |
0.8 |
56 |
5 |
40 |
110 |
JAZ-1 |
| \D295\TAPE009 |
5,665 |
20.7 |
56 |
5 |
40 |
110 |
JAZ-1 |
| \D295\TAPE010 |
6,939 |
24.5 |
56 |
5 |
40 |
110 |
JAZ-1 |
| \D295\TAPE011 |
5,150 |
14.2 |
56 |
5 |
40 |
110 |
JAZ-1 |
| \D295\TAPE012 |
4,684 |
20.9 |
56 |
5 |
40 |
110 |
JAZ-1 |
| \D296\TAPE013 |
2,490 |
13.3 |
56 |
5 |
40 |
110 |
JAZ-1 |
| \D296\TAPE014 |
3,149 |
13.9 |
56 |
5 |
40 |
110 |
JAZ-1 |
| \D296\TAPE015 |
1,757 |
8.8 |
56 |
5 |
40 |
110 |
JAZ-1 |
| \D296\TAPE016 |
690 |
3.8 |
56 |
5 |
40 |
110 |
JAZ-1 |
| \D296\TAPE017 |
1,697 |
8.1 |
56 |
5 |
40 |
110 |
JAZ-1 |
| \D296\TAPE018 |
2,393 |
7.6 |
56 |
5 |
40 |
110 |
JAZ-1 |
| \D296\TAPE019 |
2,339 |
5.9 |
56 |
5 |
40 |
110 |
JAZ-1 |
| \D296\TAPE020\ |
No ROIS |
|
|
|
|
|
|
| \D296\TAPE021\ |
1,641 |
5.8 |
56 |
5 |
40 |
110 |
JAZ-1 |
| \D297\TAPE022\ |
1,587 |
7.7 |
56 |
5 |
40 |
110 |
JAZ-1 |
| \D297\TAPE023\ |
2,724 |
15.2 |
56 |
5 |
40 |
110 |
JAZ-1 |
| \D297\TAPE024\ |
3,496 |
22.9 |
40 |
10 |
40 |
110 |
JAZ-2 |
| \D297\TAPE025\ |
2,386 |
18.7 |
40 |
10 |
40 |
110 |
JAZ-2 |
| \D297\TAPE026\ |
9,410 |
44.8 |
40 |
10 |
40 |
110 |
JAZ-2 |
| \D297\TAPE027\ |
13,293 |
65.6 |
56 |
5 |
40 |
110 |
JAZ-2 |
| \D297\TAPE028\ |
273 |
3.0 |
40 |
10 |
40 |
110 |
JAZ-2 |
| \D297\TAPE029\ |
3,287 |
28.9 |
44 |
5 |
80 |
110 |
JAZ-2 |
| \D297\TAPE030\ |
3,375 |
28.0 |
44 |
5 |
80 |
110 |
JAZ-2 |
| \D297\TAPE031\ |
5,204 |
36.5 |
44 |
5 |
80 | 110 |
JAZ-2 |
| \D298\TAPE032\ |
5,086 |
30.4 |
44 |
5 |
80 |
110 |
|
| \D298\TAPE033\ |
4,048 |
25.5 |
44 |
5 |
80 |
110 |
|
| \D298\TAPE034\ |
4,545 |
27.1 |
44 |
5 |
80 |
110 |
|
| \D298\TAPE035\ |
8,944 |
67.9 |
44 |
5 |
80 |
110 |
|
| \D299\TAPE036\ |
5,228 |
|
44 |
5 |
80 |
110 |
|
| \D299\TAPE037\ |
5,082 |
|
44 |
5 |
80 |
110 |
|
| \D299\TAPE038\ |
No ROIS |
|
44 |
5 |
80 |
110 |
|
| \D299\TAPE039\ |
No ROIS |
|
44 |
5 |
80 |
110 |
|
| \D299\TAPE040\ |
4,707 |
|
44 |
5 |
80 |
110 |
|
| \D299\TAPE041\ |
3,664 |
|
44 |
5 |
80 |
110 |
|
| \D299\TAPE042\ |
15,106 |
|
44 |
5 |
80 |
110 |
|
| \D299\TAPE043\ |
No ROIS |
|
44 |
5 |
80 |
110 |
|
1.3.2. MOCNESS stations
MOCNESS samples revealed large, qualitative differences in zooplankton
composition and distribution among the Gulf of Maine deep basins. Zooplankton biomass
in the deeper waters of Wilkinson Basin was dominated by Calanus, other large
copepods, Meganyctiphanes, and gelatinous zooplankton, including siphonophores, and
anthomedusae. Zooplankton biomass in the shallower waters of Wilkinson Basin was
dominated by small copepods, pteropods, and ctenophores during the day. These taxa
were joined by vertically migrating euphausiids and siphonophores at night. Overall
zooplankton biomass seemed lower than last year, especially Calanus. The decapod
shrimp and salps that were abundant during last year's cruise were not abundant this year.
Zooplankton biomass in the deeper waters of Jordan Basin was dominated by
Meganyctiphanes , decapod shrimp, large copepods, anthomedusae, siphonophores, and
amorphous material from gelatinous animals. Zooplankton biomass in the shallower
waters of Jordan Basin was dominated by small copepods, amphipods, pteropods, and
ctenophores during the day. These taxa were joined by vertically migrating euphausiids
and siphonophores at night. Calanus was not very abundant, especially in comparison to
last year's findings.
Zooplankton composition in Georges Basin was highly variable, as observed last
year. Calanus, Meganyctiphanes, decapod shrimp, large copepods, chaetognaths,
anthomedusae, siphonophores, and amorphous material from gelatinous animals were
abundant in deeper waters at most tow sites. At one site, Meganyctiphanes was extremely
abundant and siphonophores were also abundant. In contrast, Calanus was very rare at
this site. Zooplankton biomass in the shallower waters of Georges Basin was dominated
by small copepods, pteropods, and ctenophores during the day. These taxa were joined by
vertically migrating euphausiids and siphonophores at night. The west to east gradient in
Calanus abundance observed last year was not detected this year.
2.0 Ancillary Project: Spatio-Temporal Variability of Bio-Optical Properties in the
Gulf of Maine
Principal Investigator: H.M. Sosik (WHOI)
2.1. Introduction
The optical properties of coastal waters are influenced by a variety of materials
and processes. Inherent optical properties (e.g., absorption and scattering coefficients)
depend strongly on local production of phytoplankton and other optically-active
particulates, but are also influenced by advection of constituents, such as dissolved
organic material of terrigenous origin, and other processes such as resuspension of bottom
sediments. Our objectives are to determine important sources and scales of optical
variability by observing distributions of inherent and apparent optical properties in both
space and time. Separately assessing particulate and dissolved material properties and
making spectral measurements (which can be used to characterize broad classes of
material) will allow this to be accomplished. The work conducted on this cruise is part of
a larger program supported by the Office of Naval Research and which includes
measurements made from a vertically-profiling mooring, a towed vehicle (BIOMAPER),
earth-orbiting satellites (SeaWiFS, AVHRR, etc.), and research vessels conducting
conventional station surveys.
2.2. Methods
Several bio-optical sensors were deployed on BIOMAPER II.
These included two
ac-9 dual-path spectral absorption and attenuation meters (Wet Labs, Inc.), as well as a
spectral downwelling irradiance sensor (OCI-200 series, Satlantic, Inc.) and a spectral
upwelling radiance sensor (OCR-200 series, Satlantic, Inc.). One of the ac-9's measured
whole-water properties and the other was configured with an in-line 0.2 m water filter to
assess absorption by dissolved material; particulate absorption will be determined by
difference between total and dissolved. The instruments were configured with matching
wavelength bands selected to cover the visible spectrum and to reflect those on the
SeaWiFS ocean color sensor [ac-9's: 412, 440, 488, 510, 532, 555, 650, 676, 715 nm;
radiometers: 412, 443, 490, 510, 555, 665, 683 nm]. The data acquisition system
(designed and assembled at WHOI) for these instruments is based on a subsurface PC-104 and
includes 2 serial ports, a 16-channel/16-bit A/D converter, an 8 MB flash disk,
and an ethernet adapter for communication with the BIOMAPER II Lantastic network.
Through network access, this system allows storage of data files on a desktop PC aboard
the ship. In addition to the measurements made from BIOMAPER II, continuous logging
of surface spectral irradiance was also carried out with a spectral downwelling irradiance
sensor (MVDS, Satlantic, Inc.) connected to the same PC.
Sampling conducted on the cruise also included water collection and
measurements of downwelling irradiance and upwelling radiance with a tethered, free-fall
vertical profiling radiometer (SPMR/SMSR system, Satlantic, Inc.) deployed away from
the ship. This work was conducted at mid-day on each day of the cruise. Water samples
were collected for pigment analysis and for estimation of light absorption by particulate
and dissolved material. Pigment samples were collected on Whatman GF/F filters and
extracted in 90% acetone for fluorometric estimation of chlorophyll a and phaeopigment
concentrations. Spectrophotometric determinations of particle absorption were made on
freshly filtered samples (GF/F filters) before and after extraction of phytoplankton
pigments with methanol, and dissolved absorption was measured on 0.2 mm filtrate in 10
cm cuvettes. These spectra were acquired with 1 nm resolution between 300 and 800 nm.
At most stations (CTD 1, 3, 4, 5, 7), water samples also were collected and frozen or
preserved for several other types of post-cruise analysis, including determination of
macronutrient concentrations, flow cytometric measurement of individual particle optical
properties, and microscopic identification of phytoplankton.
The vertically profiling radiometer deployed at each of the mid-day CTD stations
has the same spectral bands as the optical heads on BIOMAPER II. The system also
includes a subsurface reference sensor (spectral downwelling irradiance at 30 cm depth).
Vertical profiles were conducted within 2 hours of local apparent noon, immediately prior
to or immediately after the CTD/water sampling casts.
Underway measurements with a Fast Repetition Rate Fluorometer (FastTracka
FRRF, Chelsea Instruments) also were made in flow-through mode using the ship's
uncontaminated seawater for most of the cruise duration. This instrument allows the
photosynthetic physiology of phytoplankton to be measured rapidly and non-invasively.
Dark-adapted measurements of variable fluorescence yield, the functional absorption
cross-section for photosystem II reaction centers, and the turnover time for electron
transport were made.
2.3. Results
Optical data were successfully collected from the BIOMAPER II during each of
the deep basin surveys. Initial processing suggests that operation in towyo mode proved
very successful in mapping distributions of optical properties. Data collected during the
Wilkinson Basin survey show spatial variations in scattering and absorption coefficients
associated with water column structure. Highest values were found near the bottom and in
conjunction with phytoplankton patches in the upper 50 m. Absorption by dissolved
material exhibited less patchiness than found for particles, but in the blue region of the
spectrum, the dissolved component consistently appeared to be the major source of
absorption in the mid-water column.
Approximately 80 water samples were analyzed for pigment and high spectral
resolution absorption. Water was collected from 10 or 11 depths selected from throughout
the water column on 8 CTD/rosette casts (CTD3-10). Pigment concentrations and particle
absorption coefficients exhibited subsurface maxima (several mg l-1) at a depth of
approximately 30 m, with magnitudes falling off rapidly below 50 m. Absorption by
non-phytoplankton particulates was very low in the surface waters.
The free-fall radiometer was successfully deployed at 8 stations with 2-3 replicate
vertical profiles conducted during each deployment. Casts with the radiometer covers in
place were also carried out to allow correction for temperature dependence of dark values.
These data will be analyzed to determine vertical profiles of diffuse attenuation
coefficients and remote-sensing reflectance.
After some initial problems with data acquisition, several days of data were
collected with the FRR fluorometer. Preliminary results show daily variations in
photosystem II efficiency, with inhibition evident just after local noon on a sunny day and
absent on a cloudy day.
CRUISE PARTICIPANTS
Scientific Personnel
1.Charles Greene (Chief Scientist) Cornell University
2. Louise McGarry Cornell University
3. Karen Fisher Cornell University
4. Mark Benfield Louisiana State University
5. Peter Wiebe Woods Hole Oceanographic Institution
6. Heidi Sosik Woods Hole Oceanographic Institution
7. Joseph Warren Woods Hole Oceanographic Institution
8. Linda Martin Traykovski Woods Hole Oceanographic Institution
9. Rebecca Green Woods Hole Oceanographic Institution
10. Baylor Fox-Kempel Woods Hole Oceanographic Institution
11. Andrew Girard Woods Hole Oceanographic Institution
12. Helen Johnson Massachusetts Institute of Technology
13. Patrick Ressler Texas A&M University
14. Laura Stein Woods Hole Oceanographic Institution
R/V OCEANUS Officers and Crew
1. Lawrence Bearse Master
2. Courtenay Barber III Ch. Mate
3. Emily Sheasley 2nd Mate
4. Jefferey Stolp Boatswain
5. Horace Medeiros AB
6. James Ryder AB
7. Patrick Pike AB
8. Richard Morris Ch. Engineer
9. John Kevin Kay Jr. Engineer
10. Alberto Collasius, Jr. Jr. Engineer
11. Torri Corbett Steward
12. Linda Bartholomee Mess Attendant
Appendix 1. Event Log
Appendix 2: Acoustics Log
Appendix 3: Cross Reference log