Acknowledgments
This cruise and preliminary data report was prepared by Richard Limeburner, Charles Flagg, Jim Irish and Jim Doutt. We thank the officers and crew of the R/V Oceanus Cruise 333 for their skill and superb assistance that made possible deployment of 9 moorings and completion of a hydrographic survey. Special thanks to Wil Ostrom for leading the successful mooring deployment operation, and to Laura Goepfert for maintaining and operating the shipboard scientific equipment and coordinating this instrumentation with the needs of the scientific party.
The National Science Foundation and the National Oceanic and Atmospheric Administration sponsor the GLOBEC research effort. Support for Frontal Exchange Processes over Eastern Georges Bank Program as part of the U.S. GLOBEC Northwest Atlantic/Georges Bank Study, was provided by NSF research grant OCE-98-06379. Support for the Long-term Moored Program was provided by NSF research grant OCE-96-32348. All data and results in this report are to be considered preliminary.
Cruise Report
GLOBEC R/V OCEANUS OC333
Purpose and Accomplishment Summary 3
Cruise Results 4
1. Frontal Study Moorings 4
1.1 Eastern Flank – Mooring EF 4
1.2 North Flank Shallow – Mooring NFS 5
1.3 North Flank Deep – Mooring NFD 6
2. Long-term Moorings on the Northeast Peak 7
2.1 Northeast Peak – Mooring NEP 7
2.2 Real-Time Data Telemetry from the Northeast Peak Mooring 8
3. Hydrography 9
3.1 Calibration 9
3.2 Hydrographic Station Locations 10
3.3 Near-surface Temperature and Salinity Profiles 11 3.4 T/S plot of all stations 13
Cruise Event Log 14
Cruise Personnel 17
Chief Scientist’s Log of Daily Events 18
Appendix 1. Mooring Drawings 21
Appendix 2. CTD Profile Data 27
Lists of Figures
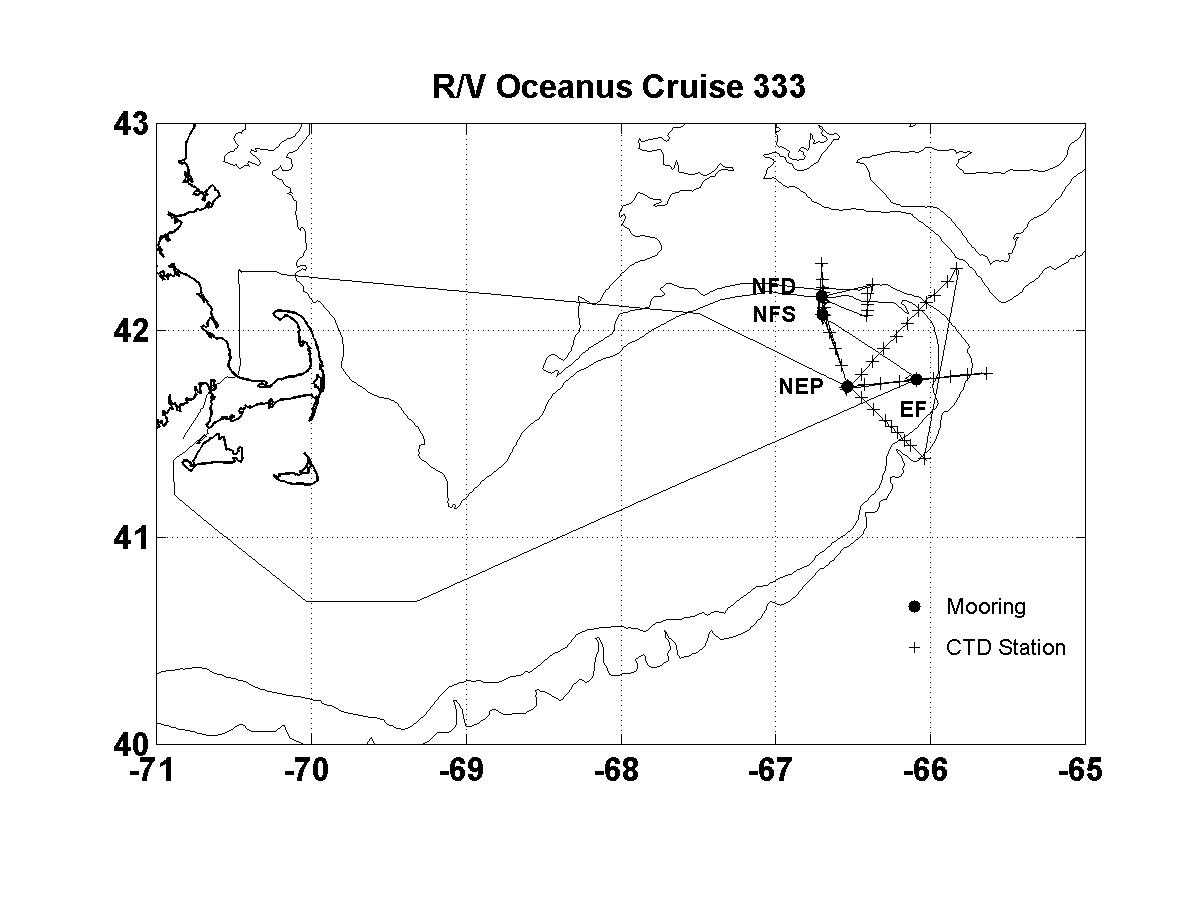
Figure 1. R/V Oceanus OC333 Cruise Track and Mooring Locations.
Figure 2. Bathymetric survey of the EF site
Figure 3. Bathymetric survey of the NFS site
Figure 4. Bathymetric survey of the NFD site
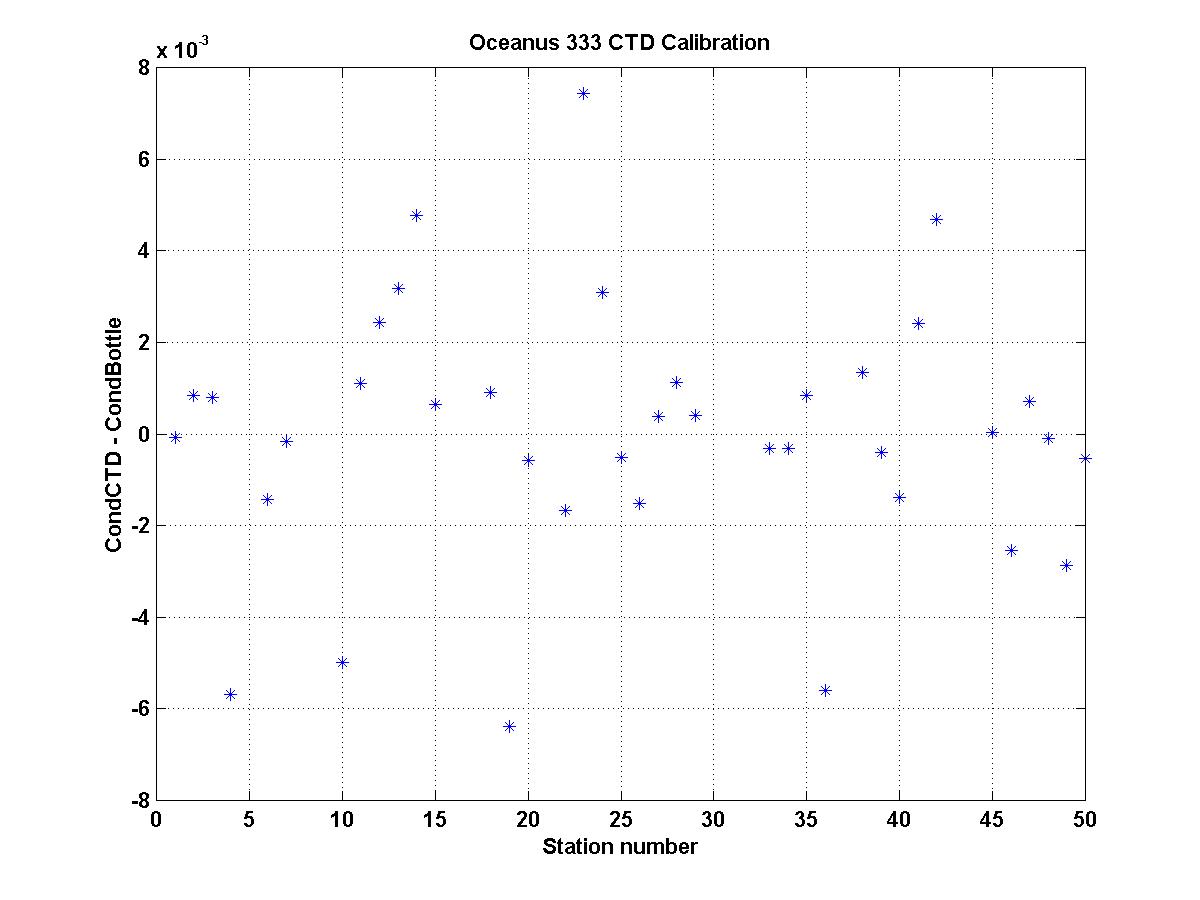
Figure 5. CTD Conductivity Sensor calibration
Figure 6. Oceanus 333 CTD station locations
Figure 7. Surface temperature, November 16-20, 1998
Figure 8. Surface salinity, November 16-20, 1998
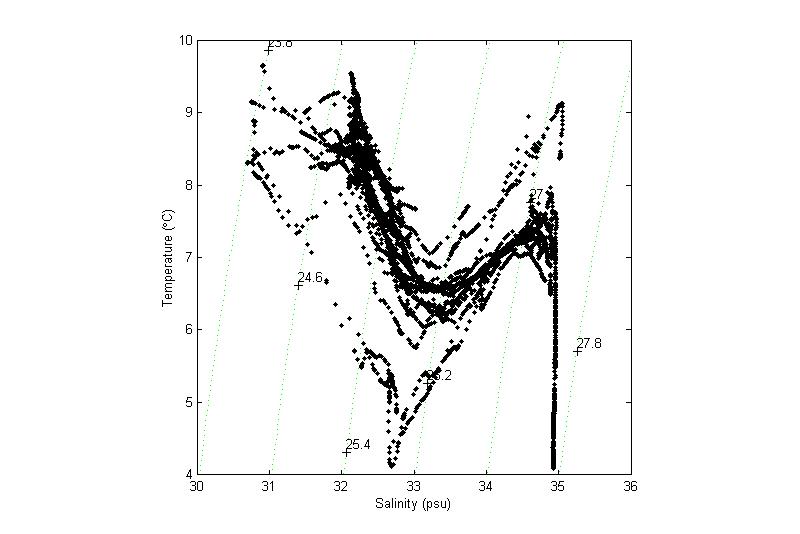
Figure 9. T/S plot of all CTD stations.
Figures 10 – 59. CTD profiles
US State Department Cruise No. 98-106
Woods Hole to Georges Bank to Woods Hole
November 15-21, 1998
The primary purpose of OC333 was to deploy instrumented moorings at several sites on the northern and eastern flank of Georges Bank and to conduct CTD and ADCP surveys over the eastern half of the Bank. This NSF program, Frontal Exchange Processes Over Eastern Georges Bank, was designed to focus on frontal processes, which occur over eastern Georges Bank in winter through spring. In particular we want to examine (a) the flow of water and biota onto the Bank along the northeastern flank driven by the strong local semidiurnal tidal currents (which can reach 1.5 m/s during spring tide), winter storms, and the seasonally-evolving density field, and (b) the advection of Scotian shelf water across the Northeast Channel onto the Bank associated with the shelf/slope front and episodic events such as winds and buoyancy pulses.
The cruise successfully deployed 9 moorings at 4 locations over the north and east flanks of Georges Bank. The ship’s track, mooring locations, and CTD station locations are shown in Figure 1. A total of 50 CTD stations were made during the cruise.
Figure 1. OC333 cruise track, CTD station and mooring locations.
Frontal Study Moorings – Richard Limeburner and Charles Flagg
Eastern Flank - Mooring EF
Mooring EF was an instrumented toroid surface mooring. Table 1 lists the mooring deployment times and positions. We arrived at the EF site at 1830 Z on 11/16/98 and first made a bathymetric survey of the region (Figure 2). The depth at the EF target location was approximately 94 m and little variation was observed within a half-mile radius of the target location.
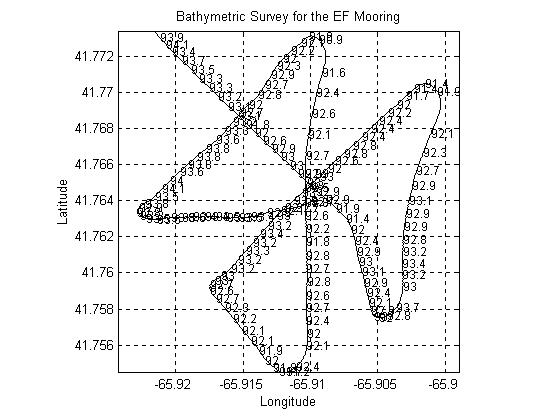
Figure
2. Depth m near the EF mooring site.
A CTD cast was then made to check on the calibration of the ship’s depth recorder and there was good agreement. However, we decided to postpone deployment of mooring EF until the following morning due to 25 kt winds from the northwest and heavy seas. We then steamed eastward to the NE Channel where we began making CTD stations along an east/west line.
At 1000 Z the wind was from the SE at 6 kt and we began preparing for deployment of mooring EF. The deployment led by Will Ostrom was completed without difficulty in the early morning. A schematic drawing of mooring EF is shown in Appendix 1. After deployment Craig Marquette ranged on the acoustic release, and we made CTD Station 11 adjacent to the deployed mooring. We then proceeded to the NFS mooring site.
1.2 North Flank Shallow - Mooring NFS
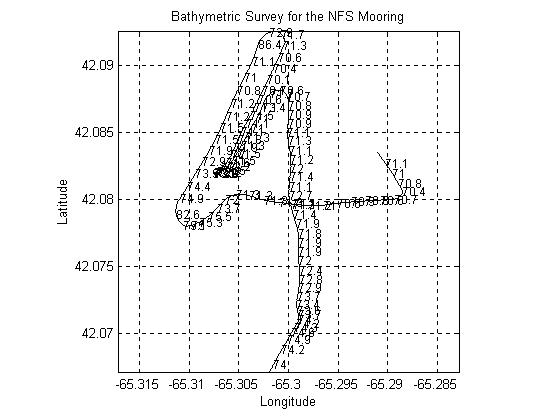
On the morning of 11/18/98 the winds were NE at 25 kt and the NFS subsurface mooring deployment was delayed until afternoon. The NFS subsurface mooring was deployed at 1937Z and CTD 23 was made after deployment. Schematics of the NFS moorings are shown in Appendix 1.
1.3 North Flank Deep - NFD Mooring
We then steamed to the NFD mooring site and made a bathymetric survey of the local region. The depth dropped off sharply from south to north, but a shoulder of 150-160 m depth was observed in the general area. See Figure 4 for a summary of the NFD depth survey.
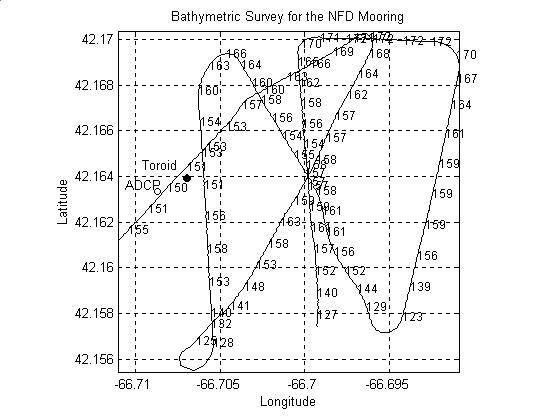
Figure
4. Depth m near the NFD mooring site.
A target site was chosen and the NFD toroid was deployed at 0000Z on 11/19/98. We postponed deployment of the ADCP mooring at NFD due to strong winds and began steaming eastward to make a short CTD section during the night across the north flank of the Bank. The next morning the ADCP mooring was deployed at NFD. Table 1 summarizes the deployment information for the Frontal Exchange Processes moorings and the Long-Term moorings of Jim Irish.
Mooring |
ID |
Date |
Time UTC |
Latitude N |
Longitude W |
Depth m |
|
East Flank Toroid |
NF |
11/17/98 |
1326 |
41° 45.903’ |
66° 05.388’ |
94 |
|
North Flank Shallow Guard |
NFS |
11/17/98 |
1931 |
42° 04.797’ |
66° 42.002’ |
72 |
|
North Flank Shallow Toroid |
NFS |
11/17/98 |
2136 |
42° 04.801’ |
66° 42.162’ |
73 |
|
North Flank Shallow SubSurf. |
NFS |
11/18/98 |
1936 |
42° 04.773’ |
66° 42.080’ |
73 |
|
North Flank Deep Toroid |
NFD |
11/19/98 |
0000 |
42° 09.835’ |
66° 42.510’ |
153 |
|
North Flank Deep ADCP |
NFD |
11/19/98 |
0647 |
42° 09.802’ |
66° 42.521’ |
149 |
|
North East Peak Guard A |
NEP |
11/19/98 |
1548 |
41° 43.947’ |
66° 32.262’ |
74 |
|
North East Peak Guard S |
NEP |
11/19/98 |
1647 |
41° 43.851’ |
66° 32.091’ |
73 |
|
North East Peak Science B |
NEP |
11/19/98 |
2027 |
41° 43.923’ |
66° 32.176’ |
73 |
Table 1. OC333 mooring deployment times and positions.
2. Long-Term Moorings on the Northeast Peak – Jim Irish
2.1 Northeast Peak – Mooring NEP
During the past year, the GLOBEC Long-Term moored program did not have moorings at the Northeast Peak site. This year, two guard buoys and an instrumented Science buoy were deployed at the previous site again. The guard buoys were steel flotation spheres with solar powered lights and radar reflector. They were moored by all chain hardware. The science mooring consisted of a steel flotation sphere with tower and solar powered data/telemetry system and light. The mooring had minimal meteorological observations, full water depth ADCP current profiles and several temperature and conductivity sensors along the mooring cable, and two bio-optical packages. The sensors, type, nominal depth and serial numbers are listed in Table 2.
|
Sensor Type |
Company |
Model |
Serial Number |
|
|
Air Temperature |
WHOI |
WHOI |
#1 |
|
|
PAR |
|
LiCor |
UWQ |
4875 |
|
Sea Surface Temperature |
Sea Bird |
SBE-3 |
32488 |
|
|
Sea Surface Conductivity |
Sea Bird |
SBE-4 |
41365 |
|
|
ADCP |
|
RDInstruments |
Workhorse |
125 |
|
Temperature at 5 m |
Sea Bird |
SBE-3 |
32064 |
|
|
Conductivity at 5 m |
Sea Bird |
SBE-4 |
41367 |
|
|
BIOPTICAL at 10 m |
Luigi |
WHOI |
2 |
|
|
|
Temperature |
Sea Bird |
SBE-3 |
30490 |
|
|
Conductivity |
Sea Bird |
SBE-4 |
42182 |
|
|
Transmissometer |
Sea Tech |
|
621 |
|
|
Fluorometer |
Sea Tech |
|
296 |
|
|
OBS |
SeaPoint |
|
1222 |
|
|
PAR |
LiCor |
SPQA |
1793 |
|
Temperature at 15 m |
Sea Bird |
SBE-3 |
32431 |
|
|
Conductivity at 15 m |
Sea Bird |
SBE-4 |
41890 |
|
|
Temp/Cond at 20 m |
SeaCat |
Sea Bird |
SBE-16 |
2360 |
|
Temp/Cond at 30 m |
SeaCat |
Sea Bird |
SBE-16 |
2359 |
|
BIOPTICAL at 40 m |
Luigi |
WHOI |
3a |
|
|
|
Temperature |
Sea Bird |
SBE-3 |
31632 |
|
|
Conductivity |
Sea Bird |
SBE-4 |
42186 |
|
|
Transmissometer |
Wet Labs |
CST |
143PR |
|
|
Fluorurometer |
Sea Tech |
|
290 |
|
|
PAR |
LiCor |
SPQA |
1661 |
|
Temperature at 50 |
Sea Bird |
SBE-3 |
32432 |
|
|
Conductivity at 50 |
Sea Bird |
SBE-4 |
41379 |
|
|
Temp/Cond at 72 m |
SeaCat |
Sea Bird |
MicroCat |
715 |
|
Acoustic Release |
EG&G |
BACS |
17306 |
|
The two guard buoys were deployed first separated by about 0.15 nm. The buoys were oriented about NW-SE to give the best alignment for the deployment of the science buoy against the currents. The science buoy was deployed last. All buoys were deployed on 19 November 1998 at the times and positions given in Table 1.
After the mooring was deployed, the acoustic release was enabled for transponding and operations check. When enabled, the release started pinging at 11 KHz (its channel B) and wouldn’t transpond at 12 kHz on its channel A. The release couldn’t be disabled also. Therefore, it was decided to wait and try again after the CTD survey when the ship would be back at the mooring site again. Therefore, on the morning of 21 November when we were back at the mooring, the acoustic release transponded on both channels and was disabled without difficulty. We believe that a fishing vessel about a mile off was using a 9 kHz pinger, which triggered the BACS release, and locked out our transponding. Therefore, the release was functioning properly and should cause no problems when the mooring is serviced in March 1999.
2.2 Real-Time Data Telemetry from the Northeast Peak Mooring
In order to support the Scotian Shelf crossover experiment, the Long-Term moored program is sending back daily via ARGOS, about half of the hourly averaged data collected by the science buoy. Each message includes the year day, the UTC hour as well as the data from the temperature and conductivity sensors. An example of the data received aboard ship which will be served up on the WWW, is shown in Table 3 from the first complete hour of the mooring in the water. This was then decoded and normalized to provide geophysical quantities. The normalized values derived from the data shown in Table M3 are given below with some explanation.
Table 3 - ARGUS UPLINK Received Data
11-19-98 16:57:16 ID 12778 NA
000 017 000 021 000 069 018 139
013 081 011 106 014 111 023 049
016 246 026 084 013 158 012 235
050 058 050 076 004 228 004 136
This decodes to :
Year Day = 323
UTC Hour = 21
PAR = 85.2 microEinsteines/m2/s
T1 = 9.183º C (temperature at 1 meter depth)
T2 = 32.204 PSU (salinity from temperature and conductivity at 1 m depth)
T5 = 9.185º C (temperature at 5 meters depth)
S5 = 32.210 PSU (salinity from temperature and conductivity at 5 m depth)
T15 = 9.181º C (temperature at 15 meters depth)
S15 = 32.211 PSU (salinity from temperature and conductivity at 15 m depth)
T50 = 9.178º C (temperature at 50 meters depth)
S50 = 32.218 PSU (salinity from temperature and conductivity at 50 m depth)
AT = 7.16º C (Air Temperature at ~3 m elevation)
BAT#1 = 12.858 volts (Battery #1 hourly averaged voltage)
BAT#2 = 12.876 volts (Battery #2 hourly averaged voltage)
Status = 1252 System Temperature = 10 to 22º C
No Forward / Reflected Power Errors
GOES Power out = 46 to 48 db
After Transmission Battery Voltage = 12.0 to 12.5
Battery Voltage just after GOES Transmission = 11.60 volts
For comparison with the moored data, CTD 31 was taken near the Northeast Peak mooring at the end of the moored hourly average (2131 UTC). It also showed a nearly uniform temperature profile (from 9.15º C at the surface to 9.16º C near the bottom). Therefore, although our temperature results are averaged over different time intervals, they are comparable to within 0.02º C. The CTD salinity profile is a uniform 32.217 PSU top to bottom and agrees to within 0.01 PSU with the moored salinity values. Therefore, the data telemetered by the moored system can be believed and can be used to detect lower temperature and salinity Scotian shelf water crossover events.
3. HYDROGRAPHY – Richard Limeburner
Standard CTD data was collected during Oceanus 333 with a Sea Bird Electronics SBE-911 profiling CTD measuring pressure, conductivity, temperature, light transmission, fluorescence, turbidity and irradiance. At least one seawater sample was collected at each station for calibration of the conductivity sensor on the SBE-911 CTD. Figure 5 summarizes the comparison between the conductivity measured by the CTD and the in situ conductivity calculated from the water sample bottle salinity using a Guildline Salinometer. The RMS conductivity difference was 0.0028 ms/m and this offset was not applied to the data.
3.2 Hydrographic Station Locations
A total of 50 CTD stations were completed during the cruise along five sections radiating outward from the center of the eastern flank of Georges Bank. The locations of the CTD stations are shown in Figure 6.
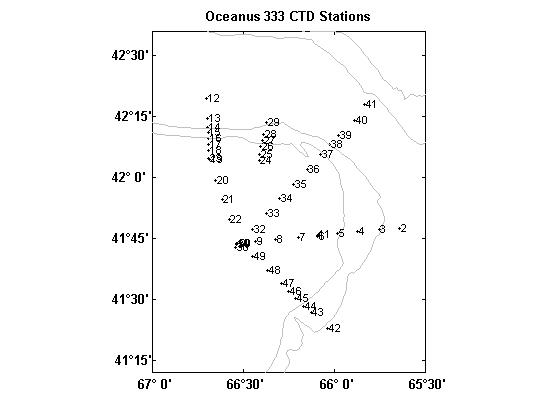
Figure 6. CTD station locations during OC333.
3.3 Surface Temperature and Salinity and Profiles
Near-surface (depth 4 m) temperature and salinity over the eastern flank of Georges Bank during OC333 are shown in Figure 7.


Figure 7. Surface temperature and salinity.
Richard
Limeburner, Chief Scientist
Charles Flagg, Scientist
James Irish, Scientist
Alberto Scotti, Scientist
Wil Ostrom, Senior
Engineer
Craig Marquette, Senior Engineer
Jeff Lord, Engineer
James Doutt, Engineer
Robert Handy, Engineer
Judith Wells, Student
Lawence Bearse, Captain
Courtney Barber, Chief Mate
EST
1000 – Depart WHOI dock to adjust ship’s compass off Nobska
1100 – Safety meeting
1200 – Drop off Compass adjuster is small boat
1300 – Boat drill
Monday – November 16, 1998
EST
1330 – Arrive at mooring location EF, made a bottom survey
1430 - Decided to postpone deployment until the next day due to
rough seas
1505 – CTD 1 at EF
1745 – CTD 2 – Begin east section CTD line
1900 – CTD 3
1956 – CTD 4
2048 – CTD 5
2139 – CTD 6
2232 – CTD 7
2332 – CTD 8
Tuesday – November 17, 1998
EST
0023 – CTD 9
0112 – CTD 10 at mooring site NEP, end east section CTD line
0330 – Arrived at mooring EF location
0500 – Began preparation for deployment
0826 – Deployed EF mooring, ranged on release
0950 – CTD 11 at mooring EF
1431 – Deployed NFS guard buoy
1636 – Deployed NFS toroid buoy
1918 – CTD 12 – Begin north section CTD line
2022 – CTD 13
2113 – CTD 14
2155 – CTD 15
2238 – CTD 16
2317 – CTD 17
2354 – CTD 18
Wednesday – November 18, 1998
EST
0025 – CTD 19
0112 – CTD 20
0155 – CTD 21
0238 – CTD 22 – End north section CTD line
0500-1300 – Preparing NFS subsurface deployment
1436 – Deployed NSF subsurface mooring
1533 – CTD 23 at NFS site
1610 – Surveyed NFD bathymetry
1900 – Deployed NFD toroid mooring
2139 – CTD 24, start NNE CTD line
2201 – CTD 25
2227 – CTD 26
2304 – CTD 27
2336 – CTD 28
Thursday – November 19, 1998
EST
0024 – CTD 29, end NNE CTD line
0500 – Prepared to deploy C. Flagg’s ADCP at NFD site
0646 – NFD ADCP deployed
0700 – Steaming toward NEP mooring site
1047 – NEP guard deployed
1147 – NEP guard deployed
1527 – NEP Science mooring deployed
1603 – CTD 30
1632 – CTD 31
1727 – CTD 32
1816 – CTD 33
1900 – CTD 34
1942 – CTD 35
2024 – CTD 36
2104 – CTD 37
2145 – CTD 38
2218 – CTD 39
2306 – CTD 40
2352 – CTD 41
Friday – November 20, 1998
EST
0453 – CTD 42
0606 – CTD 43
0640 – CTD 44
0720 – CTD 45
0753 – CTD 46
0824 – CTD 47
0906 – CTD 48
0956 – CTD 49
1004 – CTD 50, NEP mooring
1030 – Ranged on NEP releases
1045 – Steaming to Cape Cad Bay
Saturday – November 21, 1998
EST
0600 – Recovered Cape Cod Bay mooring
1207 – Tied up at WHOI dock
Appendix 1. Mooring schematics
Appendix 2. CTD Station Profile Data