Acknowledgments
We thank the Crew of R/V Oceanus for their professionalism and friendly support. Their cooperation and assistance made the success of this cruise possible.
This cruise was sponsored by the National Science Foundation and the National Oceanographic and Atmospheric Administration. The cruise report was prepared by Maureen Taylor, John Sibunka, David Mountain, James Pierson, Annette Brickley, Rebecca Jones, Stephen Brownell, Jennifer Crain, and with the assistance of other members of the Science Party.
TABLE OF CONTENTS
Purpose of the Cruise 1
Cruise Narrative 2
Individual Reports
Hydrography 7
Zooplankton and Ichthyoplankton Studied based on Bongo and MOCNESS tows 13
Preliminary Summary of Zooplankton Findings 16
Preliminary Summary of Ichthyoplankton Findings 21
Preliminary Summary of the 10-m2 MOCNESS Samples 25
Observations of Zooplankton Collected 26
Nutrients and Phytoplankton Studies 27
Microzooplankton Studies 35
Gelatinous Zooplankton Sampling 36
Collections for Genetic Studies 36 Drifter Deployments 37
Shipboard ADCP (Acoustic Doppler Current Profiler) measurements 37
Personnel List
Scientific 39
R/V OCEANUS Crew 39
Appendix 1. OC336 station event log 40
Appendix 2. CTD plots and compressed listing of the data 52
Purpose of the Cruise
Six broad-scale surveys are part of the 1999 U.S. GLOBEC Georges Bank Program. The broad-scale surveys are conducted monthly from January to June to monitor the changing biological and physical status in the Georges Bank ecosystem. The principle objectives of the cruise are:
(1) Determine the distribution and abundance of the ichthyoplankton and zooplankton community on the Bank and in adjacent Gulf of Maine and slope waters. Emphasis was on target fish (eggs, larval and juvenile cod and haddock) and copepod species (all stages of Calanus finmarchicus and Pseudocalanus sp.) and their predators and prey.
(2) Provide systematic collections of larval and juvenile cod and haddock for age and growth estimates.
(3) Collect individuals of Calanus and the euphausiid, Meganyctiphanes norvegica, for population genetics studies.
(4) Conduct lipid biochemical and morphological studies of Calanus finmarchicus.
(5) Collect larger gelatinous predators.
(6) Conduct a hydrographic survey of the Bank.
(7) Collect chlorophyll and nutrient data to characterize the potential for primary production and to calibrate the fluorometer on the CTD.
(8) Map the Bank wide velocity field using an Acoustic Doppler Current Profiler (ADCP).
(9) Deploy drifting buoys to make Lagrangian measurements of the currents.
In order to obtain uniform bank-wide coverage, 41 predetermined "standard" stations and "intermediate bongo" stations were scheduled for this survey. During this cruise all 41 standard stations were occupied (plus repeat coverage at 5 stations) and 38 bongo stations were completed (Figure 1).
The 41 standard stations were assigned a priority code number (from 1-4) which reflected the equipment used on a given station. Priority stations assigned code 1 or 2 were "full stations" with "high priority," and stations assigned code 3 or 4 were "partial stations" and designated "low priority." The intermediate bongo stations were considered to have a lower priority than the 41 standard stations.
Survey operations were a combination of both underway and station activities. The ship's ADCP systems (broadband and narrow band) were used to make continuous measurements of the water current profile under the ship, in order to construct the current field over the whole Bank. This data will be used to help in the interpretation of all the other observations made on the cruise. Navigation information, meteorological data, and sea surface temperature and salinity were recorded by the vessel's computer system.
At full stations an oblique plankton tow from surface to near bottom was made with a bongo sampler along with a real-time CTD (Profiler) attached to the towing wire. A large volume zooplankton pumping system was use to sample the water column. A Seabird 911 CTD-rosette package was used to characterize the physical conditions of the water column. Rosette water samples were taken at selected depths for biological and chemical analysis. Water was also drawn for microzooplankton analysis, conductivity cell calibration and H218O/H216O isotope concentration analysis. A 1-m2 MOCNESS (Multiple Opening Closing Net Environmental Sampling System) was towed obliquely from surface to near bottom cycling twice to make vertically stratified collections of zooplankton with both 335 µm mesh and 150 µm mesh nets, and to make collections of fish larvae with 335 µm mesh nets. A 10-m2 MOCNESS fitted with 3.0-mm mesh nets was towed obliquely from surface to near bottom to make vertically stratified collections of larger predators on target species. A 1.5-m2 Jelnet fitted with a 5-mm mesh net was towed vertically to collect fragile gelatinous zooplankton at priority #1 stations.
At partial stations, a bongo tow, a Seabird 911 CTD cast, and 1-m2 MOCNESS tow were made. At the intermediate bongo stations, a bongo sampler and real-time CTD (Seacat Profiler) were towed obliquely from surface to near bottom. At selected stations, a calibration cast for the Seacat Profiler was performed (Niskin bottle attached above Profiler). A summary of sampling events that occurred during this cruise is in Appendix 1.
Cruise Narrative
In this section, the station numbers refer to the "standard" station (rather than the consecutive station) and references to times are local.
11 February
The safety meeting and boat drill began at 08:45 led by Chief Mate Courtenay Barber. After some last minute scrambling to make sure that everything and everyone was ready to go, we were underway at 09:45 under beautiful sunny skies and light winds. A brief science meeting was conducted after lunch to introduce new faces, review station protocols, and to discuss any additional sampling requests. ETA for the first station is approximately 18:00. The science party spent the afternoon making sure gear was secured properly, viewing a new UNOLS safety video, and resting before formal operations begin. We arrived at station 1 at 17:45. All operations went very smoothly. A missing printer driver for the MOCNESS computer was supplied by SSSG Technician Laura Goepfert. Stations 1,2 and the intermediate bongos were completed by midnight.
12 February
At the first full station (3), a leaking gasket seal for the plankton pump was replaced with the assistance of the engineering department. The first MOC-10 deployment went well under the direction of Boatswain Jeff Stolp. Skies have turned grey and the wind has started to increase but conditions are still relatively comfortable. Stations 4,5,6 and intermediates were completed without any noteworthy problems. Both watches have fallen into an "efficient groove" of operations, working and communicating well with both the winch operators and the Bridge. Our volunteers (Mark Curtis, Brian Moravec and Jim Watkins) have been eager to learn and help with all levels of operation.
13 February
At station 7, the CTD (SB911+) failed at 50 meters. The MOC-1 was performed to allow time to investigate the CTD problem and to keep the Ship working. The problem was traced (by David Nelson) to a home-made dummy plug that was not water proof and as a result, caused a short. CTD #8 was successfully completed after the MOC-1. The MOC-10 was canceled due to the sea state and since the weather in not expected to improve during the next 24 hours. At station 9, only two moorings were sighted (three were expected). After the bongo was completed, we broke off operations briefly to survey the area for the third buoy. It was found on radar but its light was not functioning. Operations resumed at 19:45. The sea state has calmed (wave height approximately 8 ft.) but the temperature is much colder. Station 9 was completed by midnight.
14 February
All operations continue to run smoothly. Stations 10 - 15 along with the intermediate bongo stations and the first drifter deployment have been completed. Neile Mottola has become sick with a probable sinus infection and has been excused from standing a watch. The Captain will consult a shore-side Doctor in the morning if still necessary. Earlier today, Neile treated the entire ship to personalized Valentines Day cards. She was going to give out "scratch -n- sniff" Harley Davidson tail pipes but decided against this since such an aroma would probably send too many scientists running for the rail.....wise decision Neile. David Nelson tightened the MOC-1 frame and adjusted the net response after noticing that the net bars had loosened with use. To be safe, we examined all gear on deck (CTD and MOCNESS systems) for any loose nuts and bolts.
15 February
After plankton pump sampling was completed at our deepest station (16), the hose became fouled in the ship's screw as it was being pumped with air during recovery. The noise as the pump hose was chewed up by the prop was sufficient to awaken many of the off watch scientists and crew. A total of 90 meters of pump hose was lost. After thorough testing, the engineers and Captain concluded that no more hose was fouled in the prop and that the ship's propulsion system seemed to be o.k. Unfortunately, the sea cable was kinked where the pump intake clamps were torn off. Laura was woken up to cut the sea cable above the kink, re-pour and re-splice the termination. The night watch reviewed the event log while the sea cable repair was made. Pumping operations are on hold until a transfer of new hose can be arranged. A 400 mile round trip steam to Provincetown ( in 12 ft seas) is not feasible at this time in the survey because it would put us at risk of not being able to complete the Bank-wide survey and of impacting other operations (i.e. canceled MOCNESS operations). Ted Durbin is investigating other options from back onshore. Stations completed: 17, 18, 19 and intermediate bongos.
16 February
We were notified that arrangements have been made to send a Coast Guard helicopter out to us in order to transfer new pump hose and halyard clips (which will be used to keep the hose tethered to the sea cable). The rendevous is scheduled for tomorrow west of the Hague line (near station 32). Our cruise track was re-plotted to accommodate this schedule. The plan is to occupy the priority 3 and 4 stations (which will not have to be re-occupied since there are no pumps scheduled at these stations) and to conduct MOC-10 hauls at the higher priority stations to get these done while the weather is favorable. After the Coast Guard transfer, we will return to all stations where a pump haul was previously skipped (stations 17, 18, 20, and 23). A CTD cast and MOC-1 haul (single "V" with nets 0 - 4 fished) will also be repeated to allow for a consistent time series of both biological and physical information. The intended station sequence is: 20, 21, 22, 23, 24, 39 (just MOC-10), 26, 28, 31, and then break off to meet the Coast Guard Helicopter at or near station 32. Intermediate bongo hauls will be conducted at the mid-points of the revised station sequence. The MOC-10 at station 39 was completed by 23:00. Pump samples from station 16 were accidentally sieved through the wrong mesh during alcohol changes. Station 16 will be added to the "re-peat" station list.
17 February
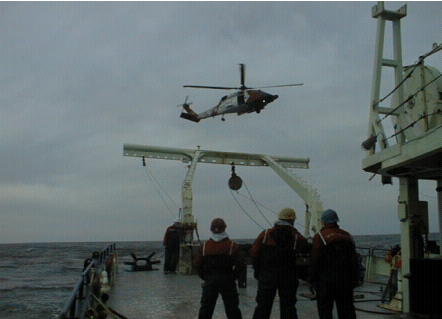
Operations at station 31 were completed at 10:00. We broke off station operations to steam for a pre-arranged position with the Coast Guard (approximately 4 miles from station 32). The Captain allowed the scientists to watch and to take pictures from forward of the wheel house. At 14:00, a Jay Hawk Coast Guard helicopter hovered over the fantail as the R/V Oceanus steamed ahead at 10 knots (Figure 1b). Courtenay Barber, Jeff Stolp, Jim Ryder, Horace Medeiros, and Laura Goepfert were positioned on the fantail to secure the lowered packages. Captain Bearse and 2nd Mate Diego Mello were on the Bridge. The transfer went extremely well with much deserved credit going to both the crew of the U.S. Coast Guard helicopter and the R/V Oceanus. A total of 120 meters of pump hose and 15 brass halyard clips were safely transferred. We arrived at station 32 shortly after 15:00. After station 32, we steamed (approximately 5 hours) to revisit stations in the following order: 18,17,16,20, and 23. "Normal" station activities will resume at station 39. Previously canceled MOC-10 hauls (due to weather) will also be re-attempted at the re-visited stations.
18 February
Repeat stations 18, 17 and 16 were completed by 10:00. MOC-10 hauls were made at stations 18 and 17. Fire and life boat drills in which the science party were asked to take an active role in were carried out at 10:15. Annette Brickley and Brian Moravec (both having EMT training) led a very informative hands-on training session of how to handle and secure a person with a possible neck or back injury. Rebecca Jones volunteered to be strapped into one of the lifting baskets that the R/V Oceanus has onboard. Winds have again increased to over 20 knots with rain showers. The seas are 10 feet but conditions are still workable. Net #4 of the MOC-1 had to be replaced after station 20 because it was ripped at the seams. Station activities at station 23 were completed by midnight and without any problems.
19 February
At station 39 the MOC-1 was aborted and had to be repeated because we were not getting any net responses. Upon recovery, net #4 was ripped (again) and two cod-end buckets were lost. No definitive explanation for why this happened was discovered. After replacing the lost cod-end buckets and the torn net, the MOC-1 was successfully repeated. We arrived at station 25 at 10:00. MOC-10 signal was lost at the bottom of the haul which was then aborted. As the MOC-10 broke the surface upon recovery, Boatswain Jeff Stolp noticed that one of the stainless "U" bolts (to which the bridle attaches) was sheared wide open. Under Jeff's direction, the MOC-10 was safely brought back on board. The middle (unused) "U" bolt was not a suitable replacement because there was evidence that it had previously been heated and we did not want to trust the one that had carried the entire strain during the recovery. As a result, we will not be able to "safely" deploy the MOC-10 for the remainder of the survey. All three "U" bolts should be replaced and if possible at least two spares should be available for subsequent cruises. The Jelnet will be deployed (weather permitting) at the remaining priority 1 and 2 stations to provide some information to the predation group. Station 27 and the intermediate bongos were completed by the change of the watch at midnight. The halyard clips that were sent out via CG helicopter have all broken. Six stainless snap shackles (which have a much greater breaking strength than the brass clips) were taken off the spare Seacat Profilers and will be used during the remaining pump hauls.
20 February
The intermediate bongo haul between station 27 and 29 had to be repeated because one of the nets had untied. Station 29 operations were completed by 08:00. We worked our way slowly (4- 6 knots) toward station 30 to allow Jennifer Crain to work with zooplankton samples under a microscope. Weather continues to deteriorate (winds 25 - 30 knots with snow squalls). The forecast calls for winds to gust over 40 knots by this afternoon. Working conditions were marginal when we arrived at station 40 at 19:15. We decided to go ahead and deploy the bongo in order to assess wether or not we felt comfortable to safely deploy and recover both the CTD and MOC-1. The Captain was able to put our deployment point in the lee and all went well. The Jelnet was canceled because we did not believe that the frame could withstand the surge caused by the present sea state.
21 February
At station 33 signal to both the CTD and MOC-1 failed. David Nelson traced the problem to a broken conductor in the sea cable splice. After swapping the bad conductor out with another and replacing a blown fuse in the CTD deck box, station operations were repeated without problems.
We arrived at station 34 at 09:00. The Jelnet frame folded during recovery although winds and seas were relatively calm. Net #4 of the MOC-1 ripped along the top seam during the haul and was repaired by Neile Mottola. We have not been able to discover why net #4 has been especially susceptible to damage during this cruise. We completed station 37 by midnight. The weather has begun to deteriorate again with occasional snow showers.
22 February
We arrived at our last station (38) at 01:50. All operations were completed by 07:00 (except for the Jelnet and MOC-10) including the final two drifters and live-tows for Scott Gallagher and Ted Durbin. The weather quickly deteriorated as we worked to secure the deck for our anticipated very rough ride home. Winds gusted to 50 knots and seas were occasionally over 20 feet. The scientists worked on cruise reports, cleaned the labs and staterooms and caught up on some much needed rest enroute to Woods Hole.
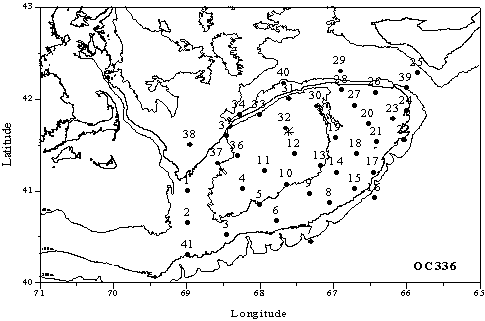
Figure 1. (A) Standard stations occupied during the February 1999 Broadscale survey OC336,
X = U.S. Coast Guard helicopter drop location. Photo (B) courtesy of Laura
Goepfert.
Individual Reports
Hydrography
(Maureen Taylor and David Mountain)
The primary hydrographic data presented here were collected with Seabird CTD systems. The Seabird 911+ CTD (SBE911+) provides measurements of pressure, temperature, conductivity, and fluorescence and records at a rate of 24 observations per second. This CTD is equipped with a rosette (Seabird 32 carousel) for collecting water samples at selected depths. Profiles with the SBE911+ were obtained at each standard station. Bongo hauls were made at all of the stations occupied. A Seabird model 19 profiling CTD (SBE19 Profiler) was used on each bongo tow to provide depth information during the tow. Pressure, temperature, and salinity observations are recorded twice per second by the Profiler. The following is a list of the CTD data collected with each of the sampling systems used on the cruise:
Instrument # casts
SBE911+ 46
SBE911+ calibration 45
SBE19/ Bongo 79
SBE19/ calibration 10
The SBE911+ was deployed with 10 bottles on the rosette and samples were collected for various investigators. At priority 1 and 2 stations, 400 mls were immediately siphoned out of two niskins (bottom and mid-depth) for observations of micro-zooplankton swimming behavior (S. Gallagher, WHOI). Samples were collected for oxygen isotope analysis at selected depths (R. Houghton, LEDO) and a sample was taken at the bottom for calibrating the instrument's conductivity data (D. Mountain, NMFS). Samples for chlorophyll and nutrient analysis were taken from multiple depths at each of the standard stations (D. Townsend, Univ. of Maine).
Parameter # samples
oxygen isotope 147
Species composition 18
Preliminary processing of the SBE Profiler and 911 data was completed at sea using the Seabird manufactured software routines to produce 1 decibar averaged ASCII files.
On standard station 33, the termination on the conducting wire suffered a slow failure due to a nick in the insulation around the conduction leads where they emerged from the termination housing. The down cast of the SBE911+ cast was completed, but the rosette bottles were not able to be fired. A repeat of the cast was able to fire bottles at the bottom of the cast before the failure reoccurred. To obtain water samples for nutrient and chlorophyll analysis, two Niskin bottles were hung on the wire and tripped at 2 and 20m depth.
Results:
Using the data from the SBE911+, the surface and bottom temperature and salinity distributions are shown in figure 2. Temperature and salinity anomalies (using the MARMAP reference) are shown in figure 3. The distribution of fluorescence (expressed in volts) are shown in figure 4 (left). Stratification over the upper 30 meters of the water column and the stratification anomalies relative to the MARMAP hydrographic data reference, were calculated. These distributions, expressed in sigma-t units, are shown in figure 4 (right).
The volume average temperature and salinity of the upper 30 meters were calculated for the four sub-regions shown in figure 5. These values are compared with characteristic values that have been calculated from the MARMAP data set for the same areas and calendar days. The volume of Georges Bank water (salinity < 34 psu) was also calculated and compared against the MARMAP values. The SBE911+ profiles for each standard station, along with a compressed listing of the preliminary data, are provided in Appendix II.
The surface salinity distribution (figure 2) indicates the intrusion of low salinity water from the Scotian Shelf onto the eastern end of Georges Bank. The influence of the Scotian Shelf water probably extends west and southwest to the 32.50 PSU contour in the figure. The surface temperature distribution indicates that this water was also somewhat colder then the rest of the Bank, as would be expected. The Scotian Shelf water is not evident in the bottom parameter distributions (figure 2). However, an encroachment of warmer, more saline Slope Water on to the southern flank of the Bank is evident in the bottom values at standard stations 8, 9 and 15.
The anomaly distributions (figure 3) , as well as the values in figure 5, show that the Bank was fresher and warmer than the MARMAP reference. The -0.7 PSU in the NW portion of the Bank (figure 5) is comparable to the anomalies calculated in 1997 and1998, and indicated a continuation of the low salinity conditions reported in the previous years. Temperature anomaly of about +1 C is also comparable to those in 1997 and 1998, and suggest that, away from the area of direct Scotian Shelf influence, the temperature conditions probably are determined more by local heat flux conditions than the result of a large scale advective process, as believed true for the salinity values.
The only significant stratification (figure 4) was associated with the intrusion of Scotian Shelf water on the eastern part of the Bank. The fluorescence values (figure 4) of 0.3 - 0.4 volts are comparable to those observed in 1998, but significantly lower than values observed in February 1995 and 1996.
figure 2
figure 3
figure 4
figure 5
Zooplankton and Ichthyoplankton studies based on Bongo and MOCNESS tows.
(John Sibunka, James Pierson, Neile Mottola, Joshua Fredrickson, Stephen Brownell, Rebecca Jones, Jesse Lamb and Ryan Campbell)
Objectives:
(1) Principle objectives of the ichthyoplankton group in the broad-scale part of the U.S. GLOBEC Georges Bank Program were to study the composition of the larval fish community on Georges Bank, to define larval fish distribution across the Bank and within the water column, to determine those factors which influence their vertical distribution, and to determine bank-wide versus "Patch-Study" mortality and growth rates. Emphasis in this study is on cod and haddock larvae along with their predators and prey. This study also includes larval distribution and abundance, and age and growth determination. These objectives were implemented through use of bongo net and 1-m2 MOCNESS to make the zooplankton and ichthyoplankton collections. A 10-m2 MOCNESS was used to collect larger pelagic invertebrates and juvenile fish.
(2) The primary objective of the zooplankton group was to complete a bank-wide survey of Georges Bank to determine the distribution, abundance, and stage composition of the target species Calanus finmarchicus and Pseudocalanus spp. A second objective was to identify, quantify, and describe the occurrence of abundant non-target species in order to provide a description of the environment occupied by the target species. These objectives were implemented by using the 1-m2 MOCNESS for sampling copepods and larger zooplankton. A 1.5-m2 Jelnet cast was made to collect gelatinous predators and a submersible pump was deployed for sampling the small copepod naupliar stages.
In addition to these objectives, the zooplankton group was responsible for obtaining
subsamples from the 1-m2 MOCNESS hauls for population genetic studies of Pseudocalanus spp. to be completed by Dr. A. Bucklin at the University of New Hampshire.
Methods:
Bongo tows were made with a 0.61-m frame fitted with paired 335 µm mesh nets. A 45 kg ball was attached beneath the bongo frame to depress the sampler. Digital flow meters were suspended in the mouth of each net to determine the volume of water filtered. Tows were made according to standard MARMAP procedures, (i.e., oblique from surface to within five meters of bottom or to a maximum depth of 200 m while maintaining a constant wire angle throughout the tow). Wire payout and retrieval rates were 50 m/min and 20 m/min respectively. These rates were reduced in shallow water (<60 m) to obtain a minimum of a five minute tow or reduced due to adverse weather and sea conditions. A Seabird profiler CTD was attached to the towing wire above the frame to monitor sampling depth in real time mode and to measure and record temperature and salinity. Once back on board, the 335 µm mesh nets were rinsed with seawater into a 330 µm mesh sieve. The contents of one sieve were preserved in 5% formalin and kept for ichthyoplankton species composition, abundance and distribution. The other sample was preserved in 95% ethanol and kept for age and growth analysis of larval fish. The same preservation procedure was followed as for the 1-m2 MOCNESS.
The 1-m2 MOCNESS sampler was loaded with ten nets. Nets 1-4 were fitted with 150 µm mesh for the collection of older and larger copepodite and adult stages of the zooplankton. Nets 0, and 5-9 were fitted with 335 µm mesh for zooplankton (nets 0 and 5) and ichthyoplankton (nets 6-9) collection. Tows were double oblique from the surface to within 5 m from the bottom. The maximum tow depth for nets 0, 1 and 5 was 484 m, and for net 6 was 200 m (if net 5 was sampled deeper than 200 m, it was returned up to 200 m and closed). Winch rates for nets 0-5 were 15 m/min and for nets 6-9, 10 m/min. The depth strata sampled were 0-15 m, 15-40 m, 40-100 m, and >100 m. The first (#0) and sixth (#5) nets were integrated hauls. For shallow stations, with only 2 or 3 of the depth strata, not all nets were fished. The contents of nets 0-4 were sieved through 150 µm mesh sieve, subsampled using a 2-L plankton sample splitter if the final biomass volume was too large for one quart jar, and then preserved in 10% formalin. Samples from nets 5-9 were sieved through 330 µm mesh sieve and preserved in 95% ethanol. After 24 h of initial preservation, the alcohol was changed. The used ethanol was retained for disposal or recycling ashore. At priority 1 and 2 stations and at station 40, 100-ml subsamples from the bottom and surface 150 µm mesh nets were removed and preserved in 10% formalin for Dr. C. Miller (OSU). At priority 1 and 2 stations, 100-ml subsamples from nets 2, 3, and 4 were removed and preserved in 95% ethanol. These samples were collected for Dr. A. Bucklin for population genetic studies to distinguish the Pseudocalanus species found on Georges Bank. Subsamples were also taken at selected stations for genetic studies on the predators of Psuedocalanus spp. and Calanus finmarchicus. These samples were fractionated from net 5 and preserved in 5% formalin.
At those stations reoccupied in order to obtain pump samples, the 1-m2 MOCNESS sampler was retowed. The sampler was only cycled once; whereby only nets 0 to four were fished. Standard sampling protocol was followed for these tows.
The 10-m2 MOCNESS was loaded with five 3.0 mm mesh nets. Tows were oblique from surface to ~10 m from bottom or a maximum depth of 500 m. The same depth strata were sampled as with the 1-m2 MOCNESS. The winch rate for retrieval varied between 5 and 20 m/min depending on the depth stratum. The slow winch rates were used in order to filter at least 4,000-5,000 m3 of water per depth stratum sampled. A stepped oblique tow profile during retrieval was used to achieve this, if needed. Catches were sieved through a 330 µm mesh, and preserved in 10% formalin.
A gasoline powered diaphragm pump was used to collect nauplii and younger, smaller copepodite stages of zooplankton. The intake hose was deployed off the starboard side hydro boom by connecting the suction end, fitted with a Niskin clamps, to the winch wire. The boom winch meter block was zeroed at the surface and the wire out reading was used to determine the depth of the cast. A 70 kg weight was used to depress the array. Three or four 30 m sections of 7 cm diameter hose were connected to the pump, allowing the intake hose to attain a maximum depth of approximately 100 m. At shallow stations (<100 m), the intake nozzle was lowered to 3-5 meters off the bottom. The discharge end of the hose was diverted to a surge dampener before it entered the collection net. This caused the flow to be laminar as it passed the flow meter, allowing a more accurate measurement of flow rate. Once the hose had been deployed to the desired depth it was raised at a constant rate and samples collected. Wire retrieval rate was approximately 4 m/min which provided volumes of about 200 L per 5 m depth interval. Sampling depths were from the maximum depth to 75 m, 75-40 m, 40-15 m, and 15 m to the surface. We allowed the hose to flush for a predetermined interval before collection began, before each net change, and once the hose had reached the surface. Flushing time was calculated based on the flow rate of the pump and depending on the length of hose used at each station. The three integrated depth samples were collected with 30 µm mesh nets, sieved through a 30 µm mesh sieve and preserved in 10% formalin.
At station 16 a mishap occurred in which the pump hose fouled on the ship and nearly 100 m of hose was lost. Replacement hose was brought out to us via a U. S. Coast Guard helicopter. Subsequent pump operations were done using the same protocol with two exceptions. Snap clips attached to the hose at 10 m intervals were clipped to the winch wire as the hose was deployed. This assured that the hose was no more than 5 m from the wire and kept it from getting fouled on the ship. This arrangement also allowed the hose to move vertically along the winch wire as it was retrieved. The intake configuration was also changed. Instead of using Niskin clamps we affixed a release shackle to the end of the hose and clipped it to the weight used to depress the array. A book clamp was positioned on the winch wire just above the end termination to keep the hose from falling down on the termination as the wire was raised during retrieval. Stations 16, 17, 18, 20, 23, and 39 were reoccupied for pump samples.
Collection of live zooplankton:
To collect live specimens of zooplankton, an additional bongo tow without the Seabird profiler was made at standard station 38. The cast was made to ~30 m and held at depth for three minutes. Wire payout was ~25 m/min and the retrieval rate was 20 m/min. Vessel speed was ~1.5 kts. Codends buckets were used on the bongo nets.
The zooplankton collected were allowed to settle for several minutes. The top portion of the zooplankton, mostly Centropages typicus and Metridia lucens were gently released into 30-gallon plastic cans previously filled with seawater using the diaphragm pump system. These animals were to be used by Dr. William Macy III at the University of Rhode Island for ongoing herring feeding experiments. The settled part of the collection, mostly the pteropod Limacina retroversa were also released into similar 30-gallon containers and returned to Woods Hole to be used by Dr. Scott Gallager for both rearing and behavior experiments.
Samples Collected by the Zooplankton and Ichthyoplankton Groups:
Gear Tows Number of Samples
1. Bongo nets, 0.61-m 79 tows 80 preserved, 5% formalin
335-µm mesh 80 preserved, EtOH
2. MOCNESS, 1-m2 46 tows
150-µm mesh(Nets 1-4) 141 preserved, 10% formalin
335-µm mesh(Net 0) 46 preserved, 10% formalin
335-µm mesh(Nets 5-9) 170 preserved, EtOH
3. MOCNESS, 10-m2 10 tows
3.0-mm mesh 41 preserved, 10% formalin
4. Pump 19 profiles
35-µm mesh 62 preserved, 10% formalin
5. Jelnet 10 tows
1.5-mm mesh 6 preserved, 10% formalin
Samples collected for Predator DNA Gut Content (Submitted by Annette Frese):
Plankton samples were requested for use in the design of a molecular assay for the detection of the copepods Calanus and Pseudocalanus in predator gut contents. DNA probes for Calanus and Pseudocalanus will eventually be applied to the gut contents of Calanus and Pseudocalanus predators. Proper preservation of the plankton samples containing the predators is necessary for the success of the assay.
To determine how samples initially preserved in formalin and in ethanol would work in the assay, one plankton sample preserved in ethanol and one plankton sample preserved in buffered formalin obtained from 5 sites were requested. The samples did not need to be quantitative, and it did not matter from what depth the samples were collected. They should have been collected in an area where Calanus and Pseudocalanus are present. Because of a leak in an alcohol drum during the cruise, no ethanol-preserved samples were obtained, and formalin preserved samples were not transferred into ethanol.
Preliminary Zooplankton Summary
James Pierson, Neile Mottola, Joshua Fredrickson, Ryan Campbell, Jesse Lamb, Jennifer Crain
Preliminary observations were made from the samples collected in the 1-m2 MOCNESS. Observations were made from the net 0 samples at priority 1 and 2 stations.
Overall: Calanus finmarchicus and Psuedocalanus spp. seem to be most abundant on the northern edge of the bank and on the crest (within the 60 m isobath). Metridia lucens was found throughout most of the survey area as was Centropages spp. and Oithona spp. Phytoplankton, especially Coscinodiscus spp. and Phaeocystis spp., was extremely abundant within the 100 m isobath, and most concentrated on the crest of the bank.
Station 3: Mostly copepodites of Centropages spp. and Metridia spp., with some Psuedocalanus spp., Acartia spp., Oithona spp. and cheatognaths.
Station 4: Mostly Centropages typicus females and copepodites of Centropages spp. and Temora longeremis, with some Psuedocalanus spp. and Oithona spp. copepodites, hydroids, and cheatognaths.
Station 7: Mostly Calanus finmarchicus copepodites, males, and females, Metridia lucens females, and copepodites of Calanus hyperboreus, Eucheata spp., and Metridia spp., with some Oithona spp. copepodites, molts of many species, and mixed oceanic and slopewater species.
Station 9: Mostly C. finmarchicus C5s and females, Psuedocalanus spp. females and copepodites, Oithona spinorostris females, Centropages typicus females and copepodites, and Metridia spp. copepodites, with some amphipods, polycheates, pteropods, and cheatognaths.
Station 12: Mostly Centropages spp. copepodites, cheatognaths, hydroids, with some Metridia lucens females and copepodites.
Station 13: Mostly Centropages spp. copepodites, hydroids, cheatognaths, with some Metridia lucens females and copepodites.
Station 16: Mostly C. finmarchicus C4s, C5s and females, Metridia lucens females and copepodites, and cheatognaths, with some large decapods, Oithona spp. copepodites, molts of many copepod species, and a number of oceanic and slopewater copepod species.
Station 17: Mostly phytoplankton (especially Coscinodiscus spp.), C. finmarchicus females and copepodites, Metridia spp. copepodites, with some Psuedocalanus spp. females, Oithona spp. copepodites, and Centropages typicus females and copepodites.
Station 18: Mostly phytoplankton, and all stages of C. finmarchicus, Psuedocalanus spp., Centropages typicus, Oithona spp., and Metridia lucens, with some amphipods and pteropods.
Station 20: Mostly phytoplankton, and all stages of C. finmarchicus, Psuedocalanus spp., Centropages typicus, Oithona spp., and Metridia lucens, with some amphipods, pteropods, and fish eggs.
Station 23: Mostly phytoplankton, and all stages of C. finmarchicus, Psuedocalanus spp., Centropages typicus, Oithona spp., and Metridia lucens, with some amphipods, pteropods, and fish eggs.
Station 25: Mostly all stages of C. finmarchicus and Metridia lucens, with some Microcalanus spp. and Oithona spp.
Station 39: Mostly phytoplankton, Metridia lucens and M. longa females and copepodites, C. finmarchicus C4 and C5, with some Psuedocalanus spp. copepodites, all stages of Oithona spp., and cheatognaths.
Station 27: Mostly phytoplankton, C. finmarchicus females and copepodites, Psuedocalanus spp. and Centropages spp. copepodites, and all stages of Oithona spp. and Metridia lucens, with some amphipods, pteropods, cheatognaths, and fish eggs.
Station 29: Mostly C. finmarchicus all stages, Psuedocalanus spp. copepodites, Metridia lucens females and copepodites, with some female and copepodite Centropages typicus, all stages of Oithona spp., and cheatognaths.
Station 30: Mostly phytoplankton, and all stages of C. finmarchicus, Psuedocalanus spp., Centropages typicus, Oithona spp., and Metridia lucens, with some amphipods, pteropods, and fish eggs.
Station 32: Mostly phytoplankton, and all stages of C. finmarchicus, Psuedocalanus spp., Centropages typicus, Oithona spp., and Metridia lucens, with some amphipods, pteropods, and fish eggs.
Station 34: Mostly C. finmarchicus females and copepodites, all stages of Metridia lucens, Centropages spp. copepodites, amphipods, and large decapods, with some cheatognaths and Oithona spp.
Station 36: Mostly Centropages typicus females and copepodites of Centropages spp. and Temora longeremis, with some Psuedocalanus spp. and Oithona spp. copepodites, hydroids, and cheatognaths.
Station 38: Mostly all stages of Psuedocalanus spp. and Centropages typicus, with some hydroids and cheatognaths.
Cruise notes - (submitted by Jennifer Crain)
Station 1 - Not much there. Some algae (Coscinodiscus), chaetognaths, fish larvae, amphipods, Centropages, a few Calanus (later stages) - Georges Bank mix
Station 2 - Not much there. Lots of algae (Coscinodiscus), chaetognaths, fish larvae, amphipods, Centropages, very few Calanus (later stages) - Georges Bank mix.
Station 3 - Lots of algae (Coscinodiscus), chaetognaths, fish larvae, amphipods, Centropages, very few Calanus (later stages) - Georges Bank mix. Hardly anything in nets 1-2, a fair number of Calanus C5's or adults in net 3 (surface).
Station 4 - Some algae (Coscinodiscus), a number of Centropages, very few Calanus (later stages) - Georges Bank mix. Well-mixed.
Station 6 - Well mixed, all 3 nets similar. Algae, Temora, Centropages, a few Calanus, Georges Bank mix.
Station 7 - Net 1 had a lot of Calanus , mostly C5's and some females, also some Euchaeta, euphausiids, etc. Nets 2-4 had almost nothing in them, some Coscinodiscus and Georges Bank mix.
Station 8 - Coscinodiscus, Temora, Centropages, a few Calanus - Georges Bank mix.
Station 9 - Georges Bank mix, some Calanus in net 1 and 2, almost nothing in net 3.
Station 10 - Not much there, a little Georges Bank mix.
Station 11 - Not much there, a little Georges Bank mix. Looked at surface sample under scope - no Calanus, lots of Coscinodiscus and Centropages. Some Temora, a few Pseudo's, some polychaete larvae.
Station 12 - Lots of Coscinodiscus, some chaetognaths and Centropages, very few if any Calanus.
Station 13 - Lots of Coscinodiscus, some chaetognaths and Centropages, very few if any Calanus.
Station 16 - Net 1 had some Calanus , mostly C5's and some females, also some Euchaeta, euphausiids, Metridia , myctophids, etc. Nets 2-4 had almost nothing in them, some Coscinodiscus and Georges Bank mix.
Station 17 - Net 1 had some Calanus , mostly C5's and some females, lots of Metridia and smaller copepods (Pseudo's). Nets 2-4 had lots of Coscinodiscus, some Georges Bank mix.
Station 18 - Lots of Coscinodiscus, some Calanus, this station not looked at carefully. Looks well-mixed; all nets are similar.
Station 20 - Net 1 had lots of Metridia, a few Calanus , mostly females and some C5's, Chaetognaths, ctenophores, amphipods and smaller copepods (Pseudo's). Nets 2-4 had Coscinodiscus, ctenophores, some Georges Bank mix.
Station 23 - Fairly well-mixed: Metridia, a few Calanus , mostly females and some C5's,Coscinodiscus, ctenophores, some Georges Bank mix. Larger copepods in net 1, more algae and Georges Bank mix in shallower nets.
Station 32 - Well-mixed, lots of Coscinodiscus, some chaetognaths and Centropages, a few Calanus (females and C5's).
Station 39 - Almost no Calanus , lots of Metridia , especially in deep nets,and smaller copepods (Pseudo's), Euchaeta, chaetognaths, etc. Nets 2-4 had lots of Coscinodiscus, some Georges Bank mix.
Station 25 - Almost no Calanus , lots of Metridia , especially in deep nets, and smaller copepods (Pseudo's ), Euchaeta, chaetognaths, etc. Nets 2-4 had more Coscinodiscus, some Georges Bank mix. Pteropods in 100-40 m net (net 3).
Station 27 - All nets similar. Almost no Calanus , Euchaeta, chaetognaths, some Metridia and smaller copepods (Pseudo's) , Coscinodiscus, some Georges Bank mix.
Station 29 - The most Calanus we've seen so far. Found only C5's and a few males in deep net, almost all females in shallow net. Lots of Metridia , especially in deep nets, and smaller copepods (Pseudo's ),Clione, Euchaeta, chaetognaths, etc. Nets 2-4 had more Coscinodiscus, some Georges Bank mix.
Station 30 - Well-mixed, lots of Coscinodiscus, some chaetognaths and Centropages, a few Calanus (females and C5's).
Station 40 - Calanus (probably C5's deep and females shallow, but not looked at under scope), lots of Metridia , especially in deep nets, and smaller copepods (Pseudo's), Euchaeta, chaetognaths, Clione, etc. Nets 2-4 had some Coscinodiscus, but were generally similar to deeper nets.
Station 34 - Deep nets had Calanus (probably C5's, but not looked at under scope), lots of Metridia , smaller copepods, amphipods, cjaetognaths. Shallow nets had chaetognaths, ctenophores, smaller copepods, a few Centropages , some Coscinodiscus.
Station 36 - Fairly well-mixed, lots of Coscinodiscus, some chaetognaths and Centropages, a few Calanus (females and C5's).
Station 38 - Not many Calanus (C5's deep and females shallow), lots of Metridia , especially in deep nets, and smaller copepods (Pseudo's ), Euchaeta, chaetognaths, Clione, etc. Nets 2-4 had some Coscinodiscus, pteropods, Centropages.
Preliminary Summary of Ichthyoplankton Findings.
(Rebecca J. Jones and John Sibunka)
All samples from the Bongo net B were subjected to preliminary examination for eggs and larvae during the cruise. These samples were preserved in 5% formalin, and observations were made of the sample while it was still in the jar. The following qualitative observations of the larval size, abundance and egg abundance were made only from the formalin preserved samples because the quality of the eggs and larvae after formalin preservation is better than ETOH.
See cruise reports EN261 (February 1995), EN278 (February 1996), OC298 (February 1997), and OC317 (February 1998) for the following references to ichthyoplankton findings during 1995-1998.
Sand lance (Ammodytes sp.)
Sand lance larvae were ubiquitous this month. The greatest concentrations were along the middle portions of the bank (Figure 6). Their sizes ranged from 10-40 mm, with the largest fish being sampled from along the northwestern edge of the bank. January sand lance observations are not much different from this month. This month's distribution of larvae around the bank closely resembles the OC298 cruise in 1997, although the numbers of larvae in 1997 were much higher.
Atlantic herring (Clupea harengus)
Herring were not as prevalent as they were January. All the larvae were along the southeast and west quadrants of the bank. As expected, larvae were much larger than last month. A few large larvae were sampled from the southeastern quadrant in low numbers. Larger larvae and low numbers suggest that spawning commenced earlier this year than the previous years.
Cod (Gadus morhua)
Only 13 stations contained cod larvae and catches did not exceed five fish (Figure 7). The size distribution of these larvae were random, with largest fish (10-15mm) being found at station 3, 6 and 19. Catches from all the previous years suggest a smaller spawning aggregation of cod to be around station 1 and 38 in the Great South Channel. All January and February cruises have found eggs and larvae in this area.
Gadid eggs (cod/haddock/pollock eggs)
Egg catches were more advanced than last month with the largest numbers estimated at 100-150/station for the Northeast peak (Figure 8). In addition, substantial catches of eggs were observed at the Great South Channel. These two areas were the only places that gadid eggs were observed. Catches from previous years were larger with abundance estimated in the thousands. In OC298 (1997), the egg catches really demonstrate the presence of another spawning site at the Great South Channel. You can clearly see the advection of eggs from each of these two "hot spots" of spawning.
Miscellaneous larvae
Myoxocephalus sp. was found at stations 64 and 32.
Paralepidae were sampled at the deep stations 7,16 and 22.
Leptocephalus was found at station 3.
fig 6
figure 7
figure 8
Preliminary Summary - 10-m2 MOCNESS samples
Stephen Brownell
The samples collected from the 10-m2 MOCNESS were examined on shipboard for a qualitative estimate of abundance, distribution, and size range of both the invertebrate and the fish community at selective stations. The following observations are based on examination of the samples after preservation.
Station 3 Haul 1
ctenophores
euphausiids
Station 4 Haul 2
ctenophores
euphausiids
atlantic herring (Clupea herengus)
Station 9 Haul 3
euphausiids
ctenophores
isopods
hake (Urophycis sp.)
Station 12 Haul 4
ctenophores
euphausiids
naked pteropods (Clione spp.)
Station 13 Haul 5
ctenophores
isopods
naked pteropods (Clione sp.)
Station 20 Haul 6
ctenophores
naked Pteropods (Clione spp.)
hyperiid amphipods
Station 23 Haul 7
euphausiids
hyperiid amphipods
naked pteropods (Clione spp.)
Station 39 Haul 8
Euphausiids
ctenophores
shrimp ~3cm.
hyperiid amphipods
Station 18 Haul 9
euphausiids
shrimp ~3cm
Station 17 Haul 10
ctenophores
naked pteropods (Clione spp.)
Station 25 Haul 11
ctenophores
hyperiid amphipods
chaetognaths
Zooplankton Observations: Calanus life history studies
(Jennifer Crain, Oregon State University)
Zooplankton populations on and around Georges Bank reflected distribution patterns typical of what has been observed on February cruises in past years, with an abundance of Centropages on the bank, and very few Calanus to be found anywhere. A seemingly isolated stock of diapausing C. finmarchicus fifth copepodites was seen between 500 and 93 meters at standard station 7 on the southern flank. Other aggregations of fifth copepodites were seen in deep MOCness nets at the deep northern stations 29, 40, 36 and 38, but Calanus abundance was low at all stations sampled. A few mature males were seen in association with the fifth copepodites, and mature females were found in surface nets at the same stations. General observations led to the conclusion that while Calanus abundance was low, Metridia populations were strong, often found in great numbers at stations at which we normally expect to see alot of C. finmarchicus. This observation may or may not be borne out in a more careful accounting of populations to be performed by the Durbin lab at the University of Rhode Island.
We are continuing to collect subsamples for studies of several aspects of the life history of Calanus finmarchicus. Formalin-preserved subsamples were taken from the 150 micron mesh nets of 1-meter MOCness tows at all priority 1 and 2 sstations on OC336. In preparation for molecular techniques to be used for distinguishing genetic sex of C. finmarchicus, we preserved 100/400 ml subsamples from 1-meter MOCness net number 5 at all priority 1 and 2 stations also.
At standard stations 29 and 38, fifth copepodites were sorted from live subsamples taken from deep and shallow nets of the 1-meter MOCness, and cryopreserved for protein analysis to be performed by Nancy Marcus. This analysis is part of a preliminary study to identify possible biochemical differences between diapausing and nondiapausing individuals collected in the field. Although all of the fifth copepodites preserved for the study had developing gonads, indicating that all were in the process of maturing, other indications including depth and activity level suggested that they were at different stages of emergence from diapause.
Nutrients and Phytoplankton Studies
Annette L. Brickley and Matt Cieri (for David W. Townsend)
University of Maine
[see also: http://grampus.umeoce.maine.edu/globec/globec.html]
Overview:
We are collecting water samples on all six broad scale cruises in 1999 (January to June) to analyze for nutrients and phytoplankton biomass. During the February cruise, water samples were collected for analyses of:
dissolved inorganic nutrients (NO3+NO2, NH4, SiO4, PO4);
dissolved organic nitrogen and phosphorus;
particulate organic phosphorus;
particulate carbon, hydrogen, and nitrogen;
phytoplankton chlorophyll a and phaeophytin;
phytoplankton species composition
Methods:
Water collections were made at various depths at all of the regular hydrographic stations (Stations 1 - 41) sampled during the January 1999 broad scale survey cruise aboard R/V Oceanus, using the 1.7 liter Niskin bottles mounted on the rosette sampler. At station 33, due to communication difficulties with the rosette, 2 Niskin bottles were hung on the wire at depths of 2 and 20m. Additional near-surface water samples were collected at positions between the regular stations (Stations numbered >41) using the ship's underway flow-through sea water system.
Samples for dissolved inorganic nutrients (DIN) and chlorophyll were collected at all stations, 1-41, at all the intermediate stations (near-surface), and at all repeated stations (16, 17, 18, 20, 23). Water samples for DIN were filtered through 0.45 m Millipore cellulose acetate membrane filters, and frozen in 20ml polyethylene scintillation vials by first placing the vials in a seawater-ice bath for about 10 minutes. Samples will be analyzed following the cruise using a Technicon II AutoAnalyzer. Water samples (50 mLs) for dissolved organic nitrogen, and total dissolved phosphorus (both referred to as DON) were collected at 2 depths (2 and 20m) at each of the main stations and frozen as described above. Due to a shortage of 60 mL polyethylene bottles for storage of the DON samples, collection was reduced to a 2m sample only at several well mixed stations (19, 20, 26, 30, 31, 32, 37) or not collected at stations in close proximity to another station (24, 27). These samples will be analyzed using a modification of the method of Valderrama(1981). Samples for particulate organic carbon, hydrogen, and nitrogen were collected by filtering 500 mLs onto pre-combusted, pre-ashed GF/F glass fiber filters from 2 depths (2 and 20m) at each of the main stations, wrapped in foil pouches and frozen. The filters will be fumed with HCl to remove inorganic carbon, and analyzed using a Control Equipment Model 240-XA CHN analyzer (Parsons et al., 1984). Samples for particulate phosphorus were collected as for CHN, filtering 200 mLs and freezing in glass scintillation vials. Laboratory analyses will involve digesting the sample in acidic persulfate and then analyzing for dissolved orthophosphate.
Phytoplankton chlorophyll a and phaeopigments were measured in discrete water samples collected at all stations (see Table 1). One hundred mls of water was collected from each depth down to 100 meters, filtered onto a GF/F filter, and extracted in 10 mLs 90% acetone. The samples were allowed to extract for at least 6 hours, then analyzed at sea using a Turner Model 10 fluorometer according to the method of Parsons et al., 1984.
Samples for phytoplankton species composition were collected from the surface at stations 1-41 by preserving a volume of 100 mls in Lugol's solution. These samples will be available for analysis of the larger species using the Uttermohl inverted microscope method.
Preliminary Results:
The only data immediately available following the cruise are the CTD data (D. Mountain) and the chlorophyll data presented here (Table 1). Chlorophyll levels indicate early bloom conditions with values reaching as high as 7.7 µg/ L. The highest chlorophyll levels were repeated at several stations (46, 47, 52, 53) and surrounded by values ranging from 4.5 - 6.5 ug/L (sta. 10, 11, 12, 36). See figure 9.
References:
Parsons, T.R., Y. Maita and C.M. Lalli. 1984. A Manual of Chemical and Biological Methods for Seawater Analysis. Pergamon, Oxford. 173 pp.
Valderrama, J.C. 1981. The simultaneous analysis of total nitrogen and total phosphorus in natural waters. Marine Chemistry 10: 109-122.
Figure 9
Table 1. Total Chlorophyll a and phaeophytin from February 1999 Broadscale survey OC336.
| Station | Lat(deg) | Lat(min) |