Acknowledgments
This cruise and preliminary data report was prepared by Richard Limeburner. We thank the officers and crew of the R/V Oceanus Cruise 345 for their skill and superb assistance that made possible the recovery of 8 moorings and completion of the hydrographic survey. Special thanks to Wil Ostrom for leading the successful mooring deployment operation and George Tupper for maintaining and operating the shipboard scientific equipment and coordinating this instrumentation with the needs of the scientific party.
The GLOBEC research effort is sponsored by the National Science Foundation and the National Oceanic and Atmospheric Administration. Support for Frontal Exchange Processes over Eastern Georges Bank Program as part of the U.S. GLOBEC Northwest Atlantic/Georges Bank Study was provided by NSF research grant OCE-98-06379. All data and results in this report are to be considered preliminary.
Cruise Report
GLOBEC R/V OCEANUS OC345
Purpose and Accomplishment Summary 3
Cruise Results 4
1. Frontal Study Moorings 4
1.1 North Flank Shallow – Mooring site NFS 4
1.2 Eastern Flank – Mooring site EF 4
1.3 North Flank Deep – Mooring site NFD 4
2. Hydrography 5
2.1 Calibration 5
2.2 Hydrographic Station Locations 6
2.3 Near-surface Temperature and Salinity Profiles 6 2.4 T/S plot of all stations 8
Cruise Event Log 9
Cruise Personnel 11
Chief Scientist’s Log of Daily Events 11
Appendix 1 – CTD station profile data 14
Lists of Figures
Figure 1. R/V Oceanus OC345 Cruise Track and Mooring Locations.
Figure 2. CTD Conductivity Sensor calibration
Figure 3. Oceanus 345 CTD station locations
Figure 4. Surface temperature and Salinity, August 1-6, 1999
Figure 5. T/S plot of all CTD stations.
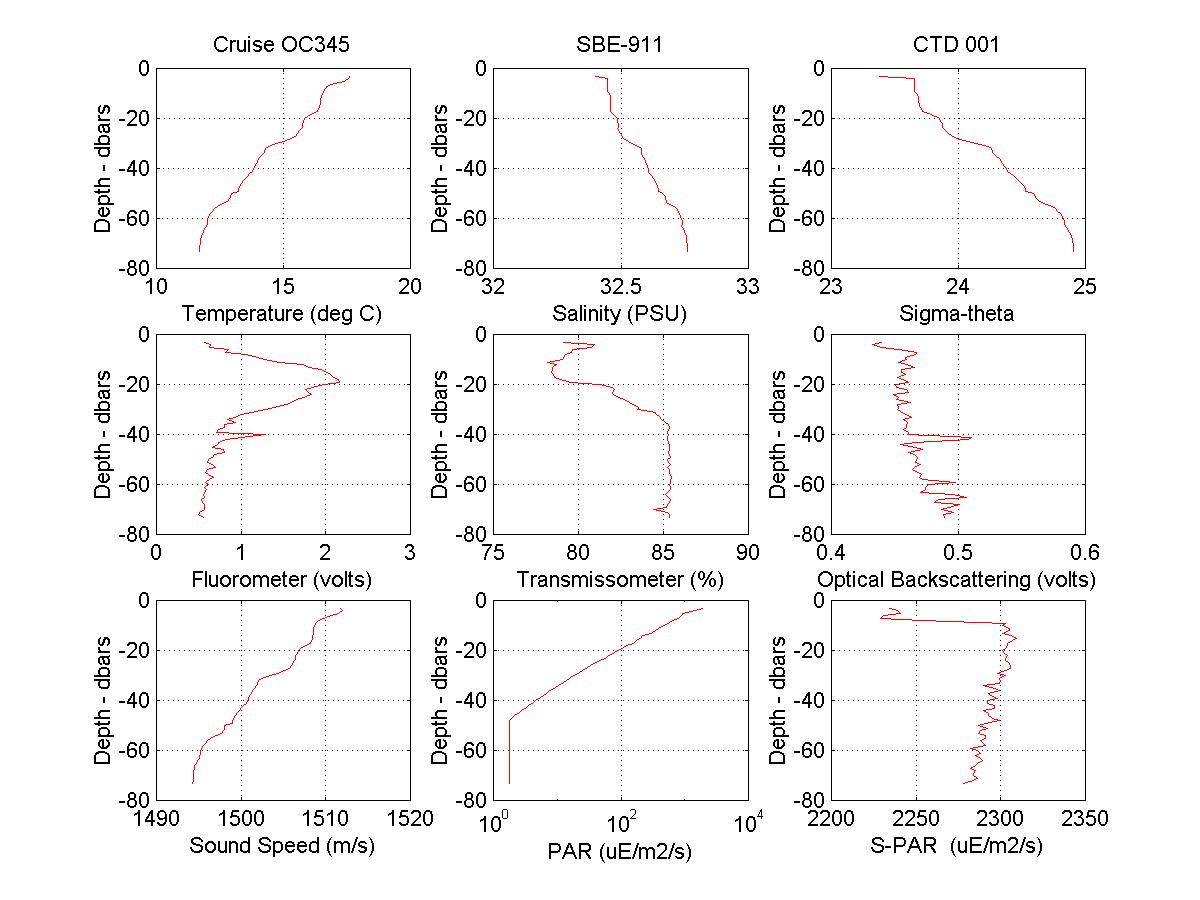
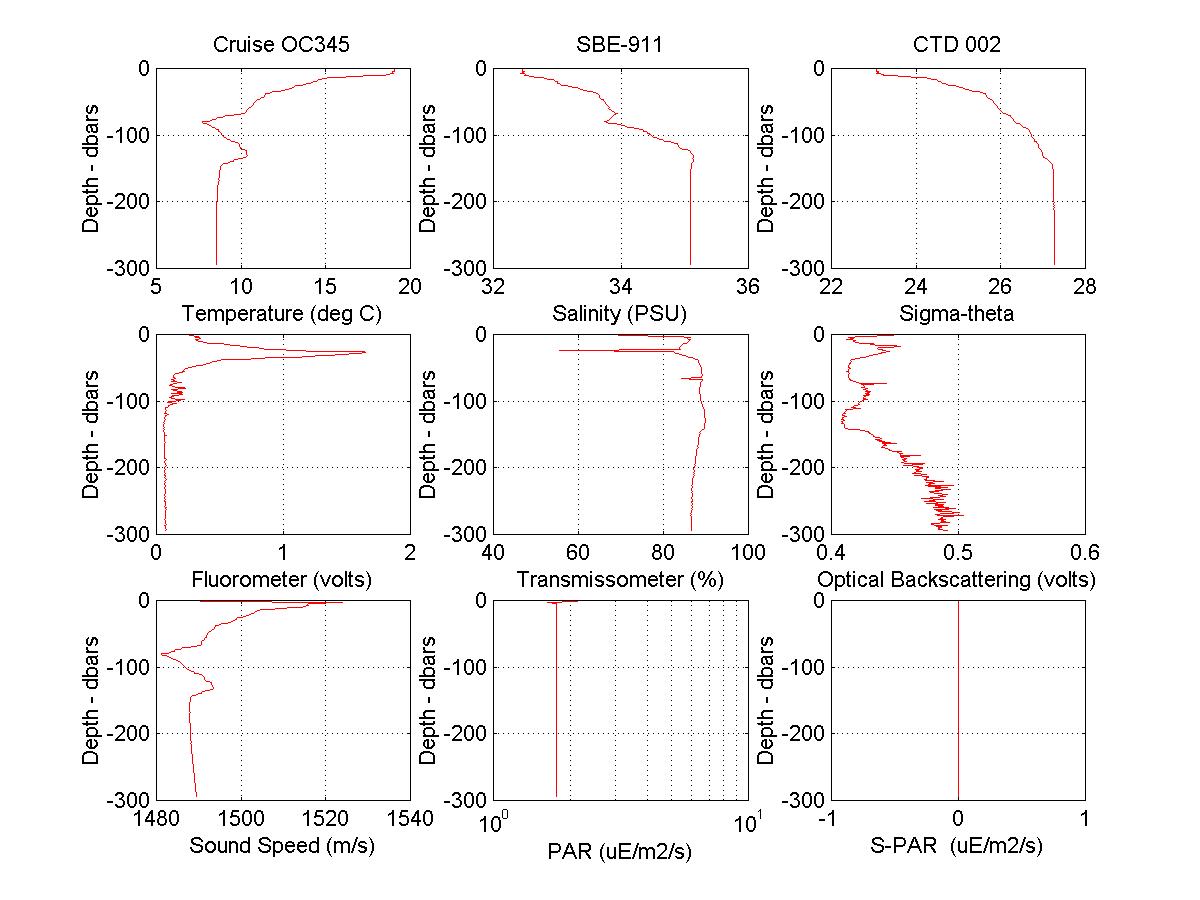
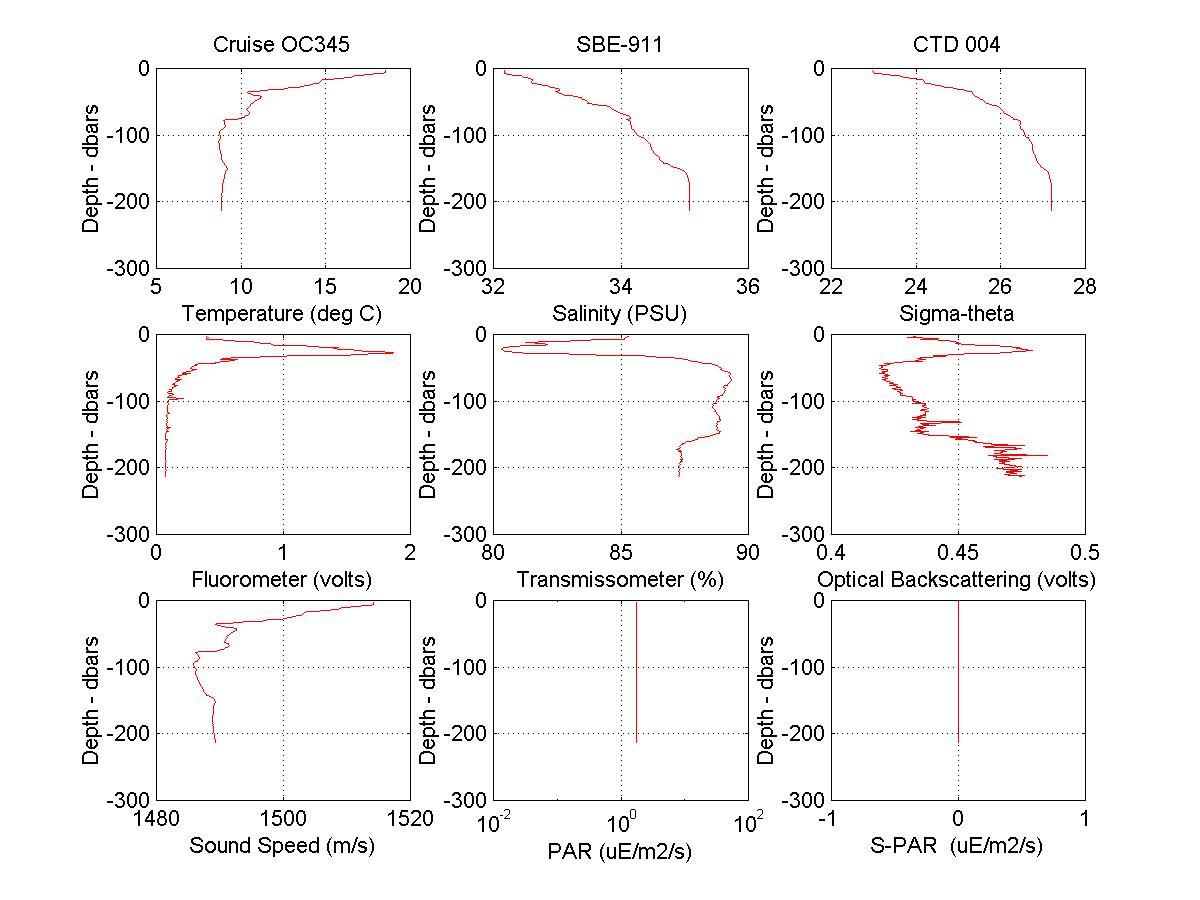
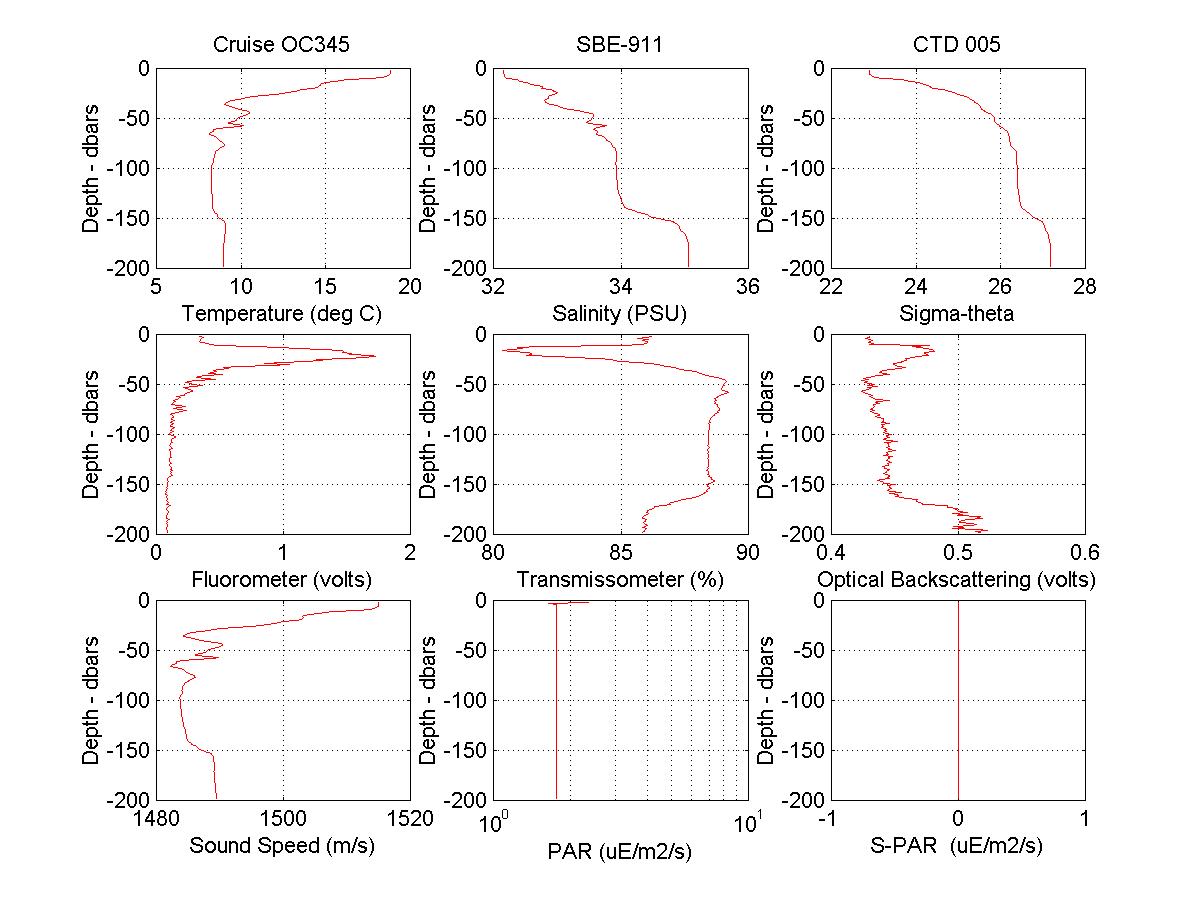
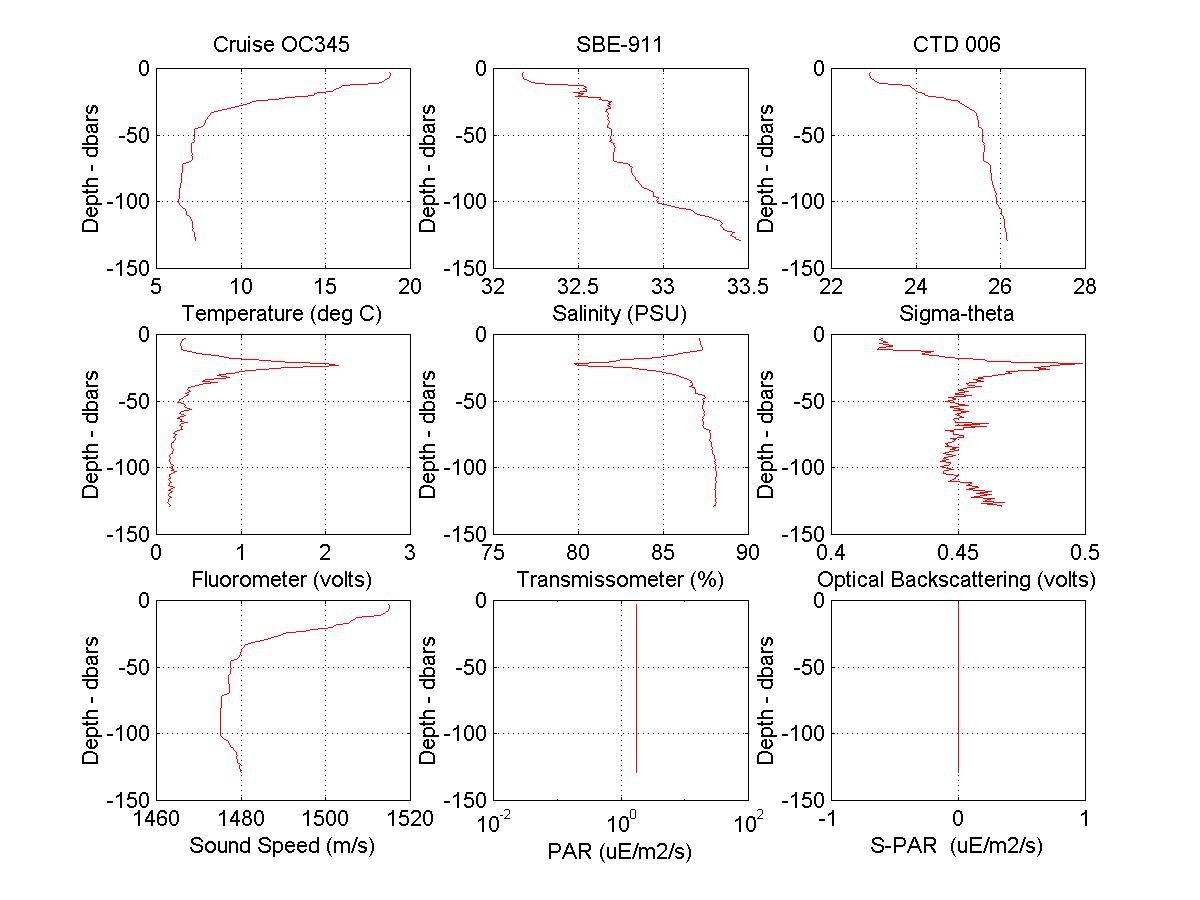
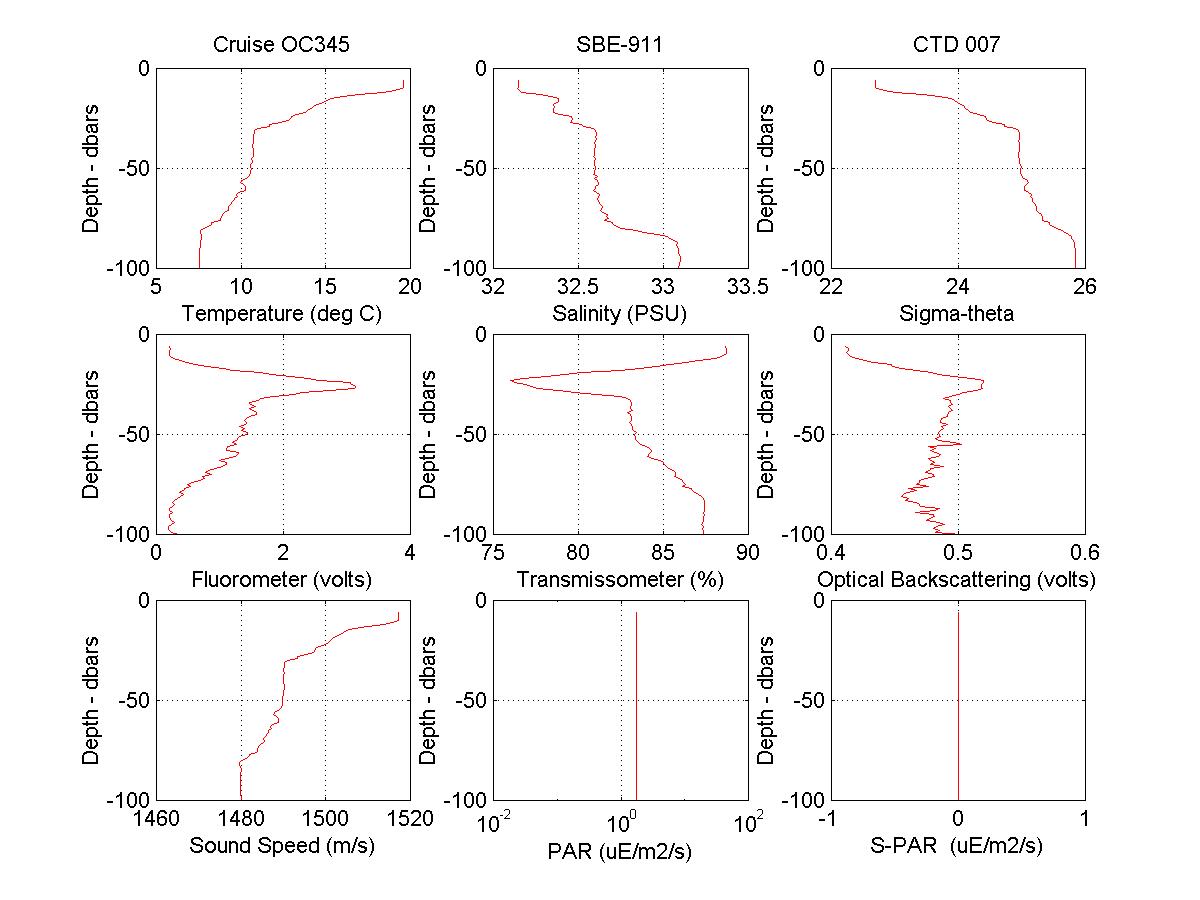
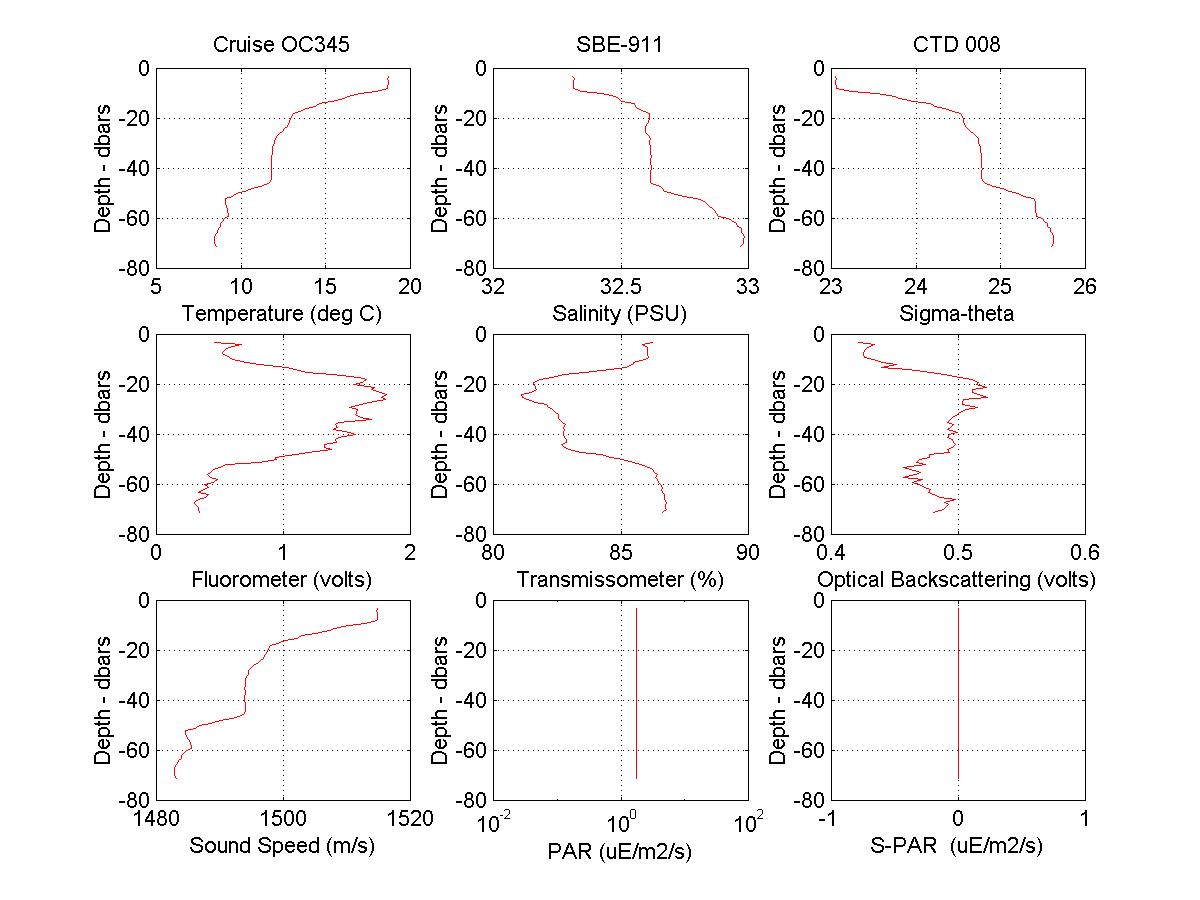
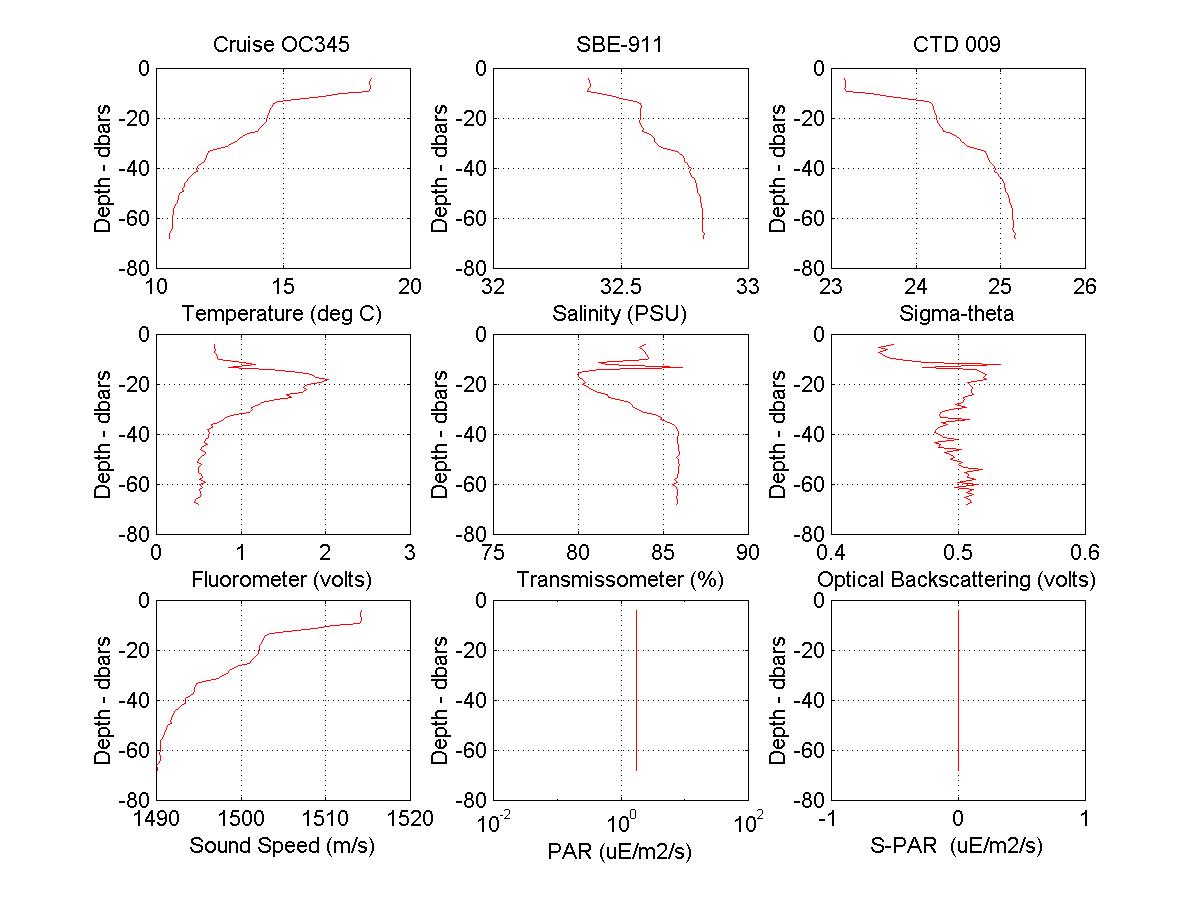
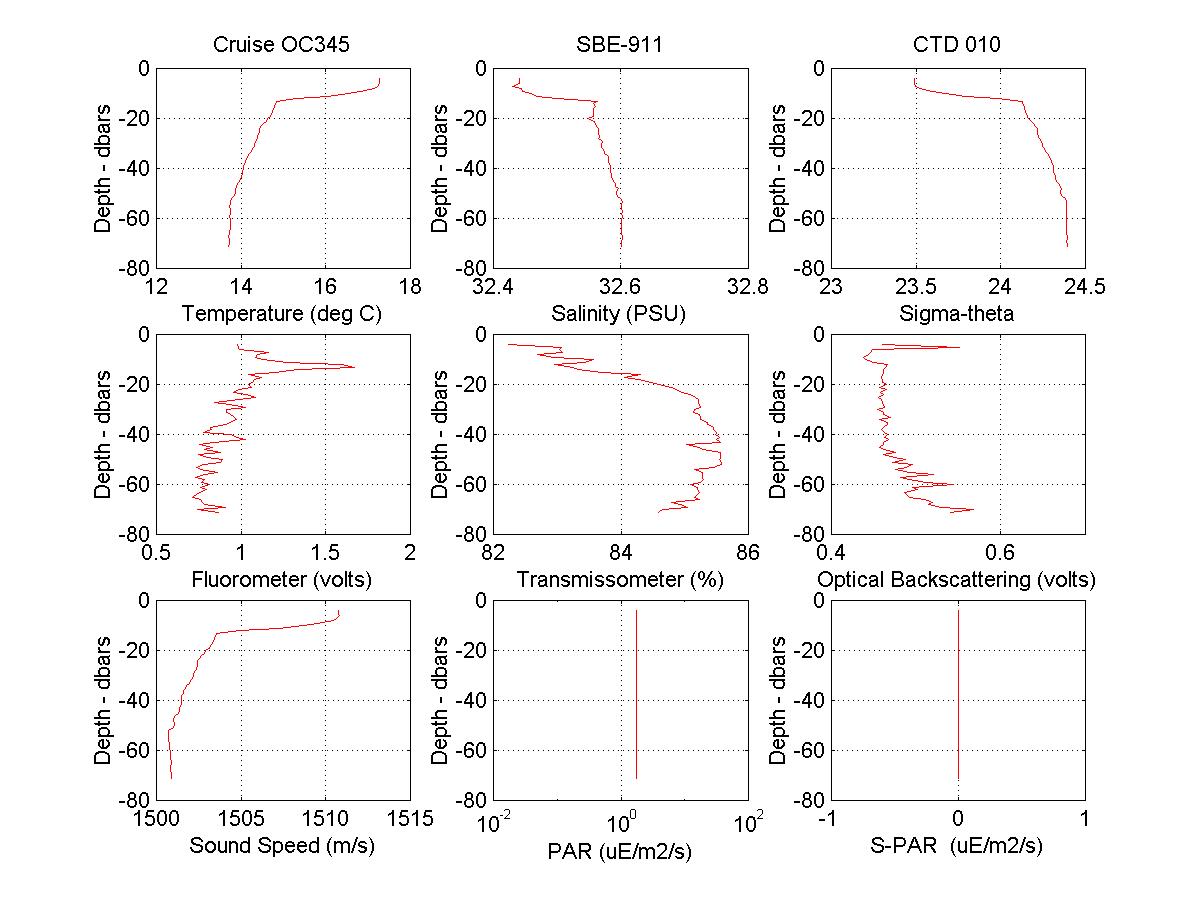
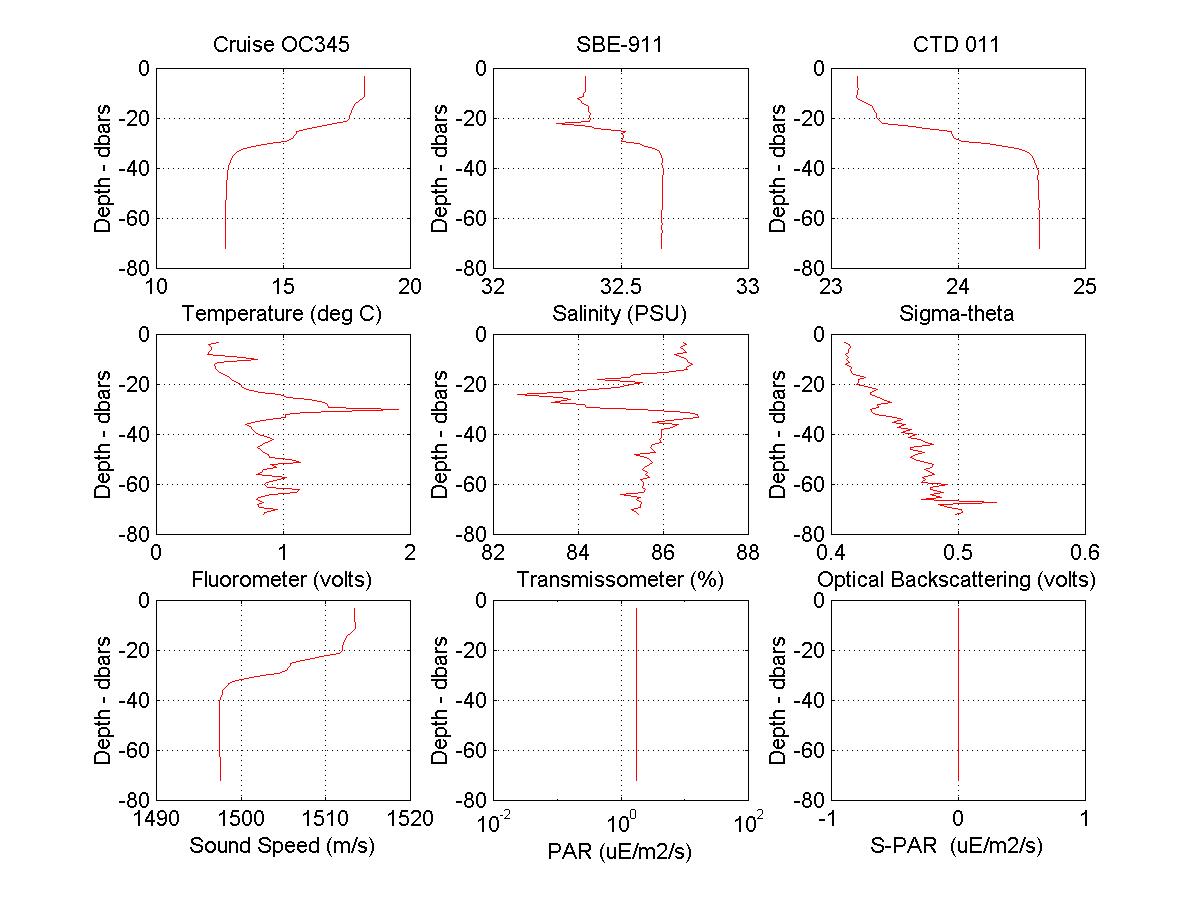
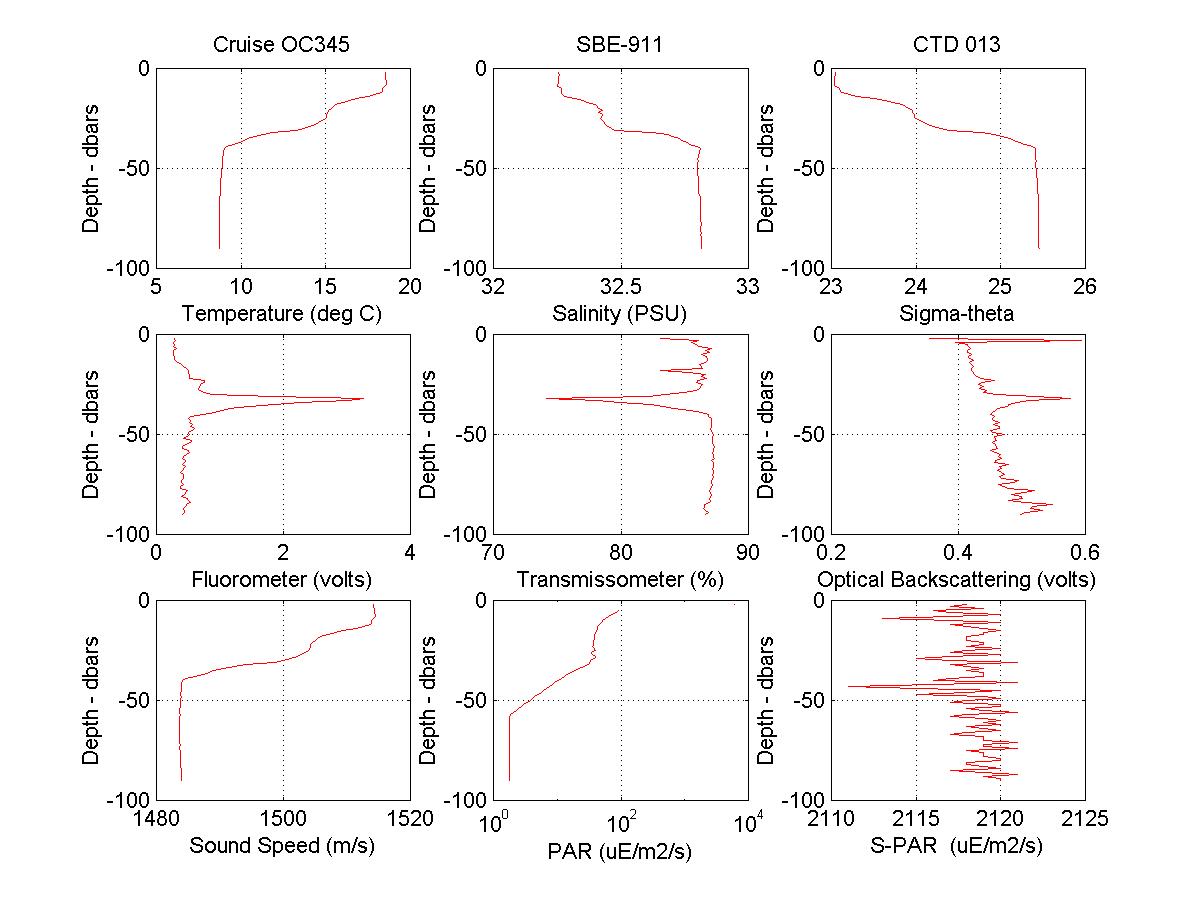
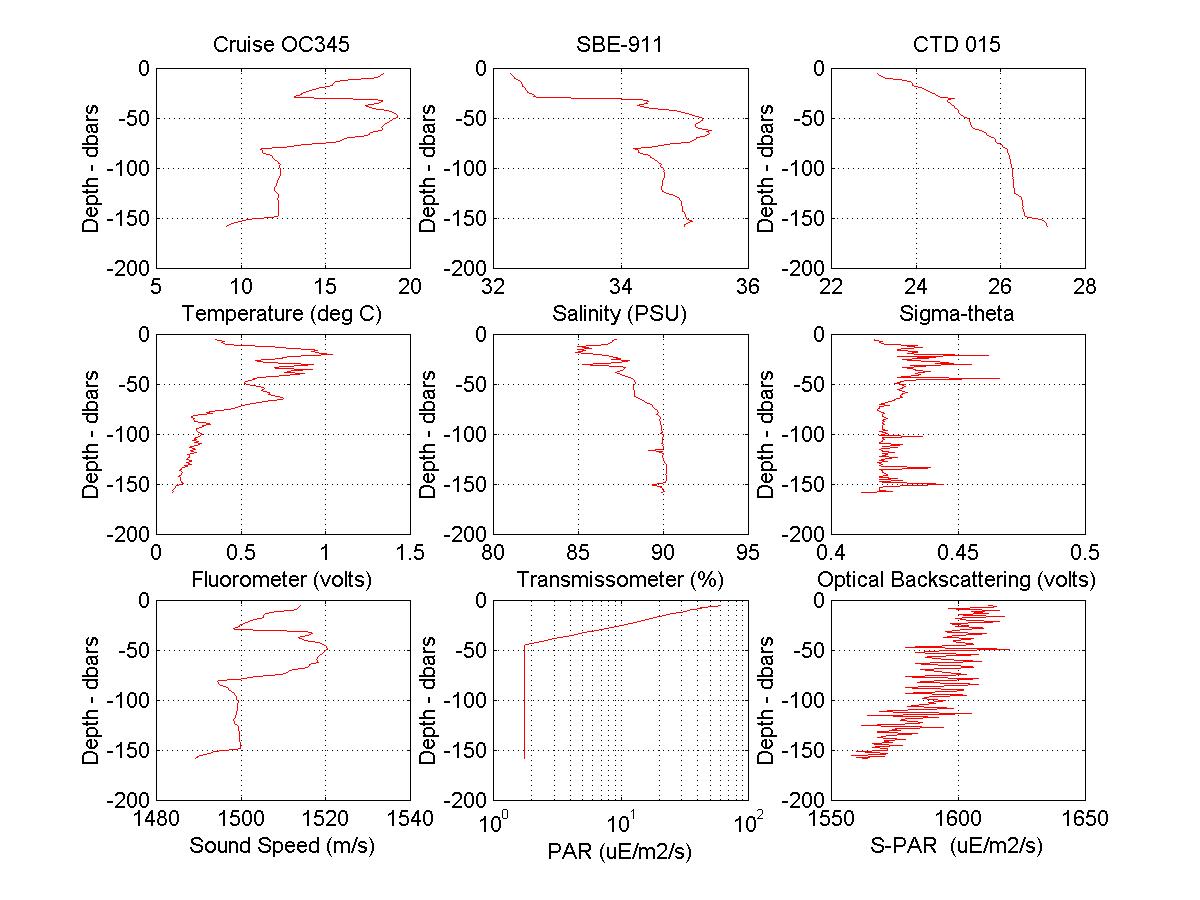
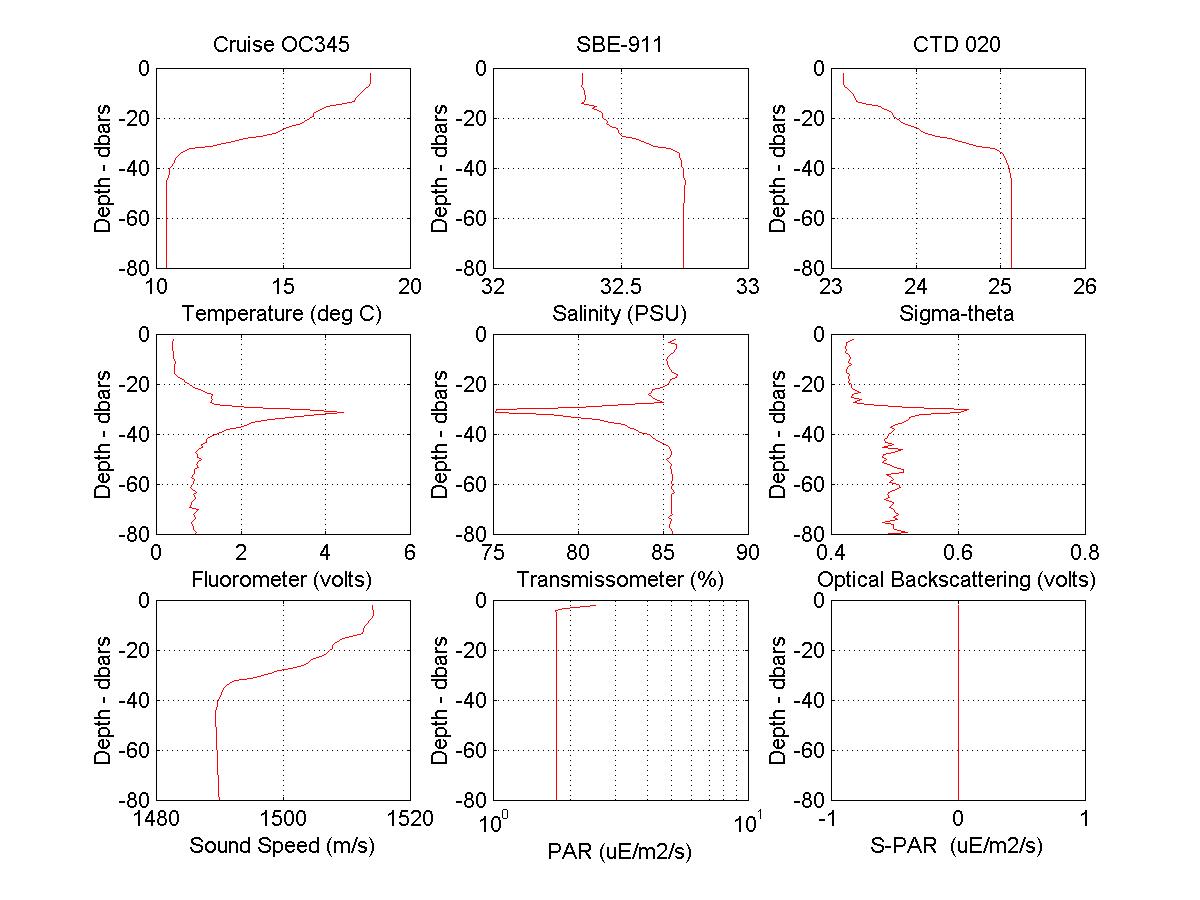
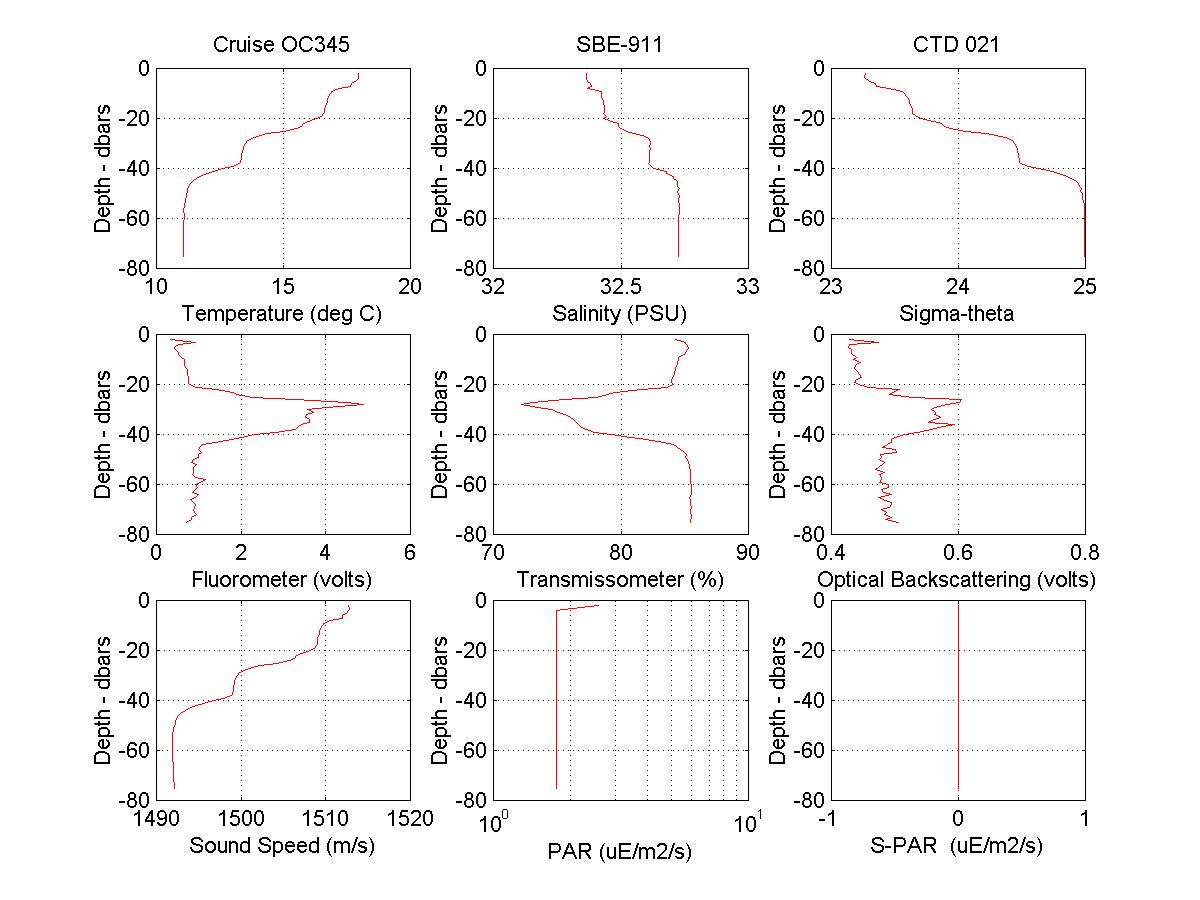
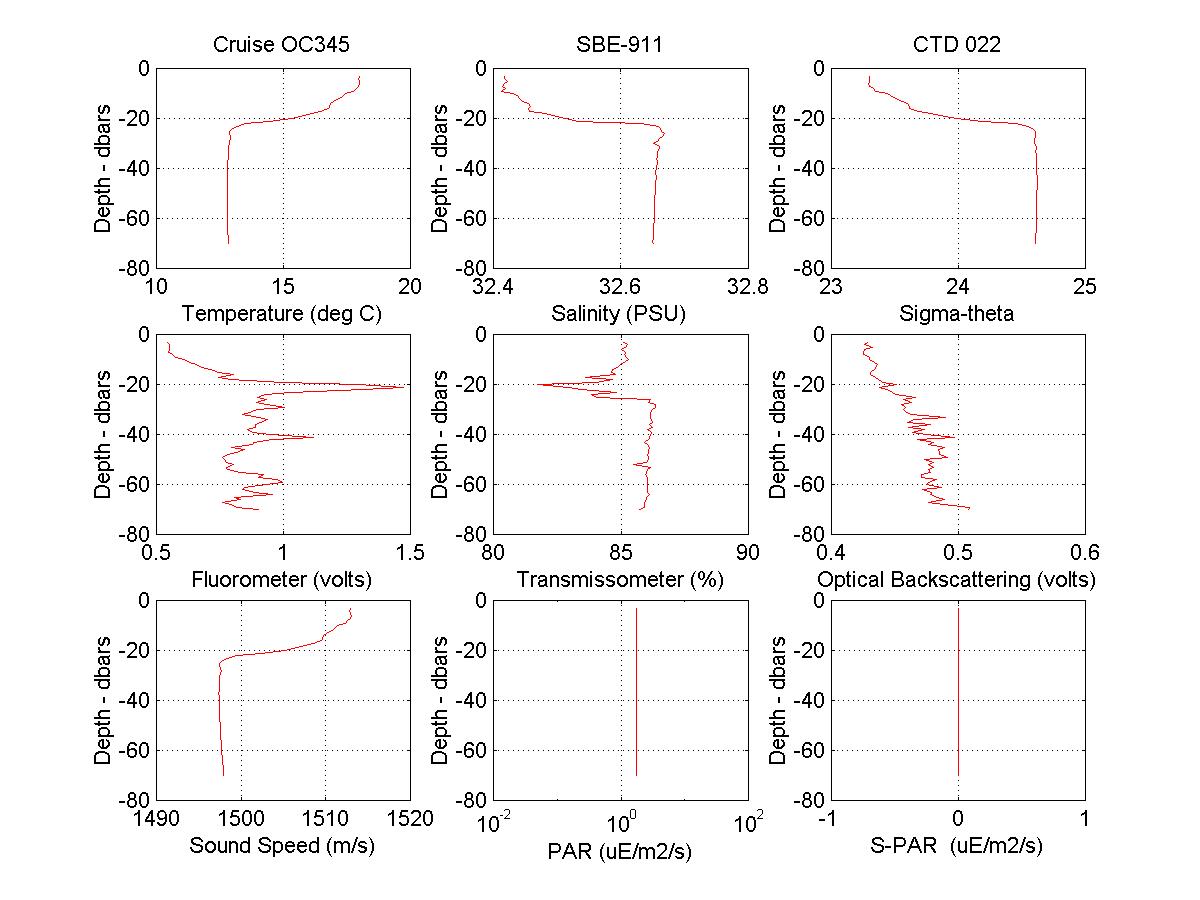
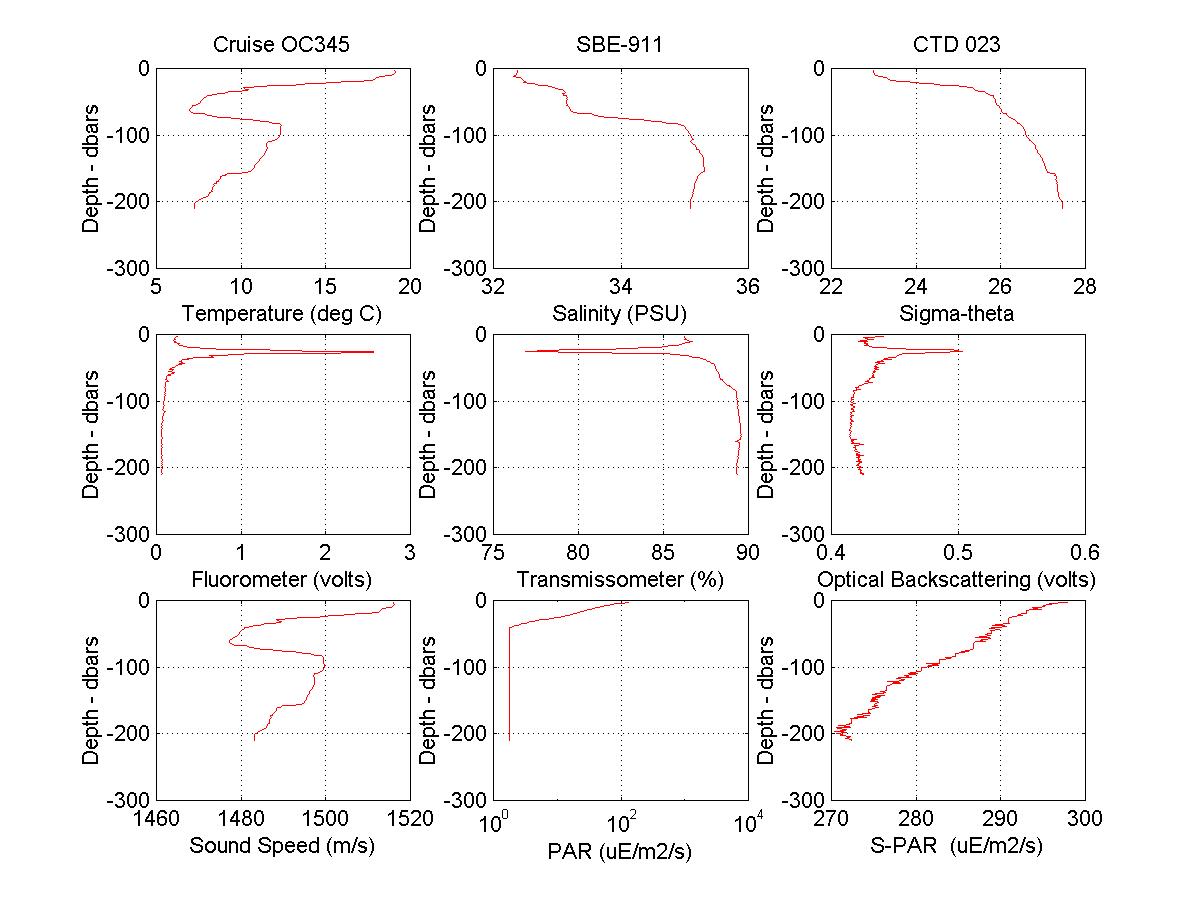
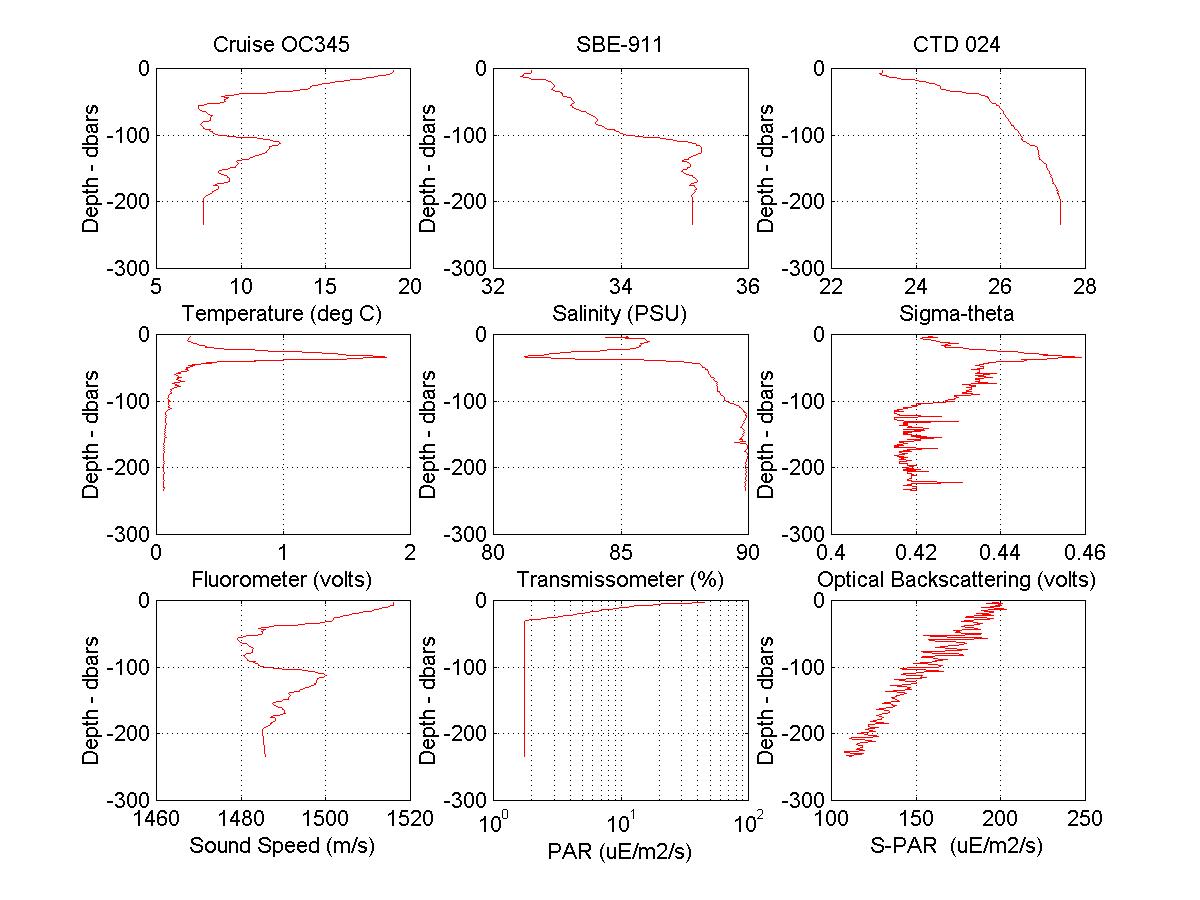
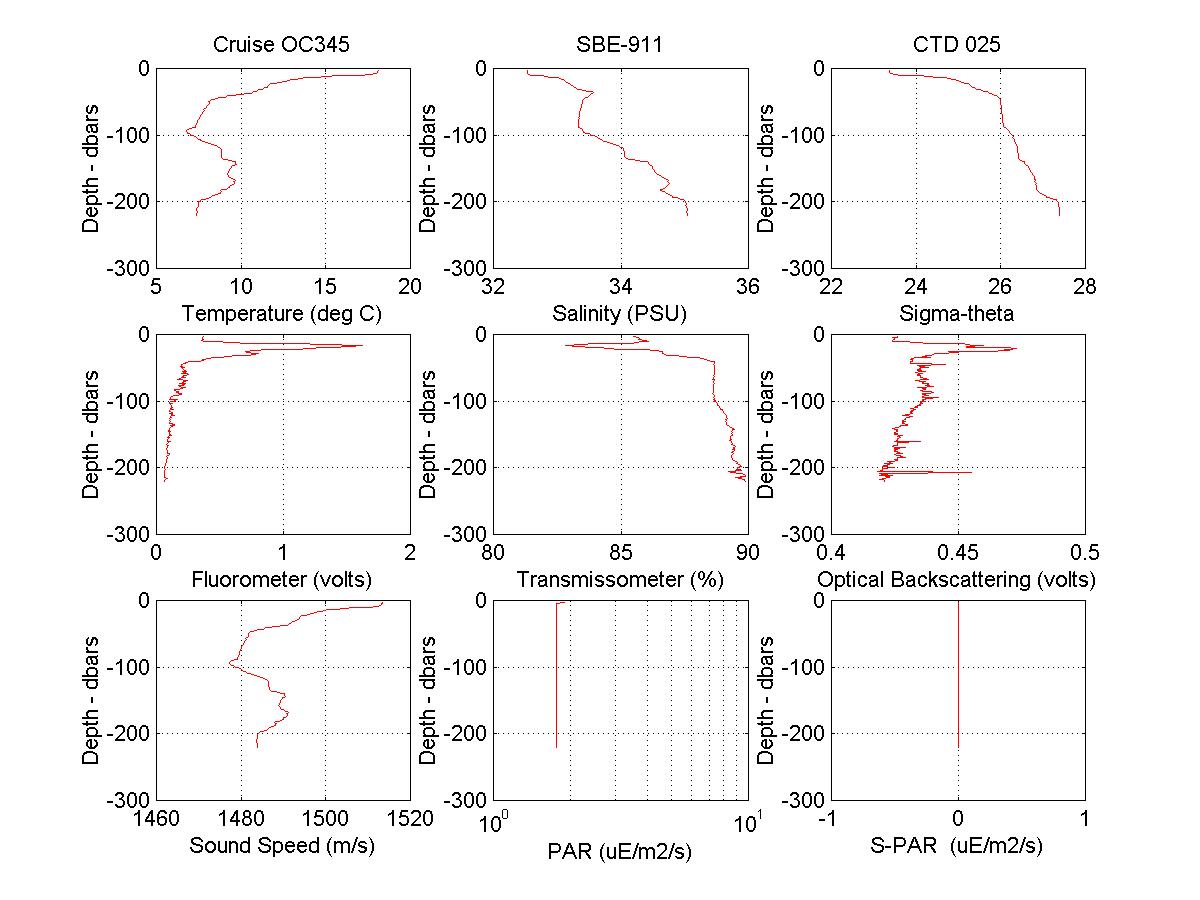
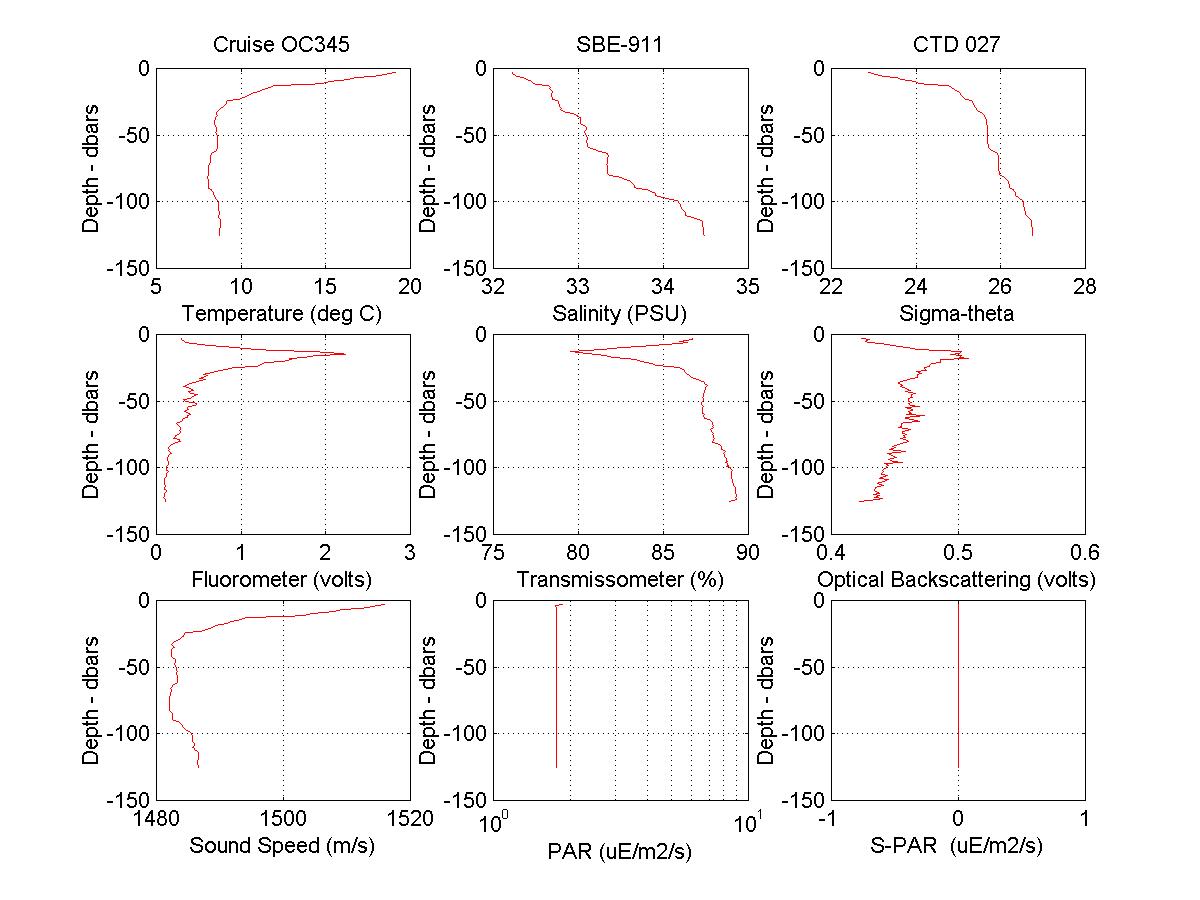
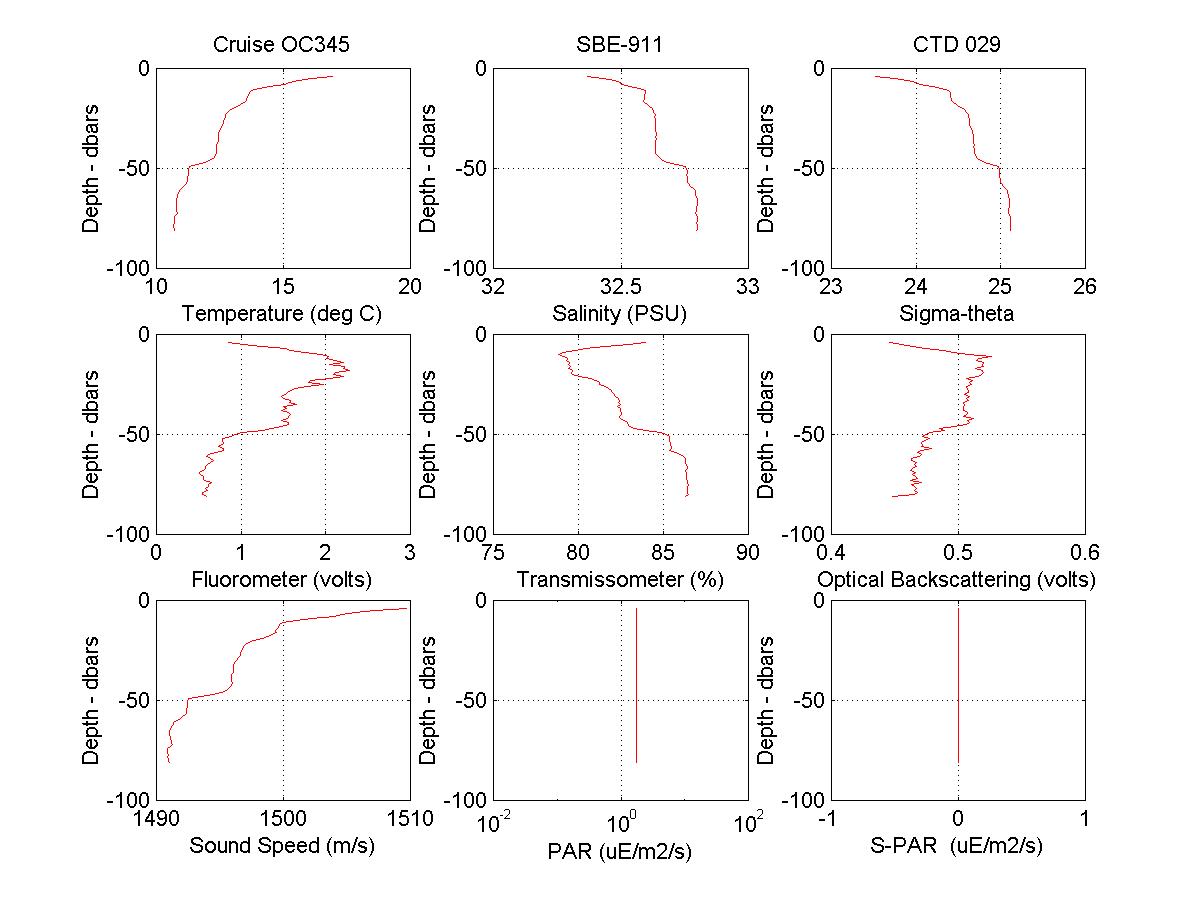
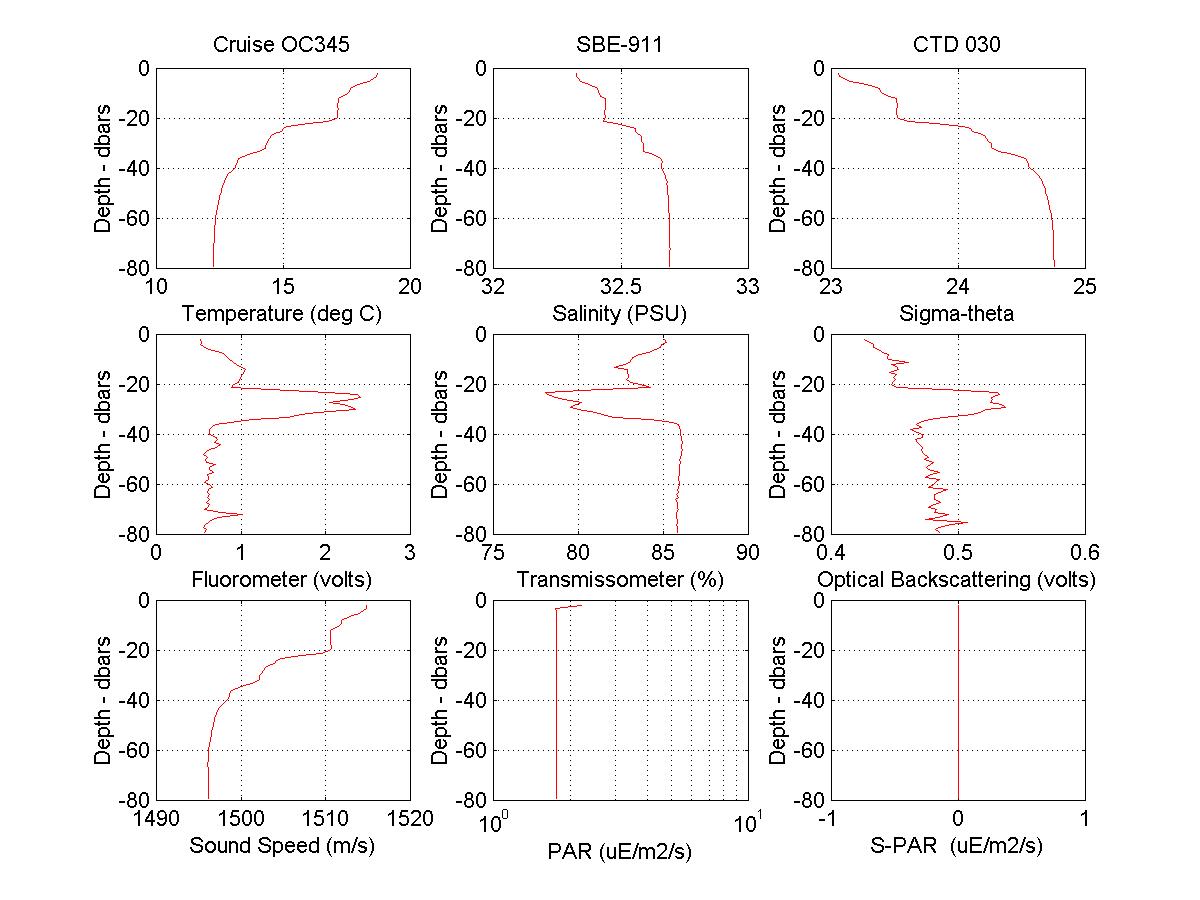
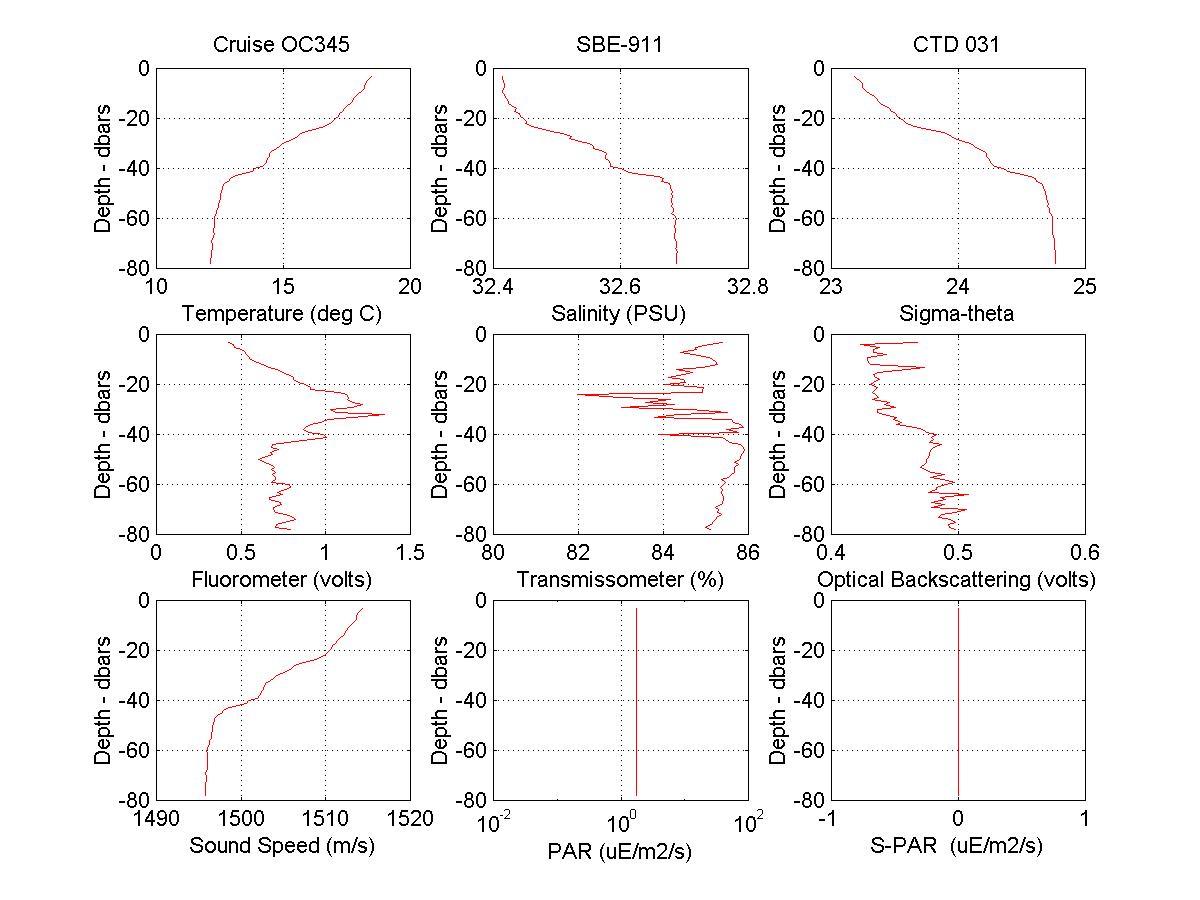
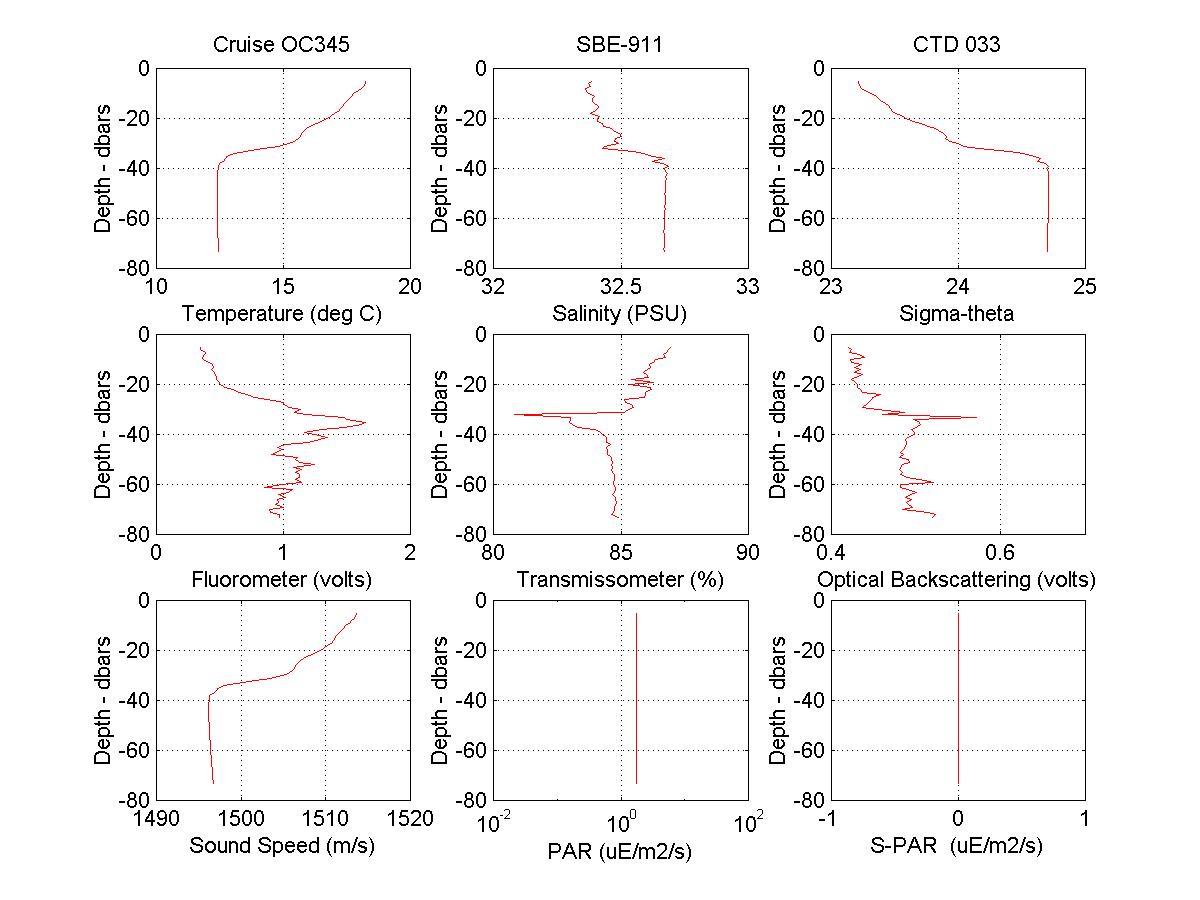
Figures 6-22. CTD profile data
US State Department Cruise No. 99-013
Woods Hole to Georges Bank to Woods Hole
August 1-6, 1999
The primary purpose of OC345 was to recover instrumented moorings at several sites on the northern and eastern flank of Georges Bank and to conduct CTD and ADCP surveys over the eastern half of the Bank. This NSF program, Frontal Exchange Processes Over Eastern Georges Bank, was designed to focus on frontal processes, which occur over eastern Georges Bank in winter through spring. In particular we want to examine (a) the flow of water and biota onto the Bank along the northeastern flank driven by the strong local semidiurnal tidal currents (which can reach 1.5 m/s during spring tide), winter storms, and the seasonally-evolving density field, and (b) the advection of Scotian shelf water across the Northeast Channel onto the Bank associated with the shelf/slope front and episodic events such as winds and buoyancy pulses.
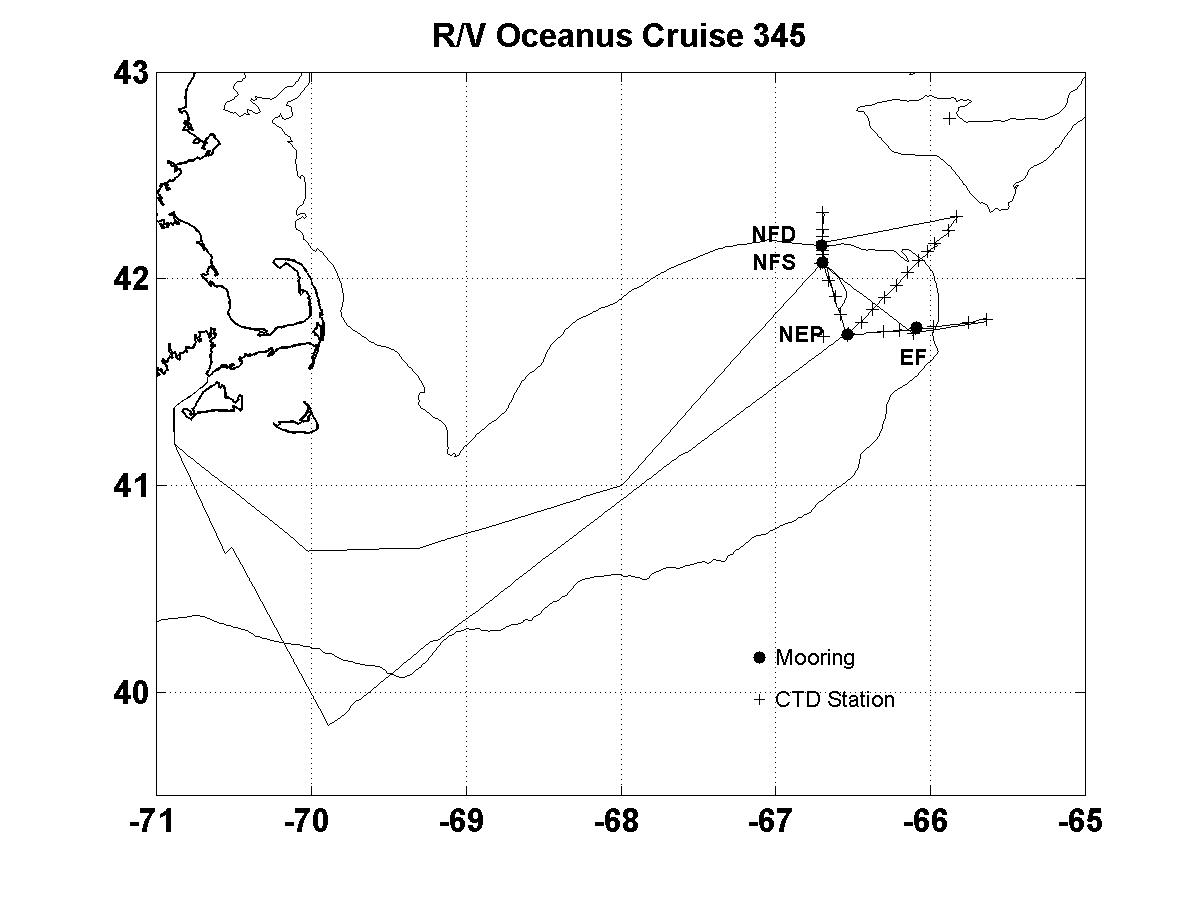
The cruise successfully recovered 8 moorings at 3 sites over the north and east flanks of Georges Bank. The ship’s track, mooring locations, and CTD station locations are shown in Figure 1. A total of 33 CTD stations were made during the cruise.

Figure 1. OC345 cruise track, CTD station and mooring locations.
Frontal Study Moorings – Dick Limeburner and Charlie Flagg
1.1 North Flank Shallow - Mooring Site NFS
Eastern Flank - Mooring Site EF
The guard buoy at the EF mooring site was recovered on August 2, 1999 at 1429Z along with a small fisherman’s buoy. We then began recovering the EF discus mooring at 1658Z. A piece of polypropylene fishnet was caught in the discus bridle and needed to be cut away in order to disconnect the EF discus from the rest of the mooring. We disconnected the mooring below the lowest instrument and began an east/west CTD section during the evening.
1.3 North Flank Deep – Mooring Site NFD
At sunrise on August 3, 1999 we released the anchor on the ADCP frame, but the instrument package remained on the bottom at the NFD site. We decided to recover the NFD discus and then begin dragging operations for the bottom mounted ADCP. The NFD discus was on the deck at 1233Z. Fish line was attached to the discus bridle as well as a collapsed polyform buoy. We disconnected the mooring below the lowest instrument and began the dragging operation for the ADCP. At 1824Z the ADCP surfaced after one hour of dragging and at 1851Z the ADCP was on the deck. Table 1 summarizes the mooring recoveries.
Mooring |
ID |
Date |
Time UTC |
Latitude N |
Longitude W |
Depth m |
|
North Flank Shallow Guard |
NFSC |
8/2/99 |
1930 |
42° 04.80’ |
66° 42.00’ |
74 |
|
North Flank Shallow Guard |
NFSO |
8/2/99 |
2104 |
42° 04.71’ |
66° 42.27’ |
74 |
|
North Flank Shallow SubSurf. |
NFSSS |
8/2/99 |
2223 |
42° 04.60’ |
66° 41.93’ |
72 |
|
North Flank Shallow Discus |
NFS |
8/3/99 |
1022 |
42° 04.49’ |
66° 42.04’ |
76 |
|
East Flank Guard |
EF |
8/3/99 |
1432 |
41° 44.29’ |
66° 06.78’ |
97 |
|
East Flank Discus |
EF |
8/3/99 |
1658 |
41° 44.31’ |
66° 06.53’ |
100 |
|
North Flank Deep Discus |
NFD |
8/4/99 |
1233 |
42° 09.79’ |
66° 42.19’ |
160 |
|
North Flank Deep ADCP |
NFD |
8/4/99 |
1851 |
42° 10. 25’ |
66° 42.57’ |
160 |
2. HYDROGRAPHY – Dick Limeburner
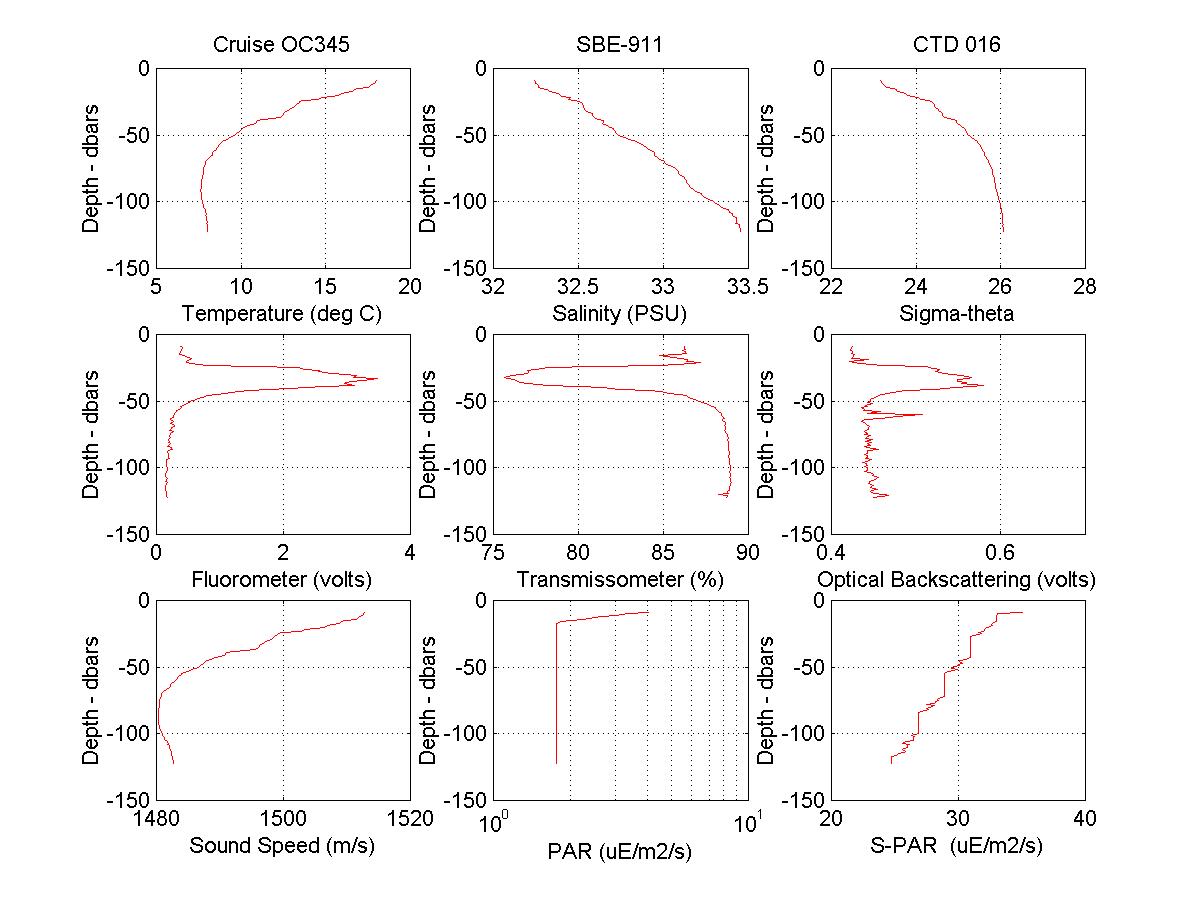
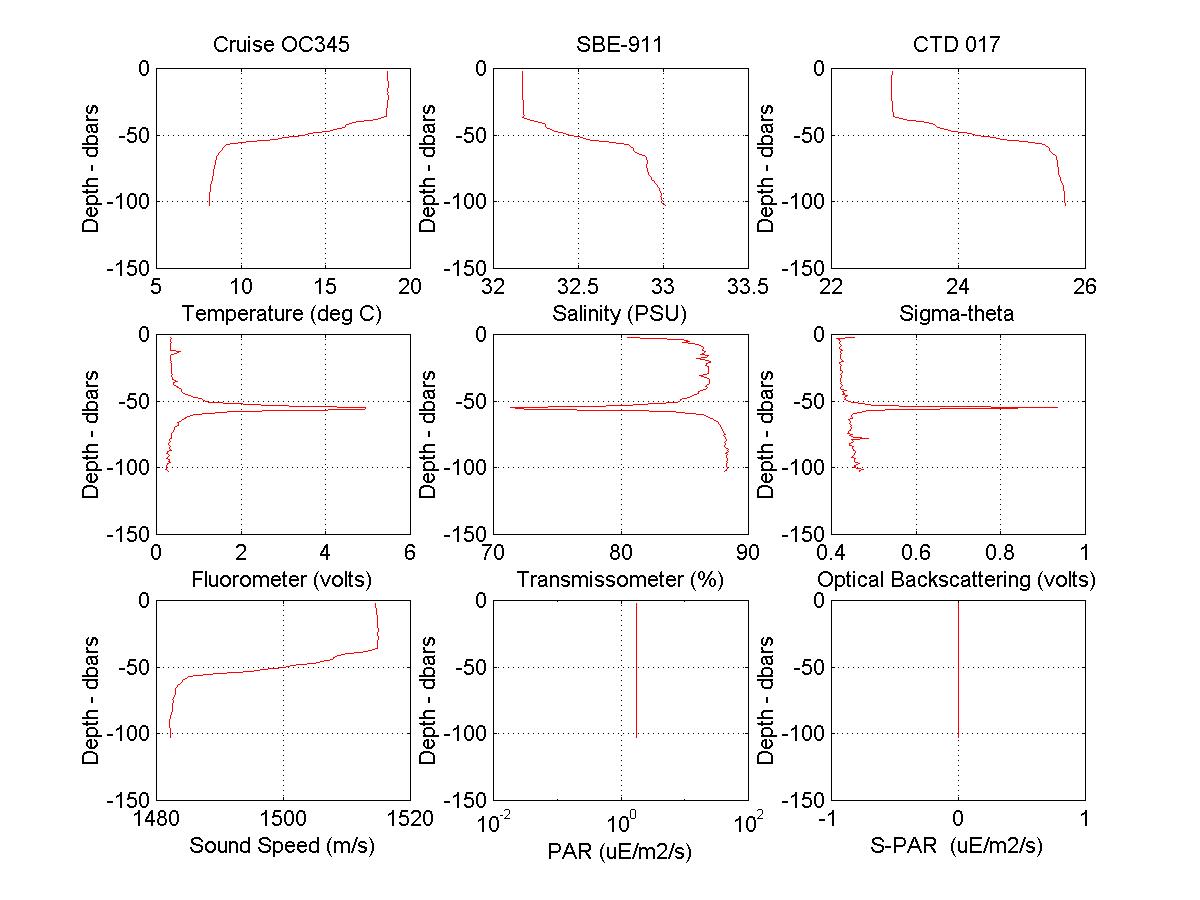
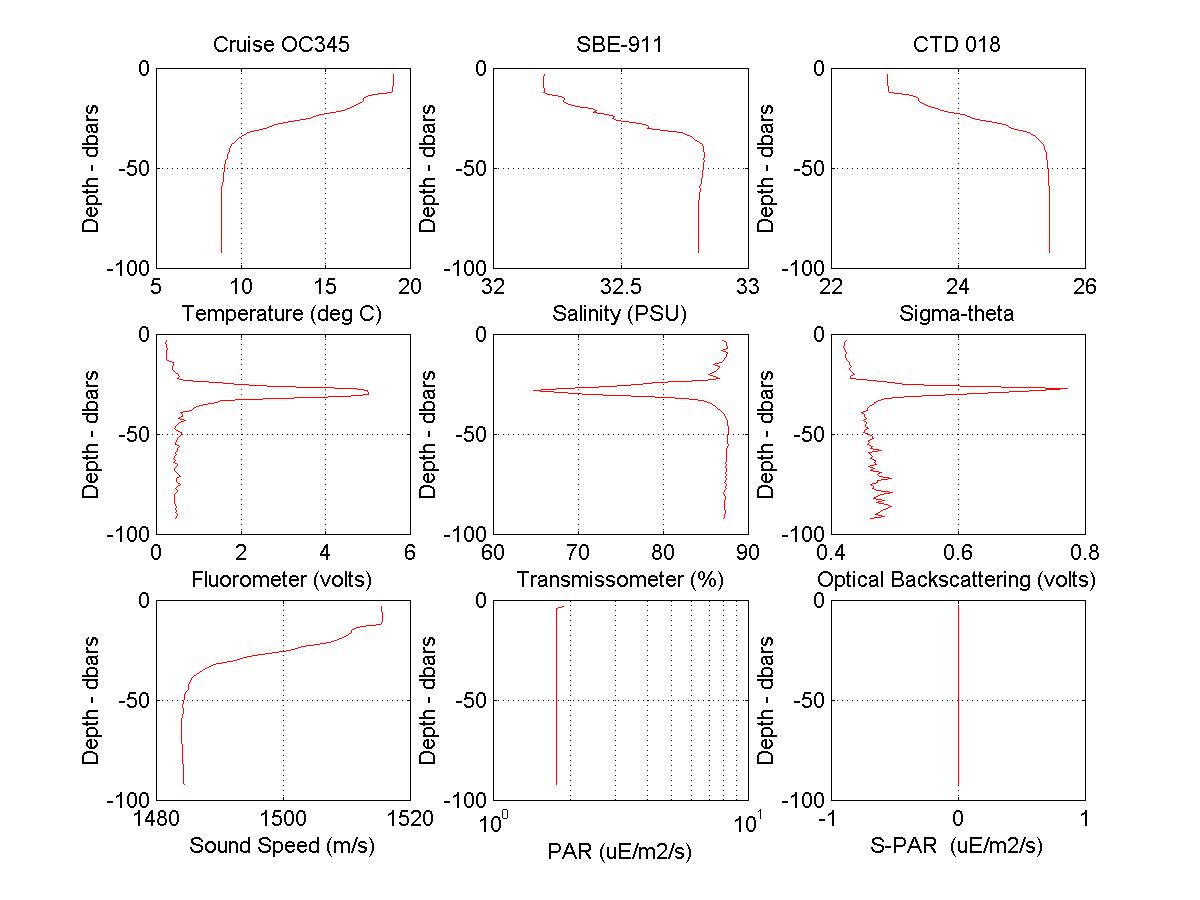
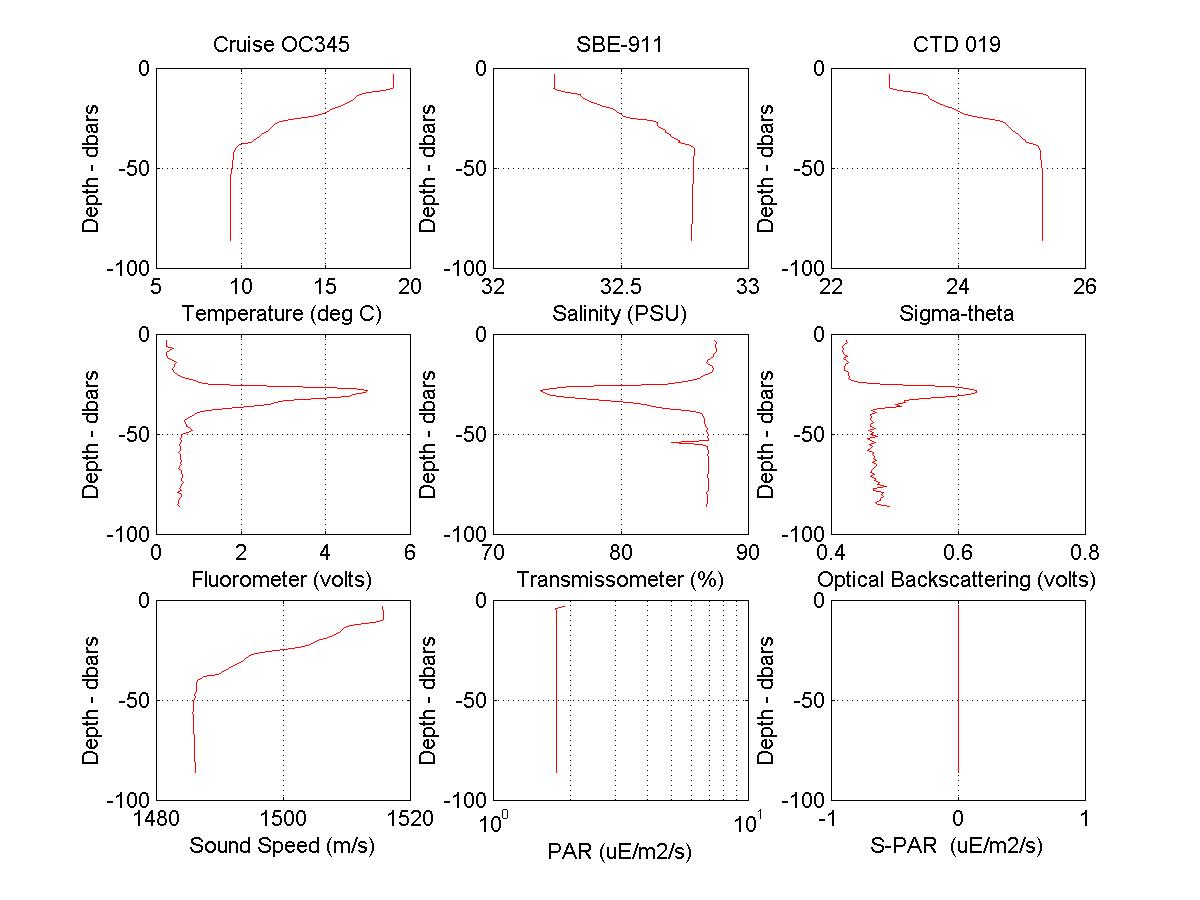
Standard CTD data was collected during Oceanus 345 with a Sea Bird Electronics SBE-911 profiling CTD measuring pressure, conductivity, temperature, light transmission, fluorescence, turbidity and irradiance. At least one seawater sample was collected at each station for calibration of the conductivity sensor on the SBE-911 CTD. Figure 2 below summarizes the comparison between the conductivity measured by the CTD and the in situ conductivity calculated from the water sample bottle salinity using a Guildline Salinometer. The RMS conductivity difference was 0.0032 s/cm and this offset was not applied to the data.

Figure 2. Differences between the CTD conductivity and the seawater sample conductivity during the cruise.
2.2 Hydrographic Station Locations
A total of 33 CTD stations were completed during the cruise along 3 sections radiating outward from the center of the eastern flank of Georges Bank. The locations of the CTD stations are shown in Figure 3.
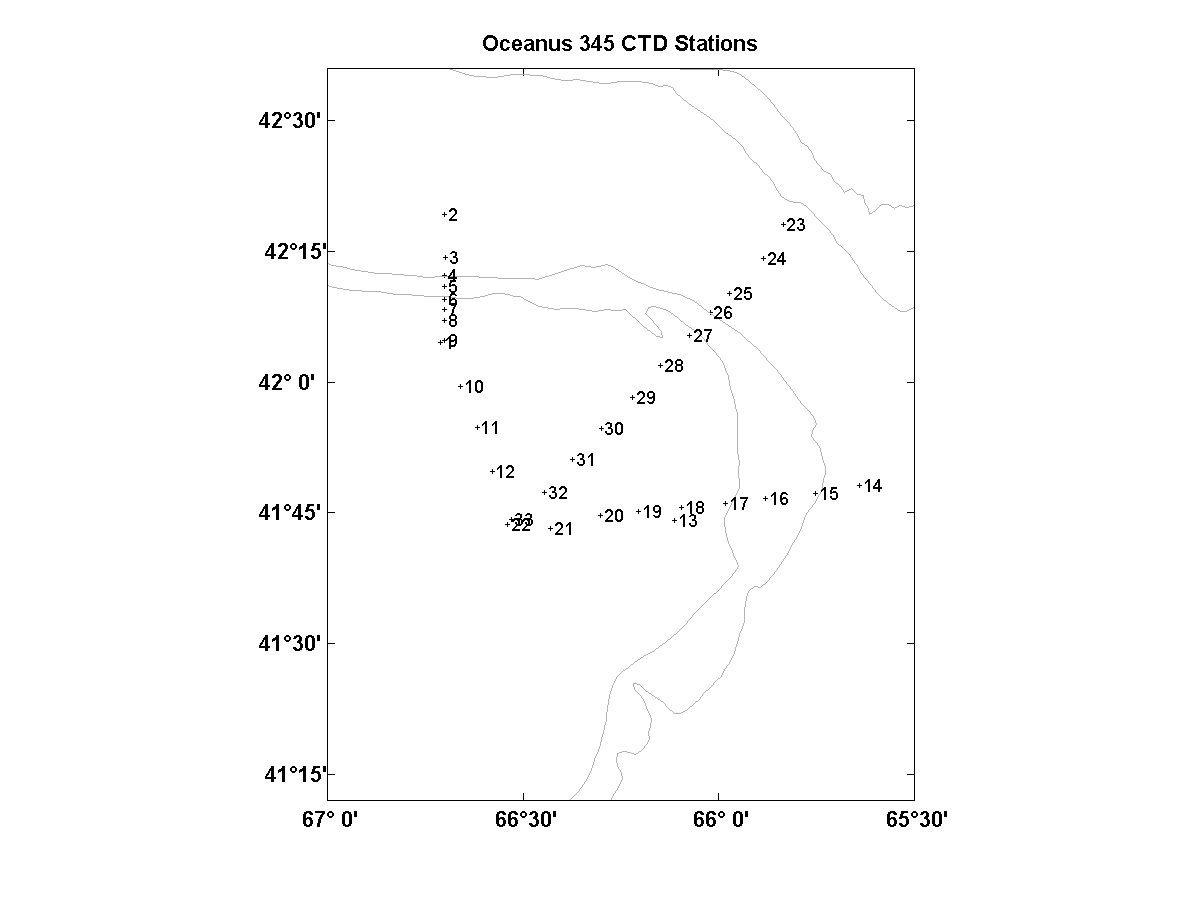
Figure 3. CTD station locations during OC345.
2.3 Surface Temperature and Salinity and Profiles
Near-surface temperature and salinity over the eastern flank of Georges Bank during OC333 are shown in Figure 7.
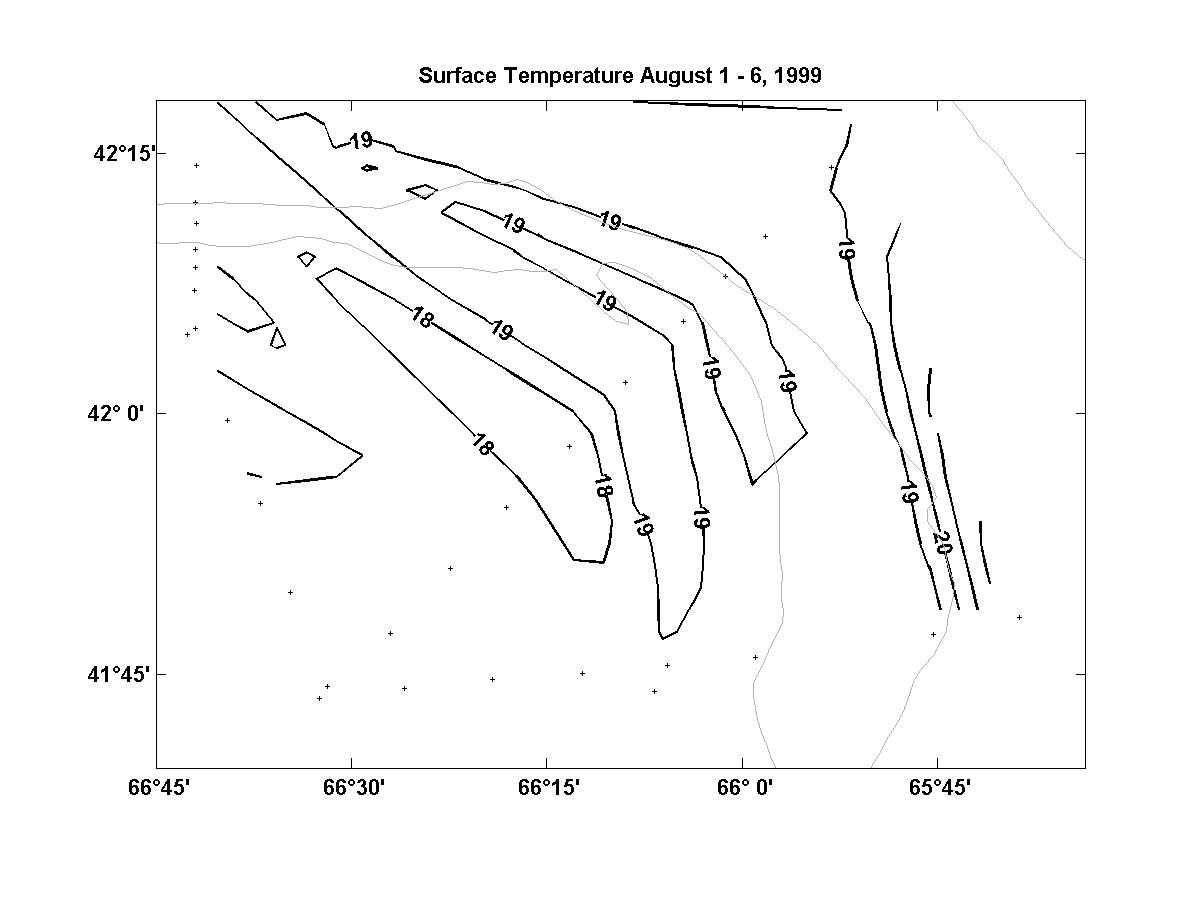
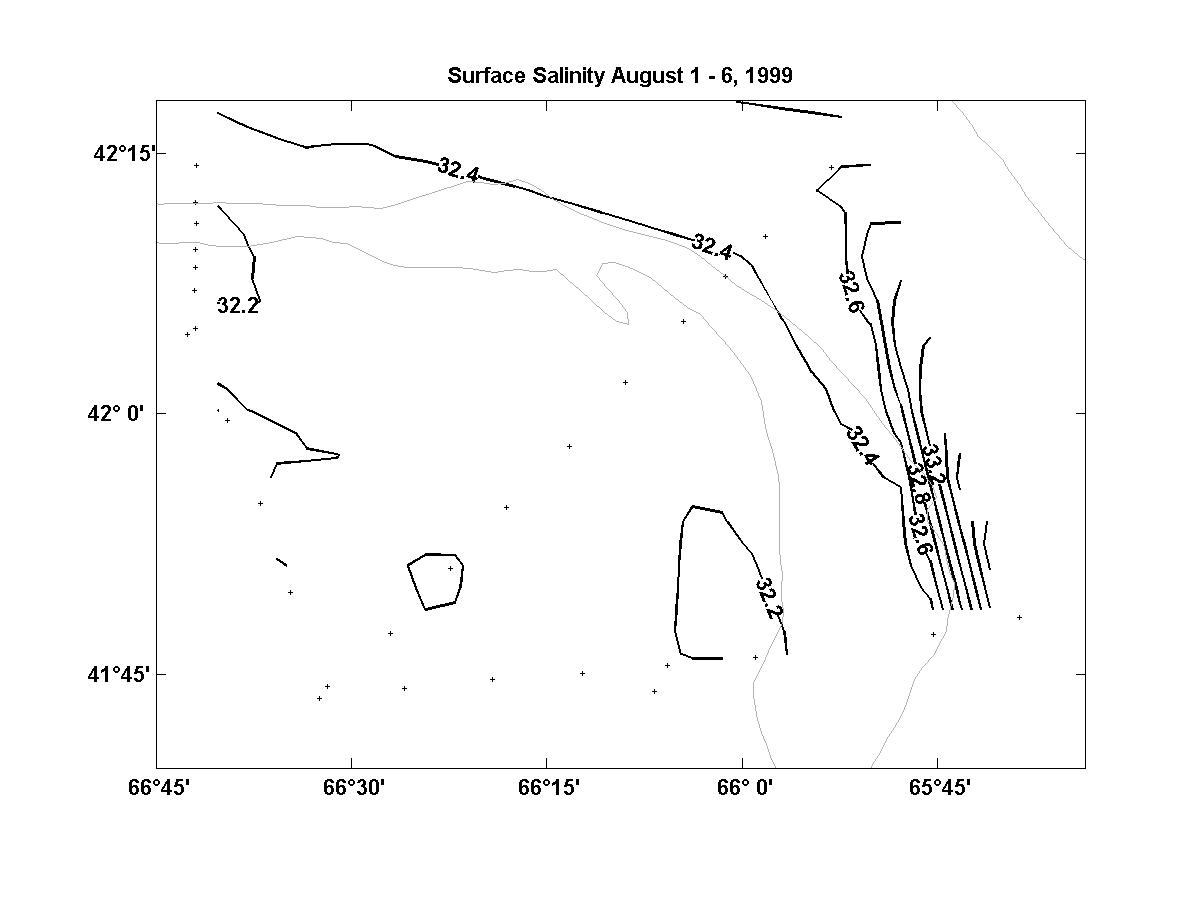
Figure 4. Surface temperature and salinity.
Richard Limeburner, Chief Scientist
Charles Flagg, Scientist
Wil Ostrom, Senior Engineer
Larry Costello, Engineer
Jim Dunn, Engineer
Claudia Cenedese, Post doc
Natasha Grey, NSF Biology
Rochelle Ugstad, Electonic Engineer
Erica Rude, Electronic Engineer
Kristin France, Student
Rachael Stanley, Student
Andrew Thompson, Student
Alex Walsh, EPaint representative
Lawrence Bearse, Captain
Richard Chase, Chief Mate
Horace Madeiros, Boatswain
James Ryder, AB
Peter Liarikos, OS
Patrick Pike, AB
Richard Morris, Chief Engineer
Alberto Collasius, Jr. Engineer
John Kay, Jr. Engineer
Torii Corbett, Steward
EST
1600 – Depart WHOI dock
1630 – Fire and boast drill
1700 – Science meeting
Monday – August 2, 1999
EST
0830 – Wil gave class on deck work
1400 – Arrive at mooring location NSF
1415 – CTD 1 at NFS
1510 – Recovered NFS Guard C
1658 – Recovered NFS Guard O
1818 – Recovered NFS Subsurface
1855 – Deployed GPS drifter 24947
2119 – CTD 2 – Begin north section CTD line
2210 – CTD 3
2246 – CTD 4
2314 – CTD 5
2342 – CTD 6
Tuesday – August 3, 1999
EST
0006 – CTD 7
0031 – CTD 8
0103 – CTD 9
0155 – CTD 10
0242 – CTD 11
0327 – CTD 12
0620 – Recovered NFS Discus
1006 – CTD 13
1029 – Recovered EF Guard
1258 – Recovered EF Discus
1631 - CTD 14
1805 – CTD 15
1839 – CTD 16
2020 – CTD 17
2109 – CTD 18
2153 – CTD 19
2236 – CTD 20
2314 – CTD 21
2354 – CTD 22
Wednesday – August 4, 1999
EST
0833 – Recovered NFD Discus
1105 – 1424 - Dragged for ADCP
1451 – Recovered ADCP
1835 – CTD 23
1924 – CTD 24
2019 – CTD 25
2101 – CTD 26
2138 – CTD 27
2215 – CTD 28
2249 – CTD 29
2325 – CTD 30
2356 – CTD 31
Thursday – August 5, 1999
EST
0033 – CTD 32
0113 – CTD 33
Friday – August 5, 1999
EST
0000 – 0400 – Steamed along cross-shelf line for Paula Fratantoni
0845 – Tied up at WHOI dock
Appendix 1. CTD Station Profile Data
