globec~2.gif
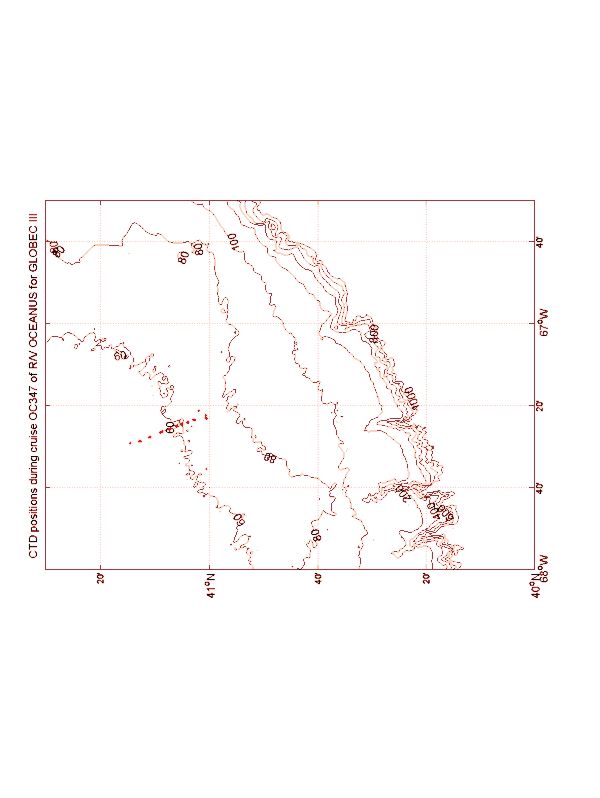
Figure 2. Moored array recovered OC347. The positions for the array first set during OC339 are in red. The second setting during EL9906 is in black.

B. The arrays in relation to the detailed bathymetry along the southern flank. These moorings are designated Sites 1-7 from North to South with particulars presented in Table 1.


globeciii_tripod.jpgFigure 3. A tripod for the array recovered at Sites 1-3 and 5-7 during OC347.


ctd_positions_map_oc347.jpgFigure 3. Positions for CTD casts completed during OC347.

A. Stations in relation to the bathymetry for the southern flank of Georges Bank.

cast_positions_oc347.jpgFigure 4. Positions for CTD casts completed during OC347.

B. Station positions and numbers for CTD casts.

section_temp_1_8oc347.jpgFigure 5. CTD section for stations 1-8 during OC347, 25-31 August 1999. The stars represent the positions of the Sites 1-7 for the moored array as presented in Table 1.

A. Temperature in °C.

section_salt_1_8oc347.jpgFigure 5. CTD section for stations 1-8 during OC347, 25-31 August 1999. The stars represent the positions of the Sites 1-7 for the moored array as presented in Table 1.

B. Salinity in psu.

section_sigt_1_8oc347.jpgFigure 5. CTD section for stations 1-8 during OC347, 25-31 August 1999. The stars represent the positions of the Sites 1-7 for the moored array as presented in Table 1.

C. Sigma-T in kgm-3.

section_temp_9-17oc347.jpgFigure 6. CTD section for stations 9-17 during OC347, 25-31 August 1999. The stars represent the positions of the Sites 1-7 for the moored array as presented in Table 1.

A. Temperature in °C.

section_salt_9-17oc347.jpgFigure 6. CTD section for stations 9-17 during OC347, 25-31 August 1999. The stars represent the positions of the Sites 1-7 for the moored array as presented in Table 1.

B. Salinity in psu.

section_sigt_9-17oc347.jpgFigure 6. CTD section for stations 9-17 during OC347, 25-31 August 1999. The stars represent the positions of the Sites 1-7 for the moored array as presented in Table 1.

C. Sigma-T in kgm3.

section_temp_21_29oc347.jpgFigure 7. CTD section for stations 21-29 during OC347, 25-31 August 1999. The stars represent the positions of the Sites 1-7 for the moored array as presented in Table 1.

A. Temperature in °C.

section_salt_21_29oc347.jpgFigure 7. CTD section for stations 21-29 during OC347, 25-31 August 1999. The stars represent the positions of the Sites 1-7 for the moored array as presented in Table 1.

B. Salinity in psu.

section_sigt_21_29oc347.jpgFigure 7. CTD section for stations 21-29 during OC347, 25-31 August 1999. The stars represent the positions of the Sites 1-7 for the moored array as presented in Table 1.

C. Sigma-T in kgm-3.

seccea~1.gifFigure 8. CTD section for stations 30-39 during OC347, 25-31 August 1999. The stars represent the positions of the Sites 1-7 for the moored array as presented in Table 1.

A. Temperature in °C.

section_salt_30_39oc347.jpgFigure 8. CTD section for stations 30-39 during OC347, 25-31 August 1999. The stars represent the positions of the Sites 1-7 for the moored array as presented in Table 1.

B. Salinity in psu.

section_sigt_30_39oc347.jpgFigure 8. CTD section for stations 30-39 during OC347, 25-31 August 1999. The stars represent the positions of the Sites 1-7 for the moored array as presented in Table 1.

C. Sigma-T in kgm-3.