*****************************************************************************
NOTE: Some tables still need reformatting for Web.
Currently may display better
under Internet Explorer than under Netscape.
(DWS, 2 Sep 2000)
*****************************************************************************
REPORT ON C.S.S. Parizeau
CRUISE 96-024
23-30 September, 1996
by
Peter C. Smith
Ocean Sciences Division
Bedford Institute of
Oceanography Dartmouth, Nova Scotia
CANADA
October, 1996
BEDFORD INSTITUTE OF OCEANOGRAPHY CRUISE REPORT Parizeau 96-024
Local Cruise Designation: 96-024
Vessel: C.S.S.
Parizeau
Dates: 23-30
September, 1996
Area: Southwest
Nova Scotia/Georges Bank
Responsible Agency: Ocean
Sciences Division
Scotia-Fundy
Region, DFO
Ship's Master: Capt.
W. English
Scientific Personnel:
P.C.Smith Ocean
Sciences
M. Scotney Ocean
Sciences
R. Boyce Ocean
Sciences
D. Gregory Ocean
Sciences
B. Nickerson Ocean
Sciences
A. Doiron Ocean
Sciences
J. Chaffey Harding
Scientific
Y. Shen Dalhousie
U.
1. PURPOSE
The scientific objectives of this cruise were:
1) long term monitoring of the
major inflows to the Gulf of Maine, namely the surface inflow from the Scotian
Shelf off Cape Sable and the deep inflow of slope water through Northeast
Channel,
2) determining the
seasonal hydrographic properties along the eastern boundary of the Gulf of
Maine, and
3) measuring the
hydrographic structure over Truxton Swell and in Jordan Basin (if possible) in
order to determine the extent of slope water penetration into Jordan Basin.
The activities planned for
the cruise period include:
1) replacement of
moorings in Northeast Channel (NECE,NECW),
recovery of moorings off Cape Sable (C2), and placement of new moorings on
eastern Georges Bank on the southeast flank (SEF) plus two guard buoys at NEP,
2) performance of a
CTD survey along the eastern boundary of the Gulf of Maine,
including
Browns Bank, Northeast Channel, Georges Basin and Truxton Swell and along the
Halifax Section, and
3) performance of
repeated ADCP transects across Northeast Channel over at least one tidal cycle.
2. NATURE OF DATA GATHERED
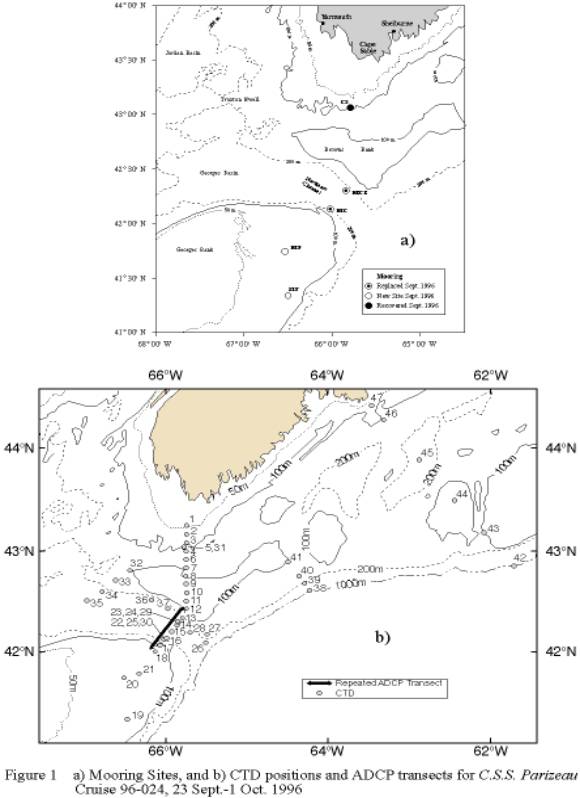
During this cruise, a total
of four complete current meter moorings and four guard buoys were recovered at
two sites in the Gulf of Maine (C2, NECE; see Figure 1a and Table 1a). The
bottom portions of two more current meter moorings (#1207,#1208) at site NECW
were also recovered; the float and top instruments on #1207 had been recovered
earlier by the navy, and the float and top instrument on #1208 are lost. One guard buoy was also missing from NECW;
it had been recovered by the US Coast Guard at Woods Hole. One guard buoy was also missing from NECE
and all three were missing from C2.
In addition, a total of 47
CTD stations (Fig.1b, Table 2) were occupied along:
1) a section from the 50 m isobath
off Cape Sable to the outer edge of Browns Bank (Fig.3),
2) a section across Northeast
Channel from Browns to Georges Bank (Fig.4),
3) a
section across the western flank of Browns Bank (Fig.5),
4) a section following the 200 m
isobath on the eastern side of the Channel, from the mouth to Georges Basin
(Fig.6),
5) a
section across the outer Scotian Shelf off Shelburne (Fig.7),
6) the
Halifax Section (Fig.8), and
7) at
each mooring site.
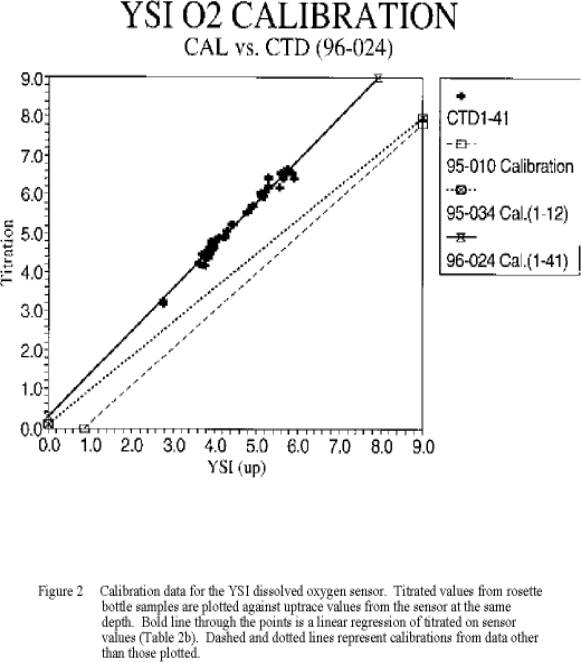
The quality of the CTD temperature
and salinity measurements is quite acceptable (Table 2a), especially
considering the relatively high variability of the standards used. The YSI
dissolved oxygen sensor showed a large offset with respect to the titrated
values from near-bottom samples (Table 2a; Fig.2a), but stable calibrations
were obtained by linear regression of sensor vs. titrated values (Table
2b). The YSI sensor exhibited
occasional noise, spikes, and hysteresis between the up- and downtraces. In addition, roughly 200 oxygen isotope
samples were collected throughout the water column at even numbered stations
(Fig.1b) for Dr. Robert Houghton of Lamont-Doherty Earth Observatory. Nutrient samples were collected throughout
the water column as well at the even-numbered stations.
Twelve repeated ADCP
transects (Table 3) were run over the duration of the cruise along the
mooring/CTD line in Northeast Channel (Fig.1b) in order to monitor the
inflow/outflow over an M2 tidal cycle.
A total of ~32 hrs was devoted to
straight-run transects, with an additional 40 hrs spent on the CTD and mooring
lines. Only processed (averaged) data
were collected over the entire cruise
and stored as 5-min averaged data files. At the start of the cruise, a test of the ADCP transducer
alignment error and amplification factor showed that these values were
acceptable (Table 3a.) .
3. PROGRAM SUMMARY
Date From(UTC) To(UTC) Operation
23 Sept. 1000 0617(24) Depart BIO for C2 site; CTD0
24 Sept. 0617 1701 CTD 1-12 on Sect.Ia
1701 2216 CTD12-18 on Sect.Ib
2234 0513(25) Repeated ADCP transects across NEC
25 Sept. 1010 2015 Mooring operations at SEF, CTD19-21
2100 0910(27) Repeated ADCP transects across NEC, CTD22-23
27 Sept. 0928 1702 Mooring operations at NECE, CTD24
1826 0108(28) Recovery operations at NECW, CTD25
28 Sept. 0329 0707 CTD26-29 on Sect V
0900 1603 Mooring operations at NECW, CTD30
2110 2206 Mooring operations at C2, CTD31
29 Sept. 0118 0025(30) CTD32-41 on Sects.II,V, VI
30 Sept. 0945 2118 CTD42-47 on Halifax Sect.
2300 Arrive BIO
4. MOORING OPERATIONS
The recovery of four
instrument moorings at two sites (C2 and NECE; Table 1a, Appendix B) was
completed without incident. Using
differential GPS positioning with AGCNAV and transponding with the release, it
was possible to locate and retrieve all of the moorings quickly. One partial mooring (#1207 at NECWA),
consisting of just backup buoyancy (BUB) and the release, was also recovered
routinely. The upper portion of the
mooring had been retrieved by HMCS
Nipigon in June. The wire lead
above the BUB appears to have been hit with something sharp and gouged. The deep mooring at site NECW (#1208) was
contacted and released, but did not come to the surface. A subsequent survey revealed that the
release was upright and SE of its original position by 0.5nm. Two attempts to drag the mooring on the
evening of 27 Sept. failed, but a third attempt the following morning was
successful. The partial mooring (Fairey
float and upper RCM were missing) was
badly tangled in longline trawl netting which, along with the tide gauge
lanyard, held the mooring to the anchor.
Record dumps of the instruments indicate that the mooring had been hit
only recently (mid-Sept.). Otherwise,
all the returning moorings were in excellent shape. There were major(minor) amounts of hairy growth on the
instruments at the 20m(50m) levels, but the conductivity cells and rotors were
clean. The “killing tubes” on the
SEACATs seemed to work well, and painting the entire RCM case with antifoulant
kept the growth away from the rotor and conductivity cell. There were no obvious instrument
malfunctions; each had the expected number of words in memory.
Of the original nine guard
buoys, one was missing from each of the NECW and NECE sites, and none of the
three was found at C2. Fisheries Patrol
vessel reports suggest the at least two of the C2 buoys have recently parted,
perhaps due to hurricane Hortense Those
buoys that returned showed the normal signs of wear after a 10-month
deployment. The bushings on the shackle
pins connecting to the hoop under the buoy provided good protection, but the
pin which had no bushing showed only about 3/16” on the ring. This is attributed to the new thicker stock
used for the hoops. The recovery operation itself was hampered by the tangling
of the bottom chain on the moorings.
The resulting large clump at the base of these moorings had to be lifted
separately with the crane. Also, on
those moorings which didn't tangle, it was found that the 1 1/2" chain at
the very bottom would not pass through the block in the A-frame and had to be
lifted separately. Finally, it was
noted that the “S” buoy at NECW was being drawn completely underwater by the
spring tidal currents prior to recovery.
The mooring dynamics should be reevaluated with the new heavier ballast
and with realistic maximum currents.
Unfortunately, the guard
buoy recoveries do not provide much of a test of the new designs placed in
November, 1995 (see Cruise Report, Parizeau
95-034). Originally, one each of
three designs (normal rings, connecting links, and rope bottom) was placed at
each of the mooring sites. Mooring
”L”(rope) at NECW was reported missing early and replaced in January by a
normal design, “S”. Thus the results
may be summarized as:
Site Buoy Type Fate
C2 J normal lost
K connecting
link
“
Q rope “
NECE P normal recovered
(off position by 0.5nm)
R connecting
link recovered
N rope lost
NECW M normal “
O connecting
link recovered
L rope lost (replaced by
S)
S normal recovered
One conclusion is not to use
the rope-bottomed mooring design, since all of these buoys parted for one
reason or another. The pins in two
connecting links were found to be loose, due to corrosion of the spring, and
may have failed shortly, but two of the normal design buoys (M,J) were also
lost. More tests are required, and a
means of minimizing the corrosion on
the connecting links is required for long term deployments.
The placement of the new
moorings (Table 1, Appendix A) was relatively straightforward. Using the DGPS
positions from previous deployments, it was possible to relocate the moorings
in those precise locations with the help of AGCNAV. The sound speed correction for the ELAC sounder on the bridge
was:
true depth = .97533*sounding + 5m (keel depth).
The only mishap during
deployment was the accidental snagging of an outgoing guard buoy chain mooring
line on a clete next to the rail.
Problems/Recommendations:
(1) Alert
fisheries patrol vessels to look and listen for signs of the missing Fairey
float and RCM from mooring #1208.
(2) Maintain
present practice for prevention of fouling, i.e. paint entire RCM case and use
“killing tubes” with the SEACATs.
(3) Re-evaluate
the guard buoy design with heavier ballast and realistic current maxima.
(4) Reject
rope-bottomed guard buoy mooring design.
5. HYDROGRAPHIC MEASUREMENTS
Hydrographic and chemical
measurements were made at a total of 47 stations (Table 2) using a Seabird 9/11
Plus system, equipped with a SBE 23Y Yellow Springs Instruments (YSI) dissolved
oxygen sensor. The data were logged on
a 33 Mhz 486 PC and post-processed between stations using SEABIRD's
software. Once processed, the data were
transferred to the VAX over the network for final tape backup to EXABYTE.
Water column sampling was
accomplished with a General Oceanics 12-bottle rosette. Duplicate nutrient and
oxygen isotope samples were drawn at roughly standard depths on the even
numbered stations only. In addition,
two calibration bottles were tripped at the bottom of each cast for
temperature, salinity and dissolved oxygen (see below).
5a. Processing
The processing and data
transfer to the VAX was initiated by a single command at the end of the
station. This command, called PROCESS,
starts a batch job that sequentially passes the data through a number of
programs. Most were from SEABIRD's SEASOFT package. A few were custom written at BIO. The following is a summary of the processing procedure:
(1) Convert raw frequency data to
binary pressure, temperature and conductivity using SEABIRD's DATCNV program.
(2) Split the file into the up and
down traces using SEABIRD's SPLIT program.
(3) Check downcast for and mark any
'wild' data points with SEABIRD's WILDEDIT program.
(4) Filter downcast conductivity and
temperature using SEABIRD's FILTER program. This is a low pass filter and we
used a time constant of 0.045 seconds for conductivity and 0.15 seconds for
temperature.
(5) Mark downcast scans where the CTD
is moving less than the minimum velocity of 0.10 m/s using SEABIRD's LOOPEDIT
program.
(6) Align downcast pressure,
temperature and conductivity using SEABIRD's ALIGNCTD program by advancing the
conductivity signal by 0.01 sec.
(7) Apply the thermal mass correction
for the conductivity cell using SEABIRD's CELLTM program.
(8) Compute dissolved oxygen in ml/l
using SEABIRD's DERIVE program.
(9) Create WOCE 2-dbar dataset using OSD program PRO-WOCE.
(10) Bin average downcast data to
1.0-dbar intervals using SEABIRD's BINAVG program.
(11) Compute downcast salinity,
potential density(sq), potential temperature(q), and depth using SEABIRD's DERIVE program.
(12) Convert the down cast from binary
to ASCII using SEABIRD's TRANS program.
(13) Convert downcast to ODF format
using PCS program SEAODF.
(14) Create IGOSS message using PCS
program ODF_IGOS.
(15) Prepare batch and command files to
transfer the data to the VAX and create the input for SEABIRD's ROSSUM program
using our customized MAKEFILE program.
(16) Check for bottles, then use ROSSUM
to create the rosette summary file.
(17) Convert the resulting .BTL file to
a format suitable for ingestion into Quattro PRO (.QAT file) using our
customized QPROBTL program.
(18) Create the calibration file of
merged up- and down-cast data using OSD program CALIB.
(19) Perform the FTP transfer of the raw
binary and processed data to the VAX using OSD program CTD.XFER.
(20) Copy Quattro, downcast, and ODF
files to appropriate directories and clean up.
Plots and status info
displayed by the SEASAVE program during the acquisition are discarded when the
program terminates. The post-processing
plotting was not included in the batch job because SEABIRD's SEAPLOT program
requires interactive operator attention.
Plots produced after each station include T, S, O2, and sq vs. pressure and T vs. S.
5b. Calibration
At the base of each CTD cast
two rosette bottles were tripped, one of which carried a pair of digital
thermometers (T878,T881). Salinity samples were drawn from each of the two
bottles and analyzed onboard with an Guildline AutoSal salinometer. The comparison of these standards against
the SeaBird CTD (Table 2a below) shows that, after the removal of several
obvious outliers, the offset in temperature is negligible, but that for
salinity is significantly different from zero. Nevertheless, the standard
deviations about the offsets are small and could be easily be explained by the
differences in the “replicate” standards (the two salinity standards are not
true replicates since they come from different bottles, tripped sequentially),
so the calibrations for both T and S are considered generally acceptable.
The performance of the YSI O2
sensor was similar to that on previous cruises. The surface values on the downtrace were often not fully
equilibrated, there was usually a large hysteresis between the down- and
uptraces in the vicinity of the pycnocline, and there were occasional spikes
from the electronics. The dissolved oxygen samples collected from calibration
bottles were analyzed on board with the automated titration unit borrowed from
Marine Chemistry. These “replicates” agreed to within a standard deviation of
0.05 ml/l (Table 2a). Comparisons
between the YSI measurements and bottle samples revealed a significant offset
between the sensor and titrated values (Table 2a). However, after removal of
significant outliers (based on replicate statistics), a linear regression
analysis of titrated on sensor values at the bottom provides an effective
calibration (Table 2b; Fig.2a) with high correlation and low standard error (±0.12 ml/l).
Problems/Recommendations:
(1) Digital
thermometers should be calibrated more frequently to reduce the differences in
replicate samples.
(2) True
replicate salinity and O2 samples should be drawn in future to
remove the ambiguity involved in assessing the calibration standards.
5c. Sections
CTD sections Ia,b, II, V,
VI, and the Halifax Section (Figs. 3-8) depict hydrographic conditions, 1)
along the eastern boundary of the Gulf of Maine, 2) across the sill in
Northeast Channel, 3) down the western flank of Browns Bank, 4) along the 200 m
isobath on the eastern side of the Channel, 5) across the outer Scotian Shelf
off Shelburne, and 6) across the entire Scotian Shelf off Halifax,
respectively. Section Ia (Fig.3) shows
a strong seasonal pycnocline at mid-shelf (CTD6-10) with weaker, but still
significant stratification, both inshore and along the outer edge of Browns
Bank. At the inshore stations (CTD1,2),
the surface salinities are quite low (~30) and rise in the offshore
direction. The oxygen concentrations
are also low there, but quite uniform elsewhere in the range of
5.0-6.0ml/l. At the outermost stations
(CTD11,12), the pycnocline is disrupted by some mixing process and the presence
of slope water is evident along the edge of Northeast Channel. The cold intermediate water (<4oC) also disappears over the outer shelf.
The distribution of deep
water properties on Section Ib (Fig.4) is counter-intuitive, with slope water
characteristics (T>10oC, S>35, O2<4 ml/l) appearing on the western side of the Channel
(CTD15-16) at depths of 100-200m. On
the eastern side, the properties are dominated by colder intermediate water
centred at 60-80m, and interleaving between the two water masses may be seen in
the T-S trace for CTD15. This
juxtaposition may be indicative of the strongly time-dependent behaviour noted
in these fields in previous surveys (see Cruise Report, Parizeau 95-034). The
surface layer is again isolated by a strong pycnocline which extends onto both
banks. Surface waters on the eastern
side seem to be somewhat fresher and warmer than on the west.
The two shallower stations
on Section II (Fig.5) show properties similar to those found on the outer edge
of Browns Bank (Section Ia), whereas the deeper stations show diluted slope water
such as that in western Northeast Channel.
The salinity maximum occurs at CTD34, near the 200 m isobath. There is also a rather sharp near-surface
salinity gradient between CTD33 and 34, with levels roughly 0.5 higher than on
the Scotian Shelf on in the Channel.
The sloping isopycnals in this area also suggest vertical shear.
The properties along Section
V (Fig.6), from the mouth of Northeast Channel to Georges Basin along the
eastern 200m isobath, are quite variable, showing pockets of slope and cold
intermediate waters at various locations and depths. This is undoubtedly due, in part, to aliasing by the temporal
variability in the Channel. About all
that can be said is that the layer slope water in the Channel, delimited by the
S=34 or 34.5 contour, becomes thinner as it penetrates into the Gulf. However, CTD29 shows the maximum salinities
on the section.
Section VI (Fig.7) shows
that the properties near the Scotian Shelf break off Shelburne are similar to
those on outer Browns Bank and the eastern side of Northeast Channel. The
near-surface temperatures are all in the range of 13-15oC but only
the salinities at CTD39 are as low as those at those at CTD11-14. On either side of CTD39 the near-surface
salinities rise, especially to the offshore.
The three inshore stations also show a pronounced cold intermediate
layer which is severely eroded offshore.
This suggests that the flow along the shelf break provides continuity
between these two regions. Near the
bottom, a thin wedge of slope water appears to protrude up onto the shelf, but
its extent is limited. The dissolved
oxygen field is relatively featureless.
The Halifax Section data
(Fig.8) reveal a sharp discontinuity between the inshore waters (CTD46-47) and
those on the mid- to outer-shelf.
Inshore, a very fresh surface layer (S<30) overlies a very cold
intermediate layer (T=2-4oC), whereas surface salinities and
temperature minima are in excess of 32 and 5oC, respectively, over
the rest of the shelf. The deepest
water in Emerald Basin (CTD45) has temperatures near 10oC and
salinities near 35, whereas offshore the slope water maxima are roughly 12oC
and 35.2. A distinct cold intermediate
layer persists from the mid-shelf into the slope water with 5<T<8oC
and 33<S<34.
6. ADCP TRANSECTS
The RDI ADCP was run
continuously over the cruise in the bottom track mode. The velocity measurements were made in 100
4-m bins below the transducer depth (4.9 m).
In the standard acquisition mode, 10-ping ensembles were averaged over 5
minutes to create processed profiles of velocity, beam intensity, etc. The RDI system appeared to work well over
the cruise.
Twelve primary transects
(Table 3) formed the repeated ADCP section across the Channel, including CTD
Sections Ib and the transits during mooring operations. On these transects, only the averaged
processed data were collected. A total
of 32 hrs was devoted to straight-run transects, with an additional 40 hrs
spent on the CTD and mooring lines (transects 1,4,10-12). Some of the transects (10-12) were
incomplete due to operational constraints.
A calibration of the
transducer alignment and amplification factor was conducted shortly after
leaving BIO, on the straight run down to SW Nova Scotia. The results (Table 3a) show that both these
quantities are negligibly different from their design values of 0 deg. and
1.00, respectively.
Acknowledgements:
We are greatly indebted to the officers and crew of the C.S.S. Parizeau
for their skilled assistance and friendly cooperation, which was vital to the success
of this mission.
TABLE 1. Moorings Deployed During Parizeau Cruise
96024, 23-30 Sept., 1996
Mooring Site N. Lat. Deployment Instrument
No. (Depth,m) W.
Long. Time(Z),Date (Depth,m)
1238 SEFA 41o19.36’ 1351,Sep.25 SCAT1238(24)
(94) 66o28.33’ RCM4600(25)
1239 SEF 41o19.37’ 1438,Sep.25 RCM7592(51)
(96) 66o28.49’ RCM2664(86)
TG343(96)
1240 NECWA 42o07.78’ 1452,Sep.28 SCAT1019(25)
(215) 66o00.91’ RCM7122(26)
1241 NECW 42o07.64’ 1423,Sep.28 RCM7525(54)
(214) 66o00.75’ RCM6400(104)
RCM6411(154)
RCM6412(194)
TG109(214)
1242 NECEA 42o17.72’ 1702,Sep.27 SCAT1237(23)
(213) 65o50.43’ RCM9355(24)
1243 NECE 42o17.87’ 1632,Sep.27 RCM7131(54)
(214) 65o50.79’ RCM4195(104)
RCM4355(154)
RCM5577(194)
TG336(214)
TABLE 1a. Moorings Recovered During Parizeau Cruise
96024, 23-30 Sept. 1996
Mooring Site N.
Lat. Recovery Instrument Comments
No. (Depth,m) W. Long. Time(Z),Date (Depth,m)
1205 C2A 43°02.57' 2123,Sep.28 RCM7127(27) rotor free, hairy growth
(115) 65°46.74'
1206 C2 43°02.74' 2106,Sep.28 RCM3569(45)
“ , “
(105) 65°46.95' RCM5001(95) rotor free
TG821(105)
1207 NECWA 42°07.48' 1857,Sep.27 SCAT595(22) ü cut off,
(211) 66°00.66' RCM7131(23) þ recov.
24/6/96
1208 NECW 42°07.63' 1023,Sep.28 RCM7137(49) lost
(212) 66°00.72' RCM6401(100) dragged up, tangled in net
RCM6407(150) “
, “
RCM7124(192) “ , “
TG1271(212) “ , “
1209 NECEA 42°17.78' 1043,Sep.27 SCAT359(23) hairy
growth
(212) 65°50.44' but
tube clear
RCM4208(24)
1210 NECE 42°17.77' 1008,Sep.27 SCAT365(49) mild
growth
(213) 65°50.69' RCM9607(50) rotor free, “
RCM7651(101) “
, no growth
RCM8697(151) “ ,
“ “
RCM5359(193)
“ , tangled
TG334(213) light growth
TABLE 2. CTD Stations During Parizeau 96024, 23-30
Sept., 1996
Stn. N.LAT. W.LONG. Sound. Date Year Time
No. (m) Day [UTC]
0 44.688 63.641 58 Sep
23 1996 267 16:12:05
1 43.249 65.746 37 Sep 24 1996 268 06:00:37
2 43.165 65.744 46 Sep 24 1996 06:51:38
3 43.084 65.744 87 Sep 24 1996 07:38:33
4 43.000 65.750 118 Sep 24 1996 08:32:37
5 43.033 65.780 114 Sep 24 1996 10:06:56
6 42.918 65.753 145 Sep 24 1996 11:40:42
7 42.834 65.756 100 Sep 24 1996 12:32:03
8 42.752 65.752 97 Sep 24 1996 13:23:52
9 42.671 65.746 83 Sep 24 1996 14:11:01
10 42.585 65.745 87 Sep
24 1996 14:58:10
11 42.499 65.748 82 Sep 24 1996 15:47:05
12 42.425 65.749 92 Sep
24 1996 16:26:12
13 42.335 65.798 195 Sep
24 1996 17:19:47
14 42.266 65.865 221 Sep
24 1996 18:18:23
15 42.198 65.931 219 Sep
24 1996 19:10:16
16 42.132 65.994 221 Sep
24 1996 19:54:42
17 42.063 66.079 90 Sep
24 1996 20:48:48
18 42.002 66.140 84 Sep
24 1996 21:40:38
19 41.325 66.482 89 Sep
25 1996 269 14:39:32
20 41.737 66.520 67 Sep
25 1996 18:31:55
21 41.779 66.341 74 Sep
25 1996 19:44:53
22 42.127 66.032 205 Sep
25 1996 22:20:47
23 42.300 65.860 210 Sep
25 1996 23:58:20
24 42.292 65.852 206 Sep
27 1996 271 09:20:50
25 42.124 66.023 209 Sep
27 1996 18:26:00
26 42.090 65.511 236 Sep
28 1996 272 03:11:43
27 42.177 65.498 109 Sep
28 1996 03:58:56
28 42.192 65.702 212 Sep
28 1996 05:07:19
29 42.299 65.858 207 Sep
28 1996 06:35:01
30 42.125 66.025 200 Sep
28 1996 15:32:45
31 43.039 65.773 113 Sep
28 1996 21:37:39
32 42.802 66.435 84 Sep
29 1996 273 01:00:18
33 42.709 66.613 155 Sep
29 1996 02:30:21
34 42.591 66.778 213 Sep
29 1996 04:00:19
35 42.507 66.961 315 Sep
29 1996 05:48:16
36 42.510 66.181 205 Sep
29 1996 09:07:59
37 42.427 65.980 206 Sep
29 1996 10:47:21
38 42.609 64.223 947 Sep
29 1996 17:34:36
39 42.679 64.294 217 Sep
29 1996 22:10:21
40 42.751 64.364 105 Sep
29 1996 22:54:41
41 42.896 64.501 95 Sep
29 1996 23:58:30
42 42.848 61.737 1008 Sep
30 1996 274 09:44:53
43 43.184 62.100 90 Sep
30 1996 12:17:33
44 43.483 62.449 77 Sep
30 1996 14:18:44
45 43.884 62.884 257 Sep
30 1996 17:01:11
46 44.266 63.318 145 Sep
30 1996 19:33:41
47 44.401 63.466 85 Sep
30 1996 20:46:17
______________________________________________________________________________
TABLE 2a. Temperature and
Salinity Calibration Results for Parizeau 96024
QUANTITY NO. SAMPLES MEAN
DIFF. STD. DEV.
CTD vs. Standard
Salinity:
CTD-AutoSal. 66 -0.023 0.007
Temperature:
CTD-Thermometers 77 -0.001 0.009
Dissolved Oxygen:
YSI-Titration(1-41) 64 -0.73 0.15
Standard vs. Standard
Salinity:
Btl.1-Btl.2. 31 -0.010 0.049
Temperature:
T878-T881 39 0.006 0.004
Dissolved Oxygen:
Btl.1-Btl.2.(1-41) 25 0.00 0.05
______________________________________________________________________________
TABLE 2b. Dissolved Oxygen
Regression Results for Parizeau 96024
Y
= aX+b (Y=titration, X=sensor)
SENSOR(CTD) NO. SAMPLES a±da b(ml/l) ±dY(ml/l) r2
YSI(1-41) 64 1.1011±0.0186 0.2704 ±0.121 0.98
______________________________________________________________________________
______________________________________________________________________________
TABLE 3 Primary ADCP Transects During Parizeau
96-024
NO. DATE STRT END FROM TO COMMENTS
(m-d) (UTC) (UTC) (Lat./Long.) (Lat./Long.)
1 09-24 16:45 22:16 42°26'/65°45' 42°08'/65°59' CTD12-18
2 09- (25) 22:34 01:48 42°00'/66°08' 42°26'/65°45'
3 09-25 01:56 05:13 42°26'/65°45' 42°00'/66°08'
4 09- (26) 21:00 01:22 42°00'/66°08' 42°26'/65°45' CTD22-23
5 09-26 01:25 04:33 42°26'/65°45' 42°00'/66°08'
6 09- 04:43 07:58 42°00'/66°08' 42°26'/65°45'
7 09- 08:04 16:08 42°26'/65°45' 42°00'/66°08'
8 09- 16:12 21:55 42°00'/66°08' 42°26'/65°45'
9 09- (27) 21:57 04:32 42°26'/65°45' 42°00'/66°08'
10 09-27 04:44 09:10 42°00'/66°08' 42°20'/65°51' partial
11 09- (28) 09:28 01:08 42°18'/65°51' 42°08'/66°01' “ ,mooring
CTD24-25
12 09-28 06:48 16:03 42°18'/65°51' 42°08'/66°01' “, “
CTD29-30
______________________________________________________________________________
TABLE 3a.
Straight Run RDI Calibrations for Parizeau 96-024
DATE: 23
September, 1996
TIME MISALIGNMENT
ANGLE AMPLIFICATION FACTOR
(deg.) (-)
21:46:05 -1.360 0.958
21:51:01 -0.838 0.973
21:56:03 -1.055 0.966
22:01:05 -3.497 1.000
22:06:02 -2.997 0.998
22:11:06 -3.340 0.995
22:16:03 -3.315 0.998
AVERAGE -2.375 0.984
______________________________________________________________________________
FIGURE CAPTIONS:
Figure 1 a)
Mooring sites, and b) CTD positions and ADCP transects for C.S.S. Parizeau
Cruise
96-024, 23-30 Sept. 1996
Figure 2 Calibration data for the YSI dissolved
oxygen sensor. Titrated values from rosette bottle samples are plotted against
uptrace values from the sensor at the same depth. Bold line through the points is a linear regression of titrated
on sensor values (Table 2b). Dashed and
dotted lines represent calibrations from data other than those plotted.
Figure 3 Hydrographic
section Ia (CTD1-12) from Cape Sable to the offshore edge of
Browns
Bank.
(a)
temperature,
(b)
salinity,
(c)
sigma-q,
(d)
dissolved oxygen,
(e)
temperature vs. salinity, and
(f)
station map
Figure 4 Hydrographic
section Ib (CTD12-18) across Northeast Channel at the mooring
line.
(a)
temperature,
(b)
salinity,
(c)
sigma-q,
(d)
dissolved oxygen,
(e)
temperature vs. salinity, and
(f)
station map
Figure 5 Hydrographic
section II (CTD32-35) on the western flank of Browns Bank.
(a)
temperature,
(b)
salinity,
(c)
sigma-q,
(d)
dissolved oxygen,
(e)
temperature vs. salinity, and
(f)
station map
Figure 6 Hydrographic section V
(CTD34,36,37,29,28,26) along the slope water inflow axis (~200m isobath) from Georges Basin to the mouth
of Northeast Channel.
(a)
temperature,
(b)
salinity,
(c)
sigma-q,
(d)
dissolved oxygen,
(e)
temperature vs. salinity, and
(f)
station map
Figure 7 Hydrographic section VI (CTD38-41)
across the Scotian Shelf break off Shelburne.
(a)
temperature,
(b)
salinity,
(c)
sigma-q,
(d)
dissolved oxygen,
(e)
temperature vs. salinity, and
(f)
station map
Figure 8 Halifax hydrographic section (CTD42-47) from the Scotian Shelf break to
Halifax.
(a)
temperature,
(b)
salinity,
(c)
sigma-q,
(d)
dissolved oxygen,
(e)
temperature vs. salinity, and
(f)
station map