Session II: Stratification and Its Effects
Bob Beardsley, Chair
Dian Gifford & Ted Durbin, Rapporteurs
Session Summary
Physical Oceanographic Setting. The suite of presentations covered scientific ground as extensive as Georges Bank itself. Jeff Van Keuren showed measurements of the light field on the Bank during development of stratification and related them to the portion of the water column where larval fish, which are visual predators, are able to feed. Jim Bisagni presented a retrospective analysis of SST and stratification on the Bank, and related interannual variability in stratification to differences in heat flux.
Five presentations dealt with various aspects of the program's long- and short-term mooring programs. Jim Irish gave an overview of the long-term mooring program, including Page Valentine's bottom surveys of the mooring sites and preliminary data from the crest and southern flank moorings. Bob Beardsley described the evolution of vertical stratification at mooring site ST1, including resolution of a "salt event". Jim Manning presented preliminary data from mooring site ST2, including measurements of wind stress associated with vertical velocity shear during wind events. Jim Churchill and Sandy Werner described various aspects of the bottom tripod (BASS) system deployed at mooring site ST1, including resolution of stratification events in the bottom five meters of the water column.
Drifter studies were described in two presentations. Jim Churchill reviewed the small-scale drifter program, which assisted the larval fish component in tracking plankton patches and studied small scale fluid dynamics. Peter Garrahan described the short-term drifter deployments performed on the 1994 and 1995 vital rates process cruises.
Two presentations concerned turbulence fields on the Bank. Russ Burgett presented maps of microturbulence measurements done in the spring of 1995 using Neil Oakey's Epsonde probe system. Chris Niemie reviewed model-generated turbulence patterns on the Bank.
Biological Oceanographic Setting. Topics covered ranged from phytoplankton to predators. Mike Sieracki, Scott Gallager, Mark Berman and Ted Durbin described aspects of the biological setting of Georges Bank during the 1994-1995 process cruises, proceeding from the base of the food chain to distributions of crustacean zooplankton. Mike Sieracki described an abundant microbial loop consisting of a diversity of phytoplankton and protozoan taxa which function as prey for larger zooplankton and larval fish. Zooplankton distributions were determined by a variety of techniques including the Video Plankton Recorder (VPR) and the Tracor Acoustic profiling System (TAPS). Scott Gallager described micro- to mesoscale vertical and horizontal distributions of plankton relative to Bank hydrography. The VPR was able to resolve the distributions of a number of fragile forms that are inadequately sampled by more traditional means, including the colonial diatom Chaetoceros socilais , the colonial stage of Phaeocystis pouchetti, and delicate gelatinous zooplankters . Mark Berman reviewed acoustic studies using the TAPS system, emphasizing the abundance of sand grains in the water column on the Bank crest, and the potential problems they cause by interfering with acoustic determination of crustacean zooplankton abundance. Ted Durbin described the age structure of target copepod populations over time, noting that the Bank crest was relatively devoid of copepod naupliar stages. In contrast, nauplii were abundant on the northeast peak and downstream on the southern flank. Irving Kornfeld, a guest from the University of Maine, described genetic effects of fishing on haddock.
Vital Physiological Rates. Presentations concerning vital physiological rates focussed on target zooplankton taxa. Ted Durbin, Dian Gifford, Jeff Runge, Bob Campbell, Melissa Wagner, Elaine Calderone, Scott Gallager, Greg Lough, Lew Incze, Michael Moore, Larry Madin and Grace Klein-MacPhee presented data on various aspects of zooplankton vital physiological rates. A number of presentations dealt with rate measurements of target copepod species. Ted Durbin's mesocosm experiments suggested that copepod growth was food-limited in May-June 1994. Dian Gifford's feeding studies showed that Calanus was primarily a carnivore in May-June 1994, obtaining most of its nutrition from planktonic protozoa. Jeff Runge's data showed that egg production rates were high at all stations in 1995 and that female Calanus produced eggs everywhere on the Bank, but that hatching success of eggs varied, probably as a function of diet. Bob Campbell's growth rate experiments indicated that younger stages of Calanus grow faster than older stages, but that growth was not related to chlorophyll. Larry Madin described patterns of distribution and abundance of invertebrate predators, with emphasis on the hydroid Clytia sp. and the impact of its feeding activities on crustacean zooplankton populations on the Bank. Grace Klein-MacPhee's data demonstrated the impact of predation by the ctenophore Pleurobrachia on crustacean zooplankton, fih eggs, and fish larvae.
Four presentations covered various aspects of the physiology and ecology of larval cod and haddock. Elaine Calderone used an RNA/DNA ratio technique similar to Melissa Wagner's to determine the condition of cod and haddock larvae on the Bank in 1993 and 1994. In 1993 larvae of both species were in good condition overall. In contrast, larvae of both species were in relatively poorer condition in 1994, but condition could not be related to hydrographic conditions. Scott Gallager described the exclusively microzooplankton diet of larval cod before yolk sac absorption. Greg Lough presented a model relating turbulence and larval fish feeding success, and Lou Incze described his May 1992 study of the influence of turbulence on larval cod and their naupliar prey.
Two presentations concerned method development: Melissa Wagner presented data relating food availability to changes in RNA/DNA ratios of Calanus. and Michael Moore reviewed development of his Cell Proliferation Method for measuring copepod growth rates.
Optical Conditions Across Georges Bank, January to July 1995, Including the Influence of Stratification
Jeff Van Keuren
Univeristy of Rhode Island
Surface and subsurface optical conditions over and around Georges Bank, southern Gulf of Maine, were measured during the five GLOBEC Georges Bank Process Cruises extending from early January to late June 1995. Measurements obtained included profiles and near-continuous deck readings of photosynthetically active radiation (PAR), four narrow band UV channels (308nm, 320nm, 340nm, 380nm), and narrow band visible blue-green light (480nm). The purpose of this study was to investigate how seasonal and diel changes in downwelling irradiance in this region influence the distribution and ecology of key species such as cod (Gadus morhua) and haddock (Melanogrammus aeglefinus) larvae and the maturing stages of the copepod Calanus finmarchicus. The waters on the crest of the bank exhibited relatively higher attenuation rates through March followed by much reduced rates as seasonal stratification developed over deeper waters. In contrast, the NE peak and southern flank regions exhibited gradually increasing attenuation coefficients through the same period. These data, coupled with literature values of visual feeding thresholds for these fish larvae, provide an additional index of the depths suitable for first-feeding larvae. Initial comparisons between threshold light levels associated with feeding and ambient noontime light levels on Georges Bank suggest that the high light levels in the upper 10 to 20 meters of the water column may be inhibiting to first-feeding larvae.
Retrospective Analyses of Sea Surface Temperature and Stratification on Southern Georges Bank
James J. Bisagni
National Marine Fisheries Service, Narragansett
U.S. GLOBEC Georges Bank Long-Term Moored Program
Moored Site Bottom Surveys
James D. Irish, Robert C. Beardsley, and Kenneth H. Brink
Woods Hole Oceanographic Institution
U.S. GLOBEC Georges Bank Long-Term Moored Program
First Year Preliminary Mooring Results
James D. Irish, Robert C. Beardsley and , Kenneth H. Brink
Woods Hole Oceanographic Institution
The Long-Term moored program on Georges Bank will provide time series observations of temperature, salinity, currents, winds, radiation at three select locations on Georges Bank to provide the time continuity to complement periodic shipboard surveys, and provide information on long-term variability over the five years of the program. Moorings on the crest, southern flank and northeast peak of Georges Bank, will measure water velocity profiles, temperature and conductivity at 5-meter intervals, and meteorology. Observations of chlorophyll-a concentrations and light are made with a fluorometer, transmissometer, photosynthetically active radiation sensor as well as temperature and conductivity at 10 and 40-meters depths. The first years observations at the crest and southern flank sites have been recovered and are now being processed. The crest mooring was located in 42 m in the tidally mixed region at the southern top of Georges Bank. A steady cooling during the winter and warming during the summer of the water on the bank was seen. This water is a source for mixing with the shelf water over the stratified region on the southern flank. This mooring used compliant element technology to keep the sensors in the high current, high wave, shallow water environment. The southern flank mooring was deployed in 76 meters of water in the stratified region to monitor the stratification variations. During most of the winter the water was well mixed in both temperature and salinity, although Scotian shelf water with cooler fresher T/S can be seen in the upper 35 meters for short times. In the summer, warmer saltier warm core ring effects can be seen in the bottom waters in mid-May 1995, and in the surface water in early July, mid and late August. At the end of September the whole water column shows a sharp increase of 7 C and 2 PSU associated with north Atlantic warm core ring water.
U.S. GLOBEC:
Seasonal Development of Stratified Water on Georges Bank Moored Array
A Preliminary Look at the Vertical Stratification at ST1
Robert C. Beardsley, Steven J. Lentz, Robert A. Weller
Woods Hole Oceanographic Institution
Preliminary processing of the moored array data has started, and with the exception of two of the deeper VMCMs (which returned no data) and both wind sensors which broke around the beginning of June and were fixed about one month later, the overall data return is good.
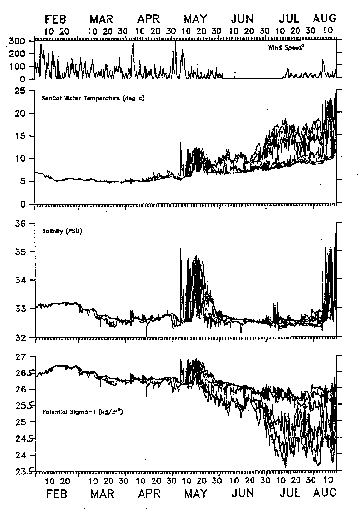
This presentation will focus on the evolution of the vertical stratification at ST1 based on the six SeaCats which were deployed at depths of 1, 6, 11, 26, 46, and 65 m. An overplot of the basic (unedited) SeaCat temperature, salinity, and potential Sigma-T (referenced to 0 db) data (Figure 1) shows that the water column was well mixed (delta Sigma-T <.05) until about March 10 when much of the upper water column became slightly fresher and less dense, with del Sigma-T up to 0.2. Presumably this fresher water originated as part of the large patch of Scotian Shelf water found earlier over the Northeast Peak. A major intrusion of off-shore warmer, very salty (with S as high as 34.7 psu) water (presumably associated with a warm-core ring) occurred throughout the water column during May 730, after which the surface layers started to warm and the seasonal thermocline and pycnocline started to form. In July, the pycnocline varied between roughly 10 and 20 m. In early August, a major intrusion of warm-core ring water occurred, with near-surface temperatures and salinities as high as 24 degrees C and 35 psu.
Figure 1. Overplots of the basic (unedited) SeaCat temperature, salinity and potential Sigma-T (referenced to 0 db) time series. The design depths of the SeaCats were 1, 6, 11, 26, 46, and 65 m. The top panel shows the VAWR 3.5-m wind speed squared as a measure of the surface stress. A value of wind speed squared equal to 300 m2/s2 corresponds to a surface stress of about 8 dynes/cm2.
Preliminary look at ST2 Mooring Data
James P. Manning and David Mountain
National Marine Fisheries Service, Woods Hole
The ST2 mooring (40 57.4N, 67 37.6W, 69 m isobath) was deployed on February 3, 1995. In late July when it was apparently run down by a vessel, the bungy tethers were severed or cut at approximately 57 meters. The upper portion of the mooring drifted for a few months until a fisherman recovered it off the Hudson Canyon approximately 250 miles away. Consequently, 90% of the data was recovered including the lower portion of the mooring (acoustically released as scheduled in 23 August on Endeavor).
Initial look at the seven raw temperature records indicate very little thermal stratification until late May. The biggest signal in the four salinity records is a week-long influx of slope-like water at this same time. The three current records (15, 35, and 62 meters) recorded several wind-driven events during the first half of the deployment including four westward events in March, one eastward event in early April, and a westward event in early May. While the monthly mean flow (Feb-Jul) was affected by these events, the magnitude is still within the low-frequency standard deviations as reported by Butman and Beardsley (1987) for station "A" (1975-79, 85m) on the southern flank. There was a general increase in both the monthly mean magnitude and vertical shear.
Georges Bank Microstructure Measurements, Spring 1995
Russ Burgett1, Neil Oakey2 and Dave Hebert1
1University of Rhode Island
2Bedford Institute of Oceanography, CA
The mixed site showed very little change between the two experimental periods. The site was almost completely unstratified and clearly dominated by tidally generated turbulence at the bottom boundary layer. Very high turbulent kinetic energy dissipation rates, frequently greater than 10**6 W/kg, were observed. At the deeper site stratifacation began to develop between the two cruises with the evolution of a strong thermocline at about 20 meters depth. As at the mixed site the major forcing is tidal with high dissipation rates, greater than 10**6 W/kg , near the bottom decreasing to less than 10**9 W/kg at the base of the thermocline.
The Structure of the Bottom Boundary Layer on the Southern Flank of Georges Bank in Winter: Preliminary Results
Sandra Werner, Robert Beardsley, Jim Churchill, Albert Williams
Woods Hole Oceanographic Institution
The benthic boundary layer structure is investigated over a period of 30 days, from Feb.19 to March 20, 1995, during which the lowest five meters of the water column are homogeneous. A least squares fit of the BASS data to a logarithmic velocity profile results in a time averaged linear regression coefficient of 0.98+/-0.02.
The low-pass filtered, depth averaged flow has a speed of 7.9+/-4.3 cm/s, with the highest speeds occuring when the flow is along-isobath, and the lowest speeds occuring when the flow veers on shore. The major and minor axis of the depth averaged current ellipse are 41 cm/s, and 26 cm/s, respectively. Thus, the low-pass filtered flow is weak compared to the tidal flow, and the structure of the bottom boundary layer is dominated by the tides.
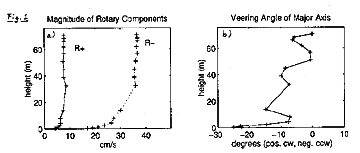
A tidal analysis is conducted on the BASS and VMCM data, and the rotary components of the tidal constituents are computed. The magnitudes and phase angles of the rotary components of the dominant tidal constituent, the M2 tide, are shown in Figure 1. From Figure 1a it can be seen that the boundary layer thickness of the anticlockwise rotating component, R+, is smaller than that of the clockwise rotating component, R-. This is due to the fact that the anticlockwise rotation of R+ enhances the effect of the Coriolis force, while the clockwise rotation of R- opposes it. The major axis of the current ellipse, PHImax , is found to rotate anticlockwise away from the bottom (Figure 1b).
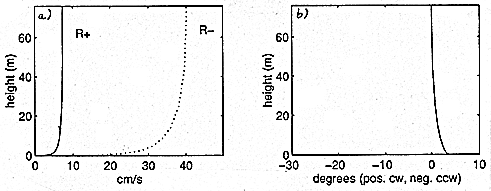
Under the assumption that friction is negligible near the surface, the rotary components are averaged over the top 20 m, and the pressure gradient is calculated from the momentum balance for the averaged components. The results of this calculation show the pressure gradient to be nearly rectilinear and across-isobath. The calculated pressure gradient is used as a forcing term in a simple numerical turbulence closure model. The model is based on a linear eddy viscosity profile and computes the eddy viscosity K to be K=k.. u* .z, where k is von Karman's constant, u* is the maximum friction velocity within one tidal cycle, and z is distance away from the bottom. Model results for the magnitudes of the rotary components and their phases are displayed in Figure 2. (Figure 2a) shows that the magnitudes of the rotary components, and therefore of the major and minor axis of the current ellipse, can be modelled closely with the K-profile model described above. However, the model predicts the major axis of the tidal ellpise to rotate counterclockwise away from the bottom (Figure 1b), while the data shows the veering to be in opposite direction (Figure 2b).
Future work in this study may include an investigation of the vertical structure of the low-pass filtered flow, an investigation of the influence of the low-pass filtered flow on the bottom stress, numerical modelling of the tidal and the wind driven flow, and an attempt to scale the individual terms in the momentum equations.
Water Displacements and Horizontal Dispersion over theSouthern Flank; Results from GPS Drifter Tracking
Jim Churchill1, Jim Manning1,
Ted Durbin2 and Peter Garrahan2
1Woods Hole Oceanographic Institution
2National Marine Fisheries Service
As part of our work in the GLOBEC Stratification Study, we deployed and tracked drifters on four larval tracking cruises. Each drifter was drogued with 6-m long by 1.6-m diameter holey sock set at a mean depth of 15 m. All drifters were equipped with GPS and VHF electronics for positioning and communication, and with an ARGOS PPT to provide backup positioning and communication. Our objectives in tracking these drifters were to: (1) Provide a moving reference point for biological sampling of a larval patch; and (2) Examine small-scale dynamics over the southern flank of Georges Bank, particularly those influencing horizontal shear dispersion.
Data from the thermistors attached to the drifters offer a rare Lagrangian view of the thermal structure of the tagged water parcels. Most remarkable are the rapid changes seen in the thermal stratification of the upper water column. For example, drifter thermistor records from April 1995 show the development and breakdown of a 5 degrees C temperature gradient in the surface 15 m over a period of less than two days.
Using the methods outlined by Churchill (in preparation), we converted the drifter position time series to time series of along bank and on bank velocity. These were also separated into tidal and subtidal frequency bands. As expected, the drifter velocity records are dominated by oscillations of the semidiurnal tide. These oscillations are 50-100 cm/s in magnitude and somewhat stronger (by about 25 %) in the across-bank direction. The sub-tidal drifter motion is usually related to the surface wind stress in the manner expected. An along bank wind directed to the southwest is usually accompanied by an on bank deflection of the drifters and an along bank acceleration of the drifters to the southwest (i.e., classical upwelling circulation). The reverse is typically true when the along bank wind component is directed to the northeast. Currently, we are working with C. Chen to compare the actual drifter trajectories with model drifter tracks.
Detailed, although short-term, views of near-surface flow over the southern flank are provided by the tracks of two drifter clusters set out during the May 1995 cruise.
Tracks of the first cluster, consisting of 4 drifters set out near the GLOBEC mooring array, reveal a jet-like westward current with speeds exceeding 50 cm/s. This current appears to have been centered on the shelf-edge front, which extended 10-15 km on bank of its typical location. This feature likely had a significant impact on the southern flank's larvae population, as it was a convergent flow which drew water to the shelf-edge front and carried it westward at a rate of more than 40 km/day. Clearly not driven by the local wind stress, this flow may have forced by the warm-core ring which was situated a short distance off bank.
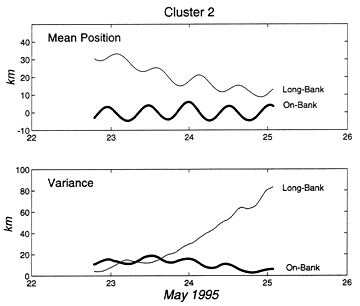
Data from the second cluster, which consisted of 6 drifters deployed in a 3.5 km square area, allow examination of small-scale dispersion over the southern flank. The role of tides in advecting and mixing this cluster can be deduced by comparing the record of the cluster's mean position with the variance of the drifter locations with respect to the mean position (Figure 1). While tidal oscillations are prominent in the both the on bank and along bank components of mean position, they make relatively minor contributions to changes in position variance. This implies that the tide varies on a spatial scale much larger than the cluster size. The plot of cluster variance further shows anisotropic dispersion of the cluster, marked by a significant stretching of the cluster in the along-bank direction coupled with a compression of the cluster in the on-bank direction. The rate of increase in the along-bank cluster variance gives an along-bank horizontal diffusion coefficient of 3 x 106 cm2s. In future work, we will compare dynamical properties determined from the cluster data (i.e., correlation time-scales, velocity convergence, etc.) with those determined from the moored instrument records.
ARGOS-GPS Drifter Tracks During Zooplankton Process Cruises - 1995
Peter Garrahan and Robert Campbell
University of Rhode Island
Model Generated Turbulence Patterns on Georges Bank
Christopher E. Naimie1, Daniel R. Lynch1 and Francisco E. Werner2
1Dartmouth College
2University of North Carolina
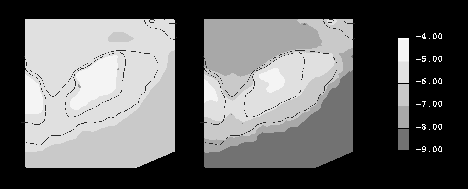
Turbulence patterns on Georges Bank vary on a number of spatial and temporal scales. Herein, we examine numerically computed results for winter (January-February) and summer (July-August) conditions to quantify the patterns predicted by the model for these contrasting periods and examine the relative importance of the tide, wind, and stratification in establishing the turbulence on the bank. The computations are performed using a prognostic (i.e. including tidal-time advection of the density field), free surface, nonlinear, finite element model on realistic Georges Bank topography. The dynamics included in the simulations result from the M2 tide, baroclinic pressure gradients, wind stress, up-stream boundary conditions, and advanced turbulence closure.
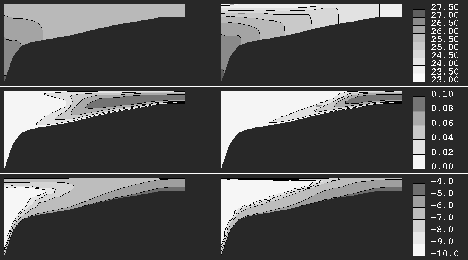
The M2 tide is a dominant mechanism in establishing the turbulence fields on Georges Bank. Turbulence induced by the tidal currents mixes the crest of the bank during the winter and summer simulations, resulting in vertically averaged turbulent dissipation rates exceeding 10**-5 W kg-1 for the crest of the bank (Figure 1) and near-bottom turbulence dissipation rates which exceed 10**-5 W kg-1 for most of the southern flank transect (Figure 2 - bottom panels).
Stratification reduces the vertical mixing in the summer simulation, trapping the tidally generated turbulence below the pycnocline and resulting in a tidal front near the 60 m isobath (Figure 2 - right panels).
Stratification is much less of a factor in the winter simulation, with the fluid remaining vertically well-mixed within approximately the 100 m isobath (Figure 2 - left panels).
Wind increases the turbulence in the near-surface region, with the vertical penetration of the wind generated turbulence depending on the strength of the wind relative to the intensity of the stratification. In the winter simulation, the climatological wind stress of approximately 0.1 Pa results in vertically averaged turbulent dissipation rates exceeding 10**-5 W kg-1 within nearly the entire 60 m isobath (Figure 1 - left panel) and significant enhancement of the near-surface turbulence (Figure 2 - lower left panels). The climatological summer wind stress, which is roughly an order of magnitude smaller, only effects a very thin near-surface layer (Figure 2 - lower right panels).
In the summer, tidal-time variations of the turbulent kinetic energy dissipation rate at depth approach one order of magnitude within the vertically well mixed region (Figure 3 - top panel - shown for a depth of 40 m) and two orders of magnitude in the stratified region (Figure 3 - bottom panel - shown for a depth of 80 m).
Figure 1. Vertically averaged turbulent kinetic energy dissipation rate (LOG10 [W kg**-1]) contour plots for climatological winter (left panel) and summer (right panel) conditions on Georges Bank (the 60 and 100 m isobaths are included for reference).
Figure 2. Southern flank cross-bank transects of density (top panels; ÿt), vertical eddy viscosity (middle panels; m2 sec-1) and turbulent kinetic energy dissipation rate (bottom panels; LOG10 [W kg**-1]) for winter (left panels) and summer (right panels). The transects extend from a minimum depth of less than 40 m on the crest of the bank to a maximum depth of 200 m on the southern flank.
Figure 3. Vertical structure of the turbulent kinetic energy dissipation rate (LOG10 [W kg**-1]) as a function of time (horizontal axis) for the summer simulation at two locations on the southern flank transect shown in Figure 2. The total depth for the upper (lower) panel is 40 (80) m. The temporal duration for the plots is two tidal periods.
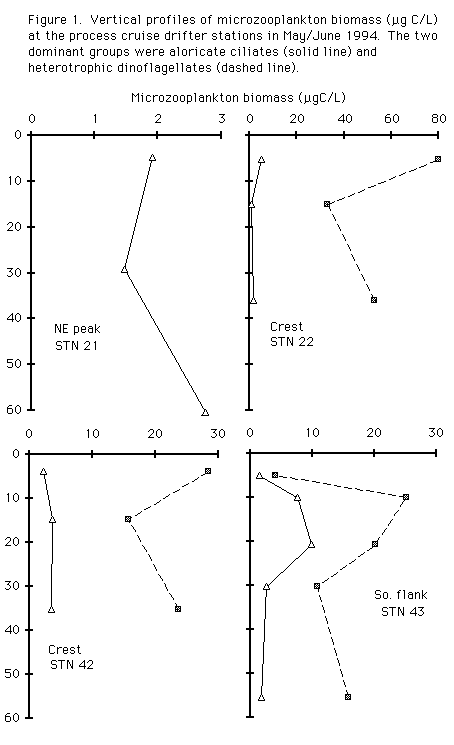
Vertical Distributions of Phytoplankton, Nanoplankton, and Microzooplankton
Michael Sieracki1, Dian Gifford2, Terry Cucci1, Jeff Van Keuren2, Jeff Brown1,
Elin Haugen3, Richard Bohrer
1Bigelow Laboratory for Ocean Science
2University of Rhode Island
3Duke Marine Lab
Total chlorophyll levels ranged from around 0.6 µg chl/L at the northeast peak, to over 1.0 at the subsurface maximum at the stratified southern flank station. From 67 to 94 % of the chlorophyll passed through a 20 µm mesh and a large portion of that passed a 5µm mesh. Nanoplankton (Table 1) and microzooplankton (Figure 1) biomass showed distributions similar to chlorophyll with lowest biomass at the northeast peak and highest at the subsurface sample at the stratified southern flank station. In the microzooplankton heterotrophic dinoflagellates dominated over aloricate ciliates at all stations except the NE peak (Figure 1). In general heterotrophic biomass was high and constituted a large potential resource for meso- and macrozooplankton.
There was a dense patch of Chaetoceros socialis colonies mapped by the VPR on the southern flank of the bank below about 20m. Chlorophyll measurements were made on individually picked colonies and yielded a mean of 250 pg chlorophyll per colony (range 120 - 490, n = 45 colonies), and 550 pg phaeophytin per colony (range 19 - 1160 pg).
Video Plankton Recorder Studies on Georges Bank in 1995
Scott M. Gallager, Cabell S. Davis, Carin Ashjian, Hide Yamazaki,
Philip Alatalo, and Andy Girard
Woods Hole Oceanographic Institution
The goals of the Video Plankton Recorder (VPR) studies on Georges Bank are: 1) To quantify seasonal changes in the micro-scale to meso-scale vertical and horizontal distribution of plankton in relation to the prevailing hydrography on Georges Bank; 2) To non-invasively sample and quantify the distribution of fragile forms such as marine snow, gelatinous zooplankton, large diatom colonies, and diatom chains; and 3) To observe and quantify plankton behavior in relation to turbulence to further our understanding of the mechanisms of plankton patch formation.
As part of the process studies of the Northwest Atlantic GLOBEC program, five cruises to Georges Bank were made between January and July, 1995 . The VPR conducted linear transects and three dimensional grid patterns while following a drogue at standard stations on each cruise including the Northeast Peak, the Well-Mixed Area, and the Southern Flank. In addition, a 100 nm-long cross bank transect from the Slope water southeast of the Northern Peak to Georges Basin in the Gulf of Maine requiring 27-30 hrs of recording time was completed on four out of the five cruises. Over 700 hrs of video data were collected during the 1995 field season. On most cruises, all hydrographic (CTD) and environmental (fluorescence and light transmission) data collected by the VPR were stored and displayed in real-time as the ship steamed at 4 to 6 kts. A real-time image processor culled, stored, and displayed in-focus images of plankton and seston from the live video signal. Taxonomic identification of stored images is in progress using both manual and automated analyses. During June, 1995 the effects of vernal stratification and ring entrainment on plankton abundance and behavior were examined using both towed and ROV deployments of the VPR. A VPR towyo transect was made from the stratified southern flank of Georges Bank southward into the Slope Water. The transect was made along the axis of a shelf water streamer pulled off the bank by a warm core ring. At the base of the streamer, near the edge of the shelf (100 m isobath), in situ observations of plankton and seston movements were made using a 2-axis VPR mounted on the ROV JASON. The hydrographic data revealed that bank water including its characteristic subsurface cold pool had been pulled well off the shelf together with the associated bank plankton community (Figure 1). The dominant copepod, Calanus finmarchicus, occurred primarily within and above the thermocline, and a dense layer of large algal colonies (Chaetoceros socialis), having very high fluorescence, was observed along the transect in association with the thermocline. In situ observations revealed that physical turbulence (calculated from passive particle motions in three dimensions) was low (order 10 8 w kg**-1) within the thermocline and high (order 10**-5 w kg**-1) in the sheared layer both below and above the thermocline.
Animal swimming abilities were observed to be far greater than ambient turbulent motions even in what is traditionally thought to be high levels of turbulence (Figure 2). Animal abundance was highest in the low turbulent regions. Visually, the water in the thermocline appeared to have no observable motion, while the water motion in the "highly turbulent" regions was characterized by very slow movement of passive particles.
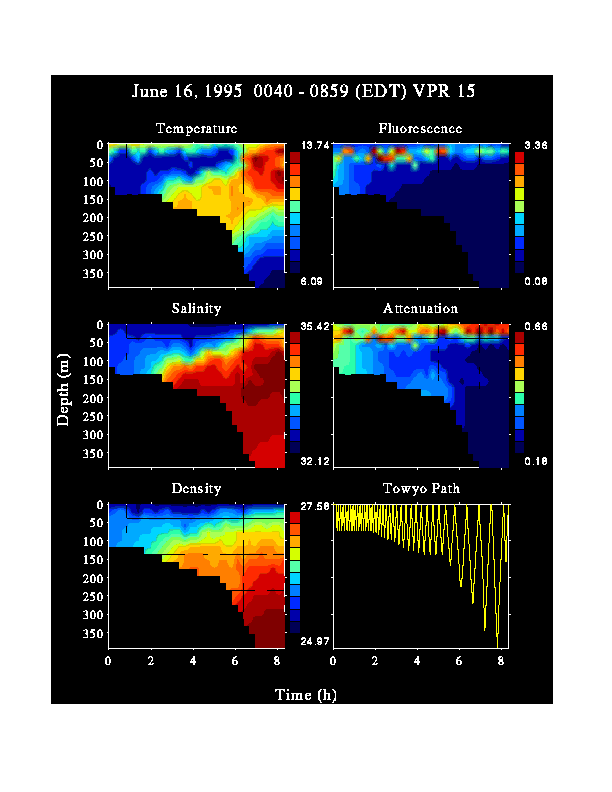
Figure 1. Temperature, fluorescence, salinity, attenuation, density, and towyo path of the VPR for VPR 15 on June 16, 1995. Transect was made from the Southern Flank station southward into the Slope Water. Note the warm-core ring in the upper right hand corner of the temperature plot. The ROV Jason was deployed at a point along the transect coinciding with the 2 h tic mark.
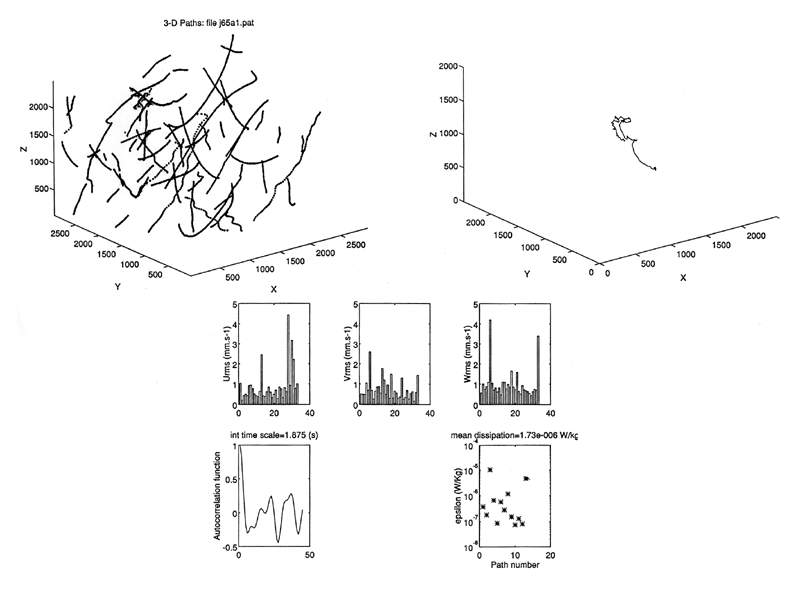
Figure 2. Top left: Three-dimensional particle paths from the 3-D VPR on ROV Jason deployed at the 2 h mark on VPR 15. Depth is 40 m in region of high fluorescence. Axis dimensions are in microns. Top right: Trajectory of juvenile Calanus sp. subsampled from paths at left after subtracting mean flow vector. Bottom: Urms, Vrms, and Wrms fluctuating velocity calculated along the length of each path. Autocorrelation function used to calculate integral length scale. Energy dissipation (epsilon) for each path. Epsilon = 1.1x10**-5 W Kg**-1 for the copepod compared with a mean of 1.73x10**-6 W Kg**-1 for all paths.
Fine Scale Distribution of Plankton On Georges Bank
Mark S. Berman1, John R. Green1, and D. Van Holliday2
1NMFS/Narragansett
2Tracor Applied Sciences
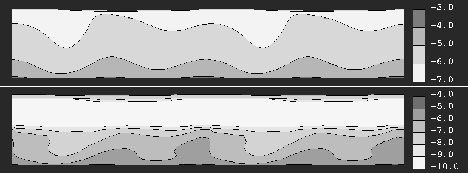
Analysis of data collected during previous cruises show that in the stratified region of the southern flank of Georges Bank plankton biomass is concentrated into small patches, closely associated with the thermocline. We have observed patches (Figure 1) ranging in size from about 10 to 250 m horizontally, and 2 to 5 meters vertically. Biomass within a patch can be as dense as 500 mm**3/m**3, while plankton biomass between patches is typically less than 100 mm**3/m**3. TAPS data have not revealed similar patches in the well mixed area, but the presence of large amounts of sand in the water column there may have masked the distribution of the plankton.
We are now developing a multi-model version of software that converts mean volume backscatter to particle size frequency spectra. The modified inversion routine should be able to separate the signals from the copepods and sand particles, allowing better characterization of the plankton in the mixed area.
Figure 1. A false color representation of the distribution of Psuedocalanus sized particles in the stratified area of the southern flank of Georges Bank. Data were collected while the ship was drifting, so time (x axis) can be related to distance. Contour lines represent water temperature. The large patch of Pseudocalanus near the surface is approximately 200 m long.
Late Fall-Early Winter Recruitment of Calanus finmarchicus on Georges Bank
Ed Durbin1, Jeff Runge2 , Robert Campbell1, Peter Garrahan1, M. Casas1, Teresa Rotunno1, S. Plourde2
1University of Rhode Island
2Institut Maurice-Lamontagne, CA
Phytoplankton and Protozoa in the Diet of Calanus finmarchicus on Georges Bank: June 1994
Dian J. Gifford1 and Michael E. Sieracki2
1University of Rhode Island
2Bigelow Laboratory for Ocean Science
Total chlorophyll a was generally less than 2 µg/L at both sites. At least half of the chlorophyll standing stock was <5 µm in size in all experiments. The nanoplankton was dominated by cyanobacteria and heterotrophic flagellates. The microphytoplankton consisted primarily of large centric diatoms. The microzooplankton assemblage was dominated by aloricate choreotrich ciliates >5 µm. Heterotrophic dinoflagellates of the genus Protoperidinium were abundant, as was the autotrophic ciliate Mesodinium rubra. The prey field is described in more detail in a separate abstract by Sieracki, Gifford and Cucci. Feeding effort was concentrated on particles >5µm. Clearance rates of Calanus on protozoan prey greatly exceeded clearance of bulk chlorophyll, a pattern observed in similar studies of other copepod species. Per capita ingestion rates indicated that, except in experiment 2, late stage C. finmarchicus copepodids consumed >100 µg C/copepod/day
(Figure 1),
an amount well in excess of basic metabolic requirements. Again, except for experiment 2, daily carbon ingestion ranged from 50-150% of body carbon. In most experiments, the majority of carbon ingested was derived from protozoan prey, indicating that in late spring, Calanus finmarchicus on Georges Bank are primarily carnivorous. Overall, Calanus finmarchicus females and C5s were not food-limited before the onset of water column stratification. Despite this, egg production rates were suppressed until after the development of stratification and a chlorophyll maximum at ~20 m. (Figure 2, provided by our GLOBEC colleague Jeffrey Runge). The overall taxonomic composition of copepod diet was similar during the duration of field studies. However, after the onset of stratification and development of the chlorophyll maximum, the proportion of ciliates and heterotrophic dinoflagellates in the diet increased considerably (Figure 3), and may account for the increased egg production at this time.
Figure 3:
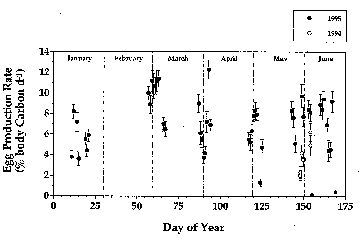
Calanus Recruitment Rates on Georges Bank: January-June 1995
Jeff A. Runge1, S. Plourde2 and Ed Durbin3
1Institut Maurice Lamontagne, CA.
2Université du Québec à Rimouski, QC
3University of Rhode Island
Figure 1. Weight-specific egg production rates measured during process cruises on Georges Bank (filled circles: 1995; open circles: May-June, 1994). Female body carbon measured directly: egg carbon mass assumed to be 0.23 µg. Rates are unadjusted for seasonal changes in ambient temperature.
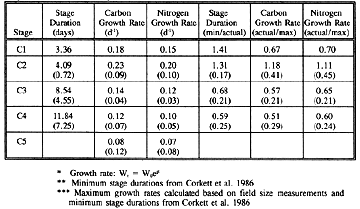
Molting and Growth Rates of Calanus finmarchicus Copepodites on Georges Bank
Robert G. Campbell, Edward G. Durbin, D. Avery, G. Teegarden, Peter Garrahan, Jim Gibson, and Melissa Wagner
University of Rhode Island
Table 1. Stage durations and growth rates of Calanus finmarchicus copepodites (C1-C5) on Georges Bank from January - June, 1995. Molting rates were converted to stage durations to enable direct comparisons with laboratory measurements. Actual measurements and actual measurements compared with minimum stage durations or maximum growth rates for the temperatures at which the experiments were conducted are shown (mean ±sd).
| Stage | Stage Duration (days) | Carbon Growth Rate (d**-1) | Nitrogen Growth Rate (d**-1) | Stage Duration (min/actual) | Carbon Growth Rate (actual/max) | Nitrogen Growth Rate (actual/max) |
| C1 | 3.36 | 0.18 | 0.15 | 1.41 | 0.67 | 0.70 |
| C2 | 4.09 (0.72) | 0.23 (0.09) | 0.20 (0.10) | 1.31 (0.17) | 1.18 (0.41) | 1.11 (0.45) |
| C3 | 8.54 (4.55) | 0.14 (0.04) | 0.12 (0.03) | 0.68 (0.21) | 0.57 (0.21) | 0.65 (0.21) |
| C4 | 11.84 (7.25) | 0.12 (0.07) | 0.10 (0.05) | 0.59 (0.25) | 0.51 (0.29) | 0.60 (0.24) |
| C5 | 0.08 (0.12) | 0.07 (0.08) |
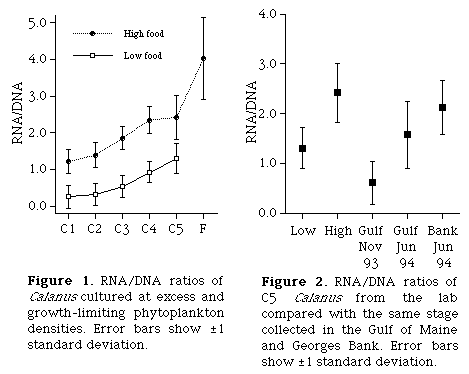
Effects of Food Density on Nucleic Acids of the Copepod Calanus finmarchicus: Implications for Estimating Growth Rates
Melissa M. Wagner1, Edward G. Durbin1, and Lawrence J. Buckley2
1Graduate School of Oceanography, University of Rhode Island
2NOAA-CMER Program and National Marine Fisheries Service, Narragansett
We are investigating the relationship between RNA content and growth rates of Calanus finmarchicus. RNA may provide a simple way to estimate growth rates of this species in the field. To evaluate the effect of nutritional condition on nucleic acid content of C. finmarchicus, we measured DNA and RNA in individual copepodites that were cultured at excess and growth limiting phytoplankton densities. Total DNA, total RNA, RNA/DNA, and length were significantly different between the food levels for stages C2-C5.
The laboratory cultures were compared to copepods collected from Georges Bank and the Gulf of Maine in 1993 and 1994. RNA/DNA ratios of diapausing C5 C. finmarchicus were lower than ratios for food-limited laboratory cultures, while animals collected in the summer had ratios intermediate between the lab treatments. Our data (
Figure 1) support using RNA as a condition index for zooplankton and they encourage further investigation of RNA as a growth rate indicator.
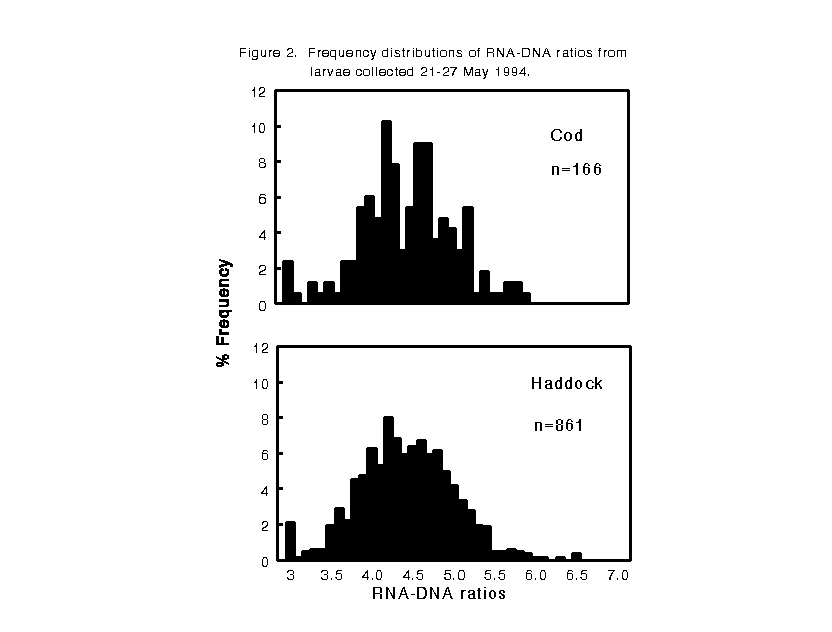
Nutritional Condition of Cod and Haddock Larvae from Georges Bank during May, 1993 and May, 1994.
Elaine Caldarone1, Kate Lindner1 and Lawrence Buckley2
1National Marine Fisheries Service, Narragansett
2NOAA-CMER Program and National Marine Fisheries Service, Narragansett
In May 1994, larvae were collected from a shoal well-mixed area on the southern flank of Georges Bank (41 7.0'N, 67 38.0'W) and a nearby deeper site (40 55.0'N, 67 35.0'W) where stratification was developing in the top 20 m. In contrast to 1993, larvae throughout the sampling area appeared to be in poor condition. 80% of the fish had RNA-DNA ratios between 3.7 and 5.1, and 27%-30% were less then 4.1 (Figure 2). During both years, no significant difference was observed in either cod or haddock RNA-DNA ratios between the shoal and deeper sites. There were no significant differences in RNA-DNA ratios between larvae collected in day and night tows, between different 10 m depth strata sampled, or between the two species at each site in any given year. Mean RNA-DNA ratios were 4.4 in 1994 and 5.4 in 1993, suggesting more rapid growth during the 1993 sampling period.
Laboratory calibration studies have been completed and will be used to convert the RNA-DNA ratios to growth rates. Once the prey field data becomes available, we will investigate relations between larval growth rate, observed prey distributions, and the physical environment.
Microzooplankton in the Diets of Cod Larvae
Scott M. Gallager, Ione Von Herbing, Linda Davis and Philip Alatalo
Woods Hole Oceanographic Institution
Is There an Optimal Relationship Between Turbulence and Larval Fish Feeding Success?
Greg Lough, David Mountain, Elisabeth Broughton, B. Burns, and Maria Kiladis
National Marine Fisheries Service, Woods Hole
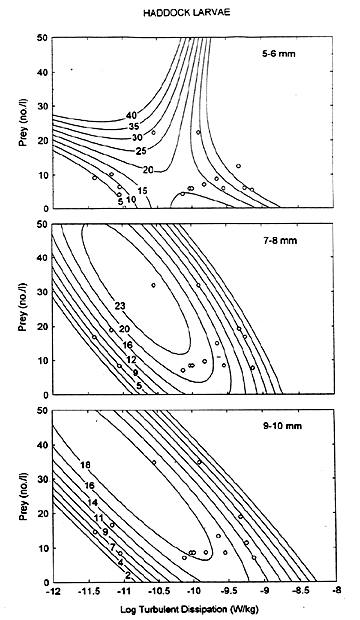
Theoretical studies have shown a feeding maxima that depends on the turbulence level and behavior of the predator and prey. Highly turbulent conditions are predicted to reduce larval feeding rates. Previous work by Lough and Mountain (1995) on feeding data from May 1981 and 1983 indicated an interaction effect where the maximum feeding response occurred at the highest prey densities observed and the lower turbulence levels ( Figure 1). The maximum feeding response continues at lower prey densities with increasing turbulence up to some intermediate level and then declines. It seems intuitive that an optimum level exists where stratification can aggregate prey while mixing at moderate levels can increase the probability of contacts between larvae and their prey. At higher levels of turbulence the enhancement of contact rates may be negated by the interruption of the pursuit process, resulting in a lower ingestion rate. In nature there probably is an optimum balance between the processes of mixing and stratification which results in maximum feeding, growth and survival of larvae. By residing near the pycnocline where there is a sharp gradient in turbulence, larvae have a greater probability of encountering optimum feeding conditions within a short distance vertically, especially first-feeding larvae with limited swiming ability.
References:
Lough, R. G., and D. G. Mountain. 1995. Effect of small-scale turbulence on feeding rates of larval cod and haddock in stratified water on Georges Bank. Deep-Sea Res. (Submitted).
Figure 1. Response surface estimation of feeding ratio (mean no. prey/larva) for three size classes of haddock larvae at average prey densities and minimum turbulence levels observed in the upper 50 m of the water column on Georges Bank. Actual data points are shown as small circles.
Vertical Profiles of Theoretical Contact Rates Between Larval
Cod and Their Naupliar Prey in Light of Recent Turbulence
Measurements
Lewis S. Incze
Bigelow Laboratory for Ocean Sciences
This study focusses on the vertical distribution of copepod nauplii, important prey for early feeding fish larvae, and the distribution of turbulent mixing that might lead to enhanced rates of contact between the predator and its prey. For the workshop I present vertical profiles of nauplii, fluorescence, salinity and temperature at selected stations of the pilot program in May 1992. Nauplii were sampled using a pumping system with intake attached to a CTD. The pump delivered 5.3 m**3 min**-1 to the deck, where a manifold system was used to continuously subsample at a rate of 15.5 l min**-1. The smaller volume was passed through a 40 µm mesh net for one minute to collect copepod nauplii and other small zooplankton. Turbulence in the upper mixed layer was estimated using local winds for six hours prior to sampling; turbulence for the lower, tidally-mixed layer (>=20 m off bottom) and for the pycnocline came from turbulence measurements in June 1995 (Neil Oakey, GLOBEC cruise SJ9508). Higher resolution pump profiling was done as a part of that cruise, but sample analysis is just beginning. Dissipation rates of 10**-6 and 10**-8 W kg**-1 were selected as characteristic of those two domains, respectively, and at that level of averaging are applicable between years. These values agree with recent GLOBEC modeling results (Lynch, Naimie, Werner) and are being used in other models of turbulence and contact rates (Werner et al., this workshop). A complete analysis of the 1992 data set has been submitted to the GLOBEC special volume of Deep Sea Research.
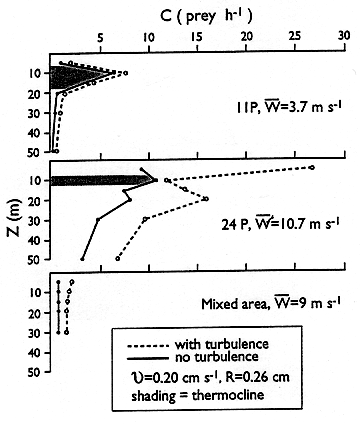
I use the term "contact rate" here to refer to the juxtaposition of a predator (anterior end) and its prey within a fixed distance, thus focussing on the physical spatial relationship and ignoring, for the present, the many biological parameters (search behavior, detection, pursuit, capture, handling time) that are poorly known and almost certainly highly variable. I scale the turbulent velocity calculation to a fixed length equal to a hypothetical radius of detection of prey by the predator. I use 0.26 cm, or ca. 1/2 predator body length, a conservative value still within the Kolmogorov length scale for most of the dissipation rates involved in this study -- exception being some low wind conditions in the upper layer. This approach gives rise to substantially lower estimates of turbulent enhancement of contact compared to the method of scaling to mean prey density (represented as N**-0.333, where N=No. prey m**-3). There is not yet consensus on the proper scale to use, and I forward what might be characterized as "conservative" estimates of turbulent enhancement of contact rates in larval cod. I use a steady predator cruising rate of 0.2 cm s**-1, a slow swimming speed but perhaps not so bad for a simplification that ignores the actual pause-travel behavior seen in this larva and the fact that feeding larvae must stop to handle prey. Calculations suggest the following increases due to turbulence in the 1992 data set: from 34-219% in the upper layer, depending on wind strength and depth; 8% in the pycnocline and 110% in the 20-30 m portion of the water column beneath the pycnocline (that is, 20 m or more away from bottom). The hourly contact rates over the entire data set span more than one order of magnitude, from 0.6 to 26.5 prey h**-1. At most stratified sites, the calculations predict that the best feeding conditions (contact rates) remain in the pycnocline, where naupliar concentrations were greatest (7 out of 9 stratified stations had maximum nauplii in the pycnocline). At the mixed sites, despite combined effects of wind and tidal turbulence, predicted contact rates between cod larvae and nauplii remained low (<=2 h**-1) due to the over-all low abundance of nauplii.
Contact rates (C) with and without turbulence are shown in Figure 1 for two stratified stations (11P and 24P) with different vertical structure (physics and biology) and different wind speeds (W), and for an average of two stations in the mixed area. The pycnocline is shaded; swimming speed and contact radius are as described above. Figure 2 shows the sensitivity of the calculations (data are for station 24P) to changes in swimming speed (v) of the predator (top panel) and changes in contact radius (R; lower panel; note that v and R have been reduced in this illustration only for convenience of plotting). Sensitivity to a 0.5 decade increase in Epsilon is intermediate between the responses shown for v and R The sensitivity to R shows how much more we need to know about scaling (R enters into the turbulent velocity calculation) and larval capabilities..... and we have not yet addressed variable behaviors, variable turbulence and the patchy distributions of prey caused by anisotropic turbulence at somewhat larger scales. Advances in theory, sampling and behavioral studies all are needed.
Figure 1: Theoretical encounter rates between cod larvae and copepod nauplii at selected sites with and without turbulence, using conservative parameters (pycnocline is shaded).
Figure 2: Sensitivity of encounter rates to changes in predator speed (v) and en- counter radius (R) using data for station 24P from Figure 1, with turbulence.
US GLOBEC: Molecular Markers of Cell Proliferation in Copepods and Larval Fish
Michael J. Moore, Bruce R. Woodin, Michael S. Morss, Scott M. Gallager,
and John J. Stegeman
Woods Hole Oceanographic Institution
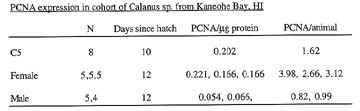
In metazoa fundamental understanding of cell proliferation is critical to understanding the dynamics of growth in the context of physical, chemical and biological variables. We have developed two immunochemical markers of cell cycling: bromodeoxyuridine (BrdU) nuclear incorporation in tissue sections and proliferating cell nuclear antigen expression (PCNA - MAb PC10) in sections and by western or slot blot. Fed copepods and larval fish were found to have higher indices than starved. Proliferation in copepodites is greatest in the growing caudal segment, whereas in adults it is primarily in maturing gonads, even in periods of relative starvation. In a cohort study of Calanus sp. the high PCNA expression in C5's was maintained in adult females, but not in adult males ( Table 1).
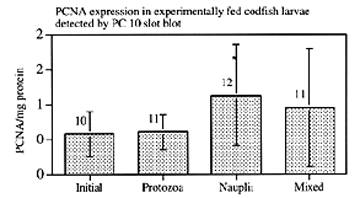
Newly hatched larval codfish were fed ciliates, copepod nauplii or a mixture of the two. Whole body PCNA detected by slot blot was significantly higher in the group fed nauplii only. (Figure 1).
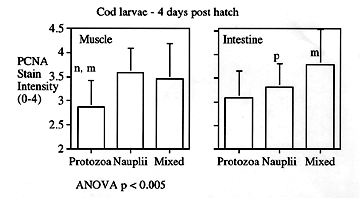
In tissue sections the organs of the nauplii-fed group that had significantly greater PCNA expression as compared with the protozoa fed group were skeletal muscle, liver and intestine. (Figure 2.)
This same group was observed to have a much higher prey attack rate and swimming speed associated with pursuing the larger prey, yet they failed to ingest the nauplii and had a poorer survival. These differences were associated with a more rapid yolk sac utilization rate in similar experiments. The demise of the group presented nauplii may have resulted from unsuccessful pursuit of prey, faster yolk usage in the face of inadequate exogenous nutrition, and unsustainable muscular and liver development. Thus, interpretation of particular indices such as PCNA expression must have detailed regard to other behavioral, nutritional and physiological parameters.
A similar approach is being applied to data from 1995 GLOBEC Georges Bank cruises. Initial data from samples collected during the RV Seward Johnson cruises 9503, 9507 and 9507 reveal a significantly higher expression of PCNA in Calanus finmarchicus from an inversely stratifed site on the southern flank that had an intrusion of warm slope water on the bottom as compared to samples from a shallower well-mixed station further on the bank.
In summary we have developed a short term index that reflects both somatic activity in larval fish and subadult copepods and reproductive effort in mature copepods. Tools such as these that detect cells undergoing division are central to the study of the effects of alterations in temperature, UV light exposure, food availability and other climatic variables in many if not all organisms in the oceans of the world.
NSF Grant OCE-9313676
Distribution, Abundance and Feeding Biology of Invertebrate Predators
Larry Madin1, Grace Klein-MacPhee2, Barbara Sullivan2, Mari Butler1,
Erich Horgan1, Donna Van Keuren2 and Steve Bollens1
1Woods Hole Oceanographic Institution
2University of Rhode Island
Sample data from several Process cruises from 1994 and 1995 show clear differences in predator species composition between mixed and stratified sites, and from one season to another (Figure 1). There are always strong day/night differences in abundance, as well as a general decrease in predator numbers from early spring to summer in 1995. This variation in predator composition requires that we obtain feeding data on a wide variety of species. Initial analyses of stomach contents indicate that ctenophores, chaetognaths, isopods, hyperiid amphipods and decapod shrimp all consume copepods, including Calanus. In the mixed region especially, suspended colonies of the hydroid Clytia gracilis are a significant source of predation on copepod eggs and nauplii, and larval cod. Rate data for gelatinous predators like Pleurobrachia and Bolinopsis indicate that they can have a large impact on target species of copepods, and Pleurobrachia also consumes cod larvae and eggs (Figure 2). We still lack adequate data on the abundance and distribution of most gelatinous predators.
Figure 1. Changes in species composition of predators collected in MOC-10 tows on three process cruises. May 1995 samples are affected by Slope Water intrusion, which destroyed the stratification such that fauna we collected were the same at central and flank stations. This kind of variability in predator composition means that predation mortality estimates must be time and site specific.
Figure 2. Diet of Pleurobrachia pileus based on gut contents analysis of individuals collected on process cruises. Data are combined from March, April and May, 1995.
Investigations of larval diapause in Calanus finmarchicus
Pamela Blades-Eckelbarger1 and Nancy Marcus2
1University of Maine
2Florida State University
Three generations of Calanus finmarchicus (G1 to G3) were raised between January and December of 1994 in a unique, flow-through culture system that was developed during the first year of the project. The system is designed to simulate ambient temperatures and provide natural-light photoperiods. Our culturing data suggest that, regardless of seasonal changes of photoperiod and temperature, Calanus finmarchicus will continue to reproduce in the laboratory at any time of the year as long as they are provided abundant food. Preliminary data indicate that the generation time (from egg to adult) is greatly slowed when food is limited both in quantity and quality. Although the animals grew and developed well in the culture system, we did experience the classic problem of a skewed sex ratio with relatively few males emerging from the terminal molt. Based on these results, we have re-directed some of our efforts towards achieving a better understanding of the factors that influence sex determination in C. finmarchicus, and that ultimately control their basic life history.
In addition to continued laboratory work, field collections were made every 4 to 6 weeks at a 70 meter deep site in the Gulf of Maine, off the mouth of the Damariscotta River. Morphological observations are being made on individual, live C. finmarchicus from both field-collected and laboratory-reared populations with respect to the relative size of the gonad in stages CIII through adult. Results of these analyses will reveal the extent of variability between individuals within the same population and life stage. Two distinct morphs were noted in the CV laboratory populations; those with very large lipid sacs and small gonads were categorized as "fat" CVs, those with little or no lipid storage and medium to large gonads were called "thin" CVs. These two morphs have also been observed in field populations by us and other GLOBEC PIs conducting field collections.
Field-collected and tank-reared copepodites and adults are being prepared and examined with light and electron microscopy to evaluate ontogeny of the gonad and attempt to identify an androgenic gland which, in higher crustaceans, secretes a hormone that signals the gonad to become a testis. The gonad becomes an ovary in the absence of this hormone. More individuals will be fixed, and sectioning has begun to locate this gland, if it exists, and to compare gonad morphology between tank-reared and field-collected Calanus. The internal morphology of both "fat" and "thin" CV morphs is being compared in an effort to determine possible differences in their physiological states.
In year 3, we will focus on the effects of diet on the developmental rate, and the possible influence of diet on the induction of a dormant state in the late fall/early winter. We will continue with experiments initiated in year 2 that are designed to determine the critical stage for sex determination. Internal morphology of the reproductive systems will be compared between individuals reared in the laboratory and those collected from the field to assess the degree to which the laboratory conditions simulate the field. We also hope to obtain animals from Georges Bank populations, rear these in the tanks, and compare the results to our earlier work to determine if place of origin is an important factor to consider. As outlined in the proposal, laboratory experiments designed to assess the impact of temperature and photoperiod on induction and termination of a dormant state will be conducted on selected developmental stages of Calanus reared from both Georges Bank and local populations.
The genetic history of haddock on Georges Bank: reconstruction from archived scale samples using mitochondrial and microsatellite markers
Irv Kornfield1, Maureen Purcell1, and Michael Fogarty2
1University of Maine
2National Marine Fisheries Service, Woods Hole
We are in the process of characterizing the genetic makeup of cohorts of spawning Atlantic haddock at decadal intervals using DNA extracted from dried scales archived by NMFS since 1938. Using markers for mitochondrial DNA and hypervariable microsatellite loci we seek to test two hypotheses. First, is there a genetic signature associated with changes in major life history attributes of the species which occurred during the 1970s due to overfishing. Second, has demographic stochasticity affected the genetic composition of the Georges Bank population. Both hypotheses depend on evaluating the pattern and magnitudes of fluxes in genetic variability.
We have successfully extracted DNAs from samples dating back to 1938 and have, to date, characterized two large haddock cohorts from 1985 and 1975. Preliminary analysis of mtDNA variation from these two recent demonstrates significant heterogeneity of
genetic (haplotype) composition. The most likely explanation for this observation is that the population of haddock spawning on Georges Bank may not be genetically discrete and that haddock from other geographic regions may be contributing to spawning
success. Thus, from the perspective of Atlantic haddock, Georges Bank may not be viewed as a closed system, but may have periodic intrusions of genetically differentiated populations from elsewhere in the region. Work is in progress to define the genetic composition of earlier cohorts to provide a more robust temporal perspective and evaluate the existence of stochasticity.
How does one visualize the impact of turbulence on the predator-prey interaction? I would like to start with a "tutorial" viewgraph (Figure 2) defining the turbulence spectra and the relevant length scales. The upper panel is the turbulent velocity spectrum showing the inertial subrange and the cut-off at viscous scales; the middle panel shows the shear spectrum which is normally measured by instruments like EPSONDE; and at the bottom is the dissipation spectrum in variance preserving form showing where the energy is near the viscous cut-off. The point is that there is very little energy at scales smaller than the scale nc and it is not "overturning". It should be also noted that the peak in the dissipation is about 1/3 of the wavenumber or 3 times the viscous cut-off scale. It is noted that for a dissipation of 10-6 W/kg, this cut-off scale is of order 0.8 cm which is large in comparison to most of the biological predator-prey interactions that have been discussed.
Next I show a cartoon to illustrate below what I think that people envisage when they think of the predator-prey interaction being a means of enhancing feeding by contrasting a no turbulence and a turbulence picture. Nevertheless, if at the scales of the predator and prey the motion is not turbulent and rather like a strain field as suggested by Figure 2, then one must be very careful in the interpreting enhanced feeding because of turbulence. This would seem to be of particular importance if the prey density were large in volumes corresponding to the scale of the viscous cut-off. So finally for discussion, I present you an alternate (Figure 4) to some of the diagnostic and prognostic models that we have heard about.