We have been occupied over the past few years with the collection and processing of the ship-board ADCP data from all the GLOBEC cruises. At this time there is narrow-band ADCP data from about 75 cruises mostly on the Endeavor and Oceanus, with broad-band ADCP data from another eleven or so Albatross cruises. We are now engaged in the analysis of this rather large data set. One of the goals of the project is to determine the large-scale mean and seasonal currents over the entire bank from the wide areal coverage provided by the ADCP. A major difficulty is dealing with the tidal currents which account for 80 to 95 percent of the total current variance. While we have developed a reasonable tidal model based upon all the ADCP data, when it comes to actually removing the tides from a particular observation there are enough short term tidal phase and amplitude variations that a substantial fraction of the tides remains.
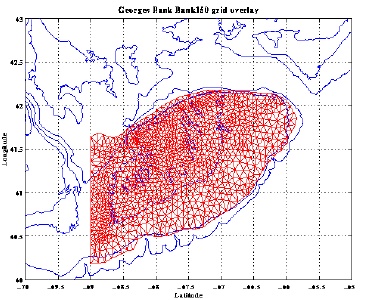
To deal with this problem we are taking advantage of the great progress in hindcast/forecast modelling made by investigators at Dartmouth College, Bedford Institute of Oceanography, the University of North Carolina, Woods Hole Oceanograhpic Institution, and the National Marine Fisheries Service. The hindcast only version of the finite element model uses the observed density field plus wind, heat flux forcing to drive an iterative simulation for the period of a cruise, seeking to replicate the observed barotropic currents from ship-board ADCP. The model domain is the "BANK150" grid which is confined to the Bank inside approximately the 150m isobath, cut off on the west just short of Nantucket Shoals, Figure 1. There are 21 levels in the vertical. During the hindcast model iteration adjustments are made to selected tidal amplitudes and phases and mean sea level around the model boundaries. Typically, adjustments are made to one or two of the major tidal constituent only, usually M2 and/or K1, the ADCP data records not being of sufficient length to distinguish the adjustments to the other constituents or harmonics. Each iteration consists of a forward run using the fully non-linear QUODDY model followed by an inversion using a version of the linearized TRUXTON model and the error field based upon the difference between the QUODDY results and the observed ADCP currents. After two QUODDY/TRUXTON iterations, a final QUODDY run is made using the adjusted mean sea level and tidal boundary conditions to produce the final estimated 3-D flow field.
The iterative procedure appears to explain roughly 95 percent of the current variance, averaged over the whole domain, which compares nicely with estimates of tidal variance on the Bank. Most importantly, the non-tidal flow field appears to be quite reasonable with small scale structure related to flow over and around the topography. These results have encouraged us to apply the same procedure to as many of the GLOBEC cruise data sets as possible in order to build up enough of a data set to use it to determine the seasonal and shorter scale currents and their fluctuations over the Bank. Since we going to the effort of running these models for many of the cruises when other investigators might also be interested in the currents in the area where and when they made measurements, we will be making the hindcast model results available through our ADCP web site. We have develop procedures which will extract various kinds of model results with varying temporal/spatial resolution for specific cruises. At the moment, we have completed runs for three broad-scale cruises, OC298, OC302, and OC322, with results that can be obtained from our web site. The results from more cruises will be available in the future.
Archived Model Results and Web Access
The archived model outputs include two basic types of data, 2-D velocities and sea level at hourly intervals, and complete 3-D flow and water properties at 6 hourly intervals. We have also performed tidal analyses on the barotropic currents and sea level model results at each of the grid points and archived the results. The web page is currently configured to serve the 2-D hourly currents and sea level for the entire grid or a specified location over a user specified time interval. Presently, the 3-D data for a single time is accessible either for the entire grid or along a section, the end points of which are specified by the user. The results of the model extraction are only available as MATLAB files, they are too voluminous to transfer as ASCII files. The tidal analyses for each of the primary constituents are available as ASCII files. These choices were the most obvious ones to make and since this is new, we do not have any experience with what would be desired by other GLOBEC investigators. We would very much appreciate some feedback on what other options people would prefer. The web page to access the ADCP data and hindcast model results is: www.oasdpo.bnl.gov/mosaic/globec
Figure 1. Bank150 finite model grid used in the hindcast model showing the extent of the model coverage. There are 1200 grid points inside the 150m isobath with 21 sigma-levels in the vertical. [Note: both JPEG and TIFF version are available.]