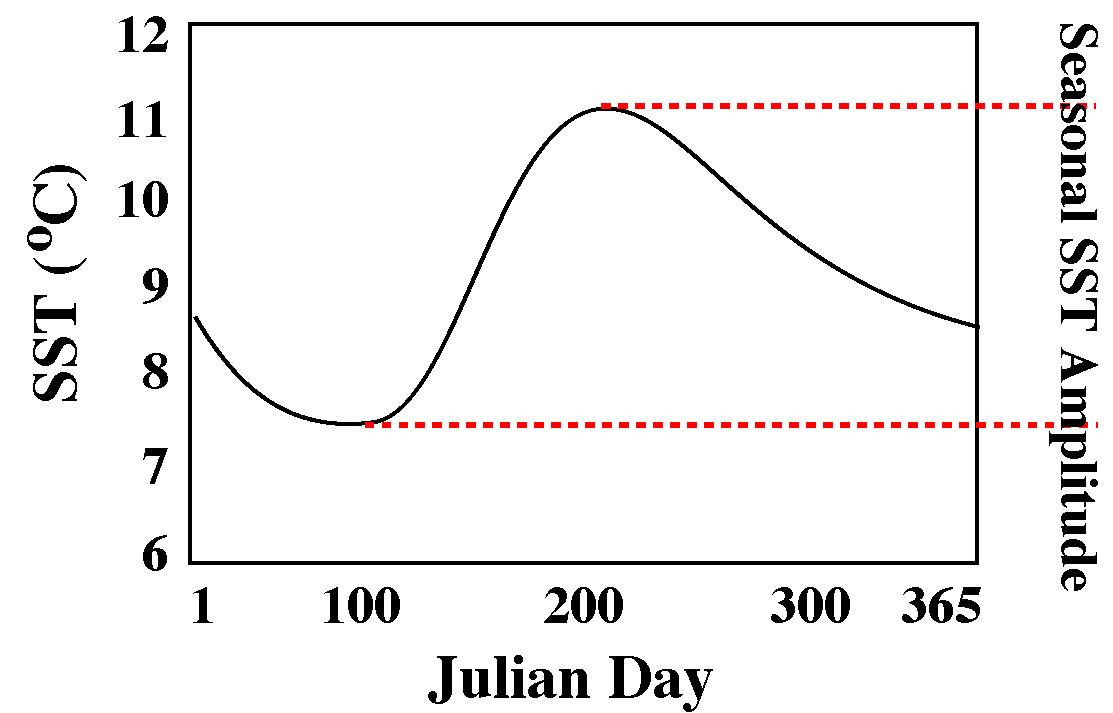
Figure 1: Schematic definition of the amplitude of seasonal SST change determined at each pixel location. Actual SST time series curves were derived from harmonic analysis of 6-year ensemble average of daily AVHRR Pathfinder imagery.