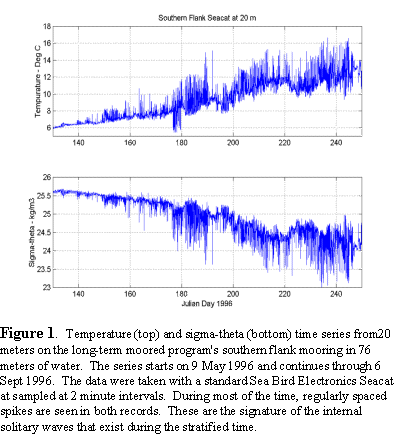
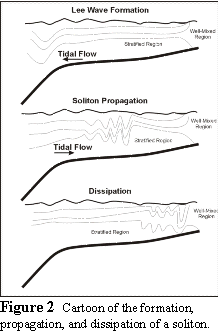
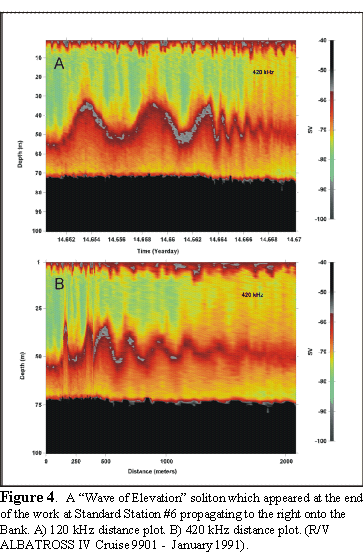
Large-amplitude, high-frequency internal solitary waves of both depression and elevation have been observed on Georges Bank in moored temperature and salinity and towed acoustic backscatter observations made during the 1994-1999 U.S. GLOBEC Northwest Atlantic/Georges Bank program. Internal solitary waves of depression are typically observed propagating on-bank on the shallow seasonal thermocline (pycnocline) over the southern flank during May-September, when strongest vertical stratification exists between the shelf/slope front and the tidal mixing front on the Bank crest (Figure 1). They are generated near the shelf break by the large across-bank semi-diurnal tidal flow that occurs approximately every 12.4 hours (Figure 2). These waves become rank-ordered in packets of 3 to 12 waves, with maximum amplitudes of 20-30 m in 76 m of water (Figure 3). These waves appear to dissipate in or near the tidal mixing front. Internal solitary waves of elevation are observed over the southern flank when the pycnocline is closer to the bottom (Figure 4). This situation typically occurs during on-bank migrations of dense Slope Water in the foot of the shelf/slope front. Intrusions of Slope Water associated with warm-core rings can be either surface- or bottom-intensified, which can lead to internal solitary waves of depression or elevation, respectively. Both types of internal solitary waves produce strong acoustic backscatter, suggesting enhanced temperature/salinity micro-structure generation by the large current shear across the wave interface, in addition to the presence of biological scatterers. These internal solitary waves may play an important role in the on-bank transport of water and biological materials, and in internal mixing and primary production.
Figure 1. Temperature (top) and sigma-theta (bottom) time series from 20 meters on the long-term moored program's southern flank mooring in 76 meters of water. The series starts on 9 May 1996 and continues through 6 Sept 1996. The data were taken with a standard Sea Bird Electronics Seacat at sampled at 2 minute intervals. During most of the time, regularly spaced spikes are seen in both records. These are the signature of the internal solitary waves that exist during the stratified time.
Figure 2. Cartoon of the formation, propagation, and dissipation of a soliton.
Figure 3. Top: FORMATION: A possible Lee wave between standard Stations 24 and 39. Middle: PROPAGATION: An internal wave packet between Stations 6 and 7. Bottom: DISSIPATION: An internal wave packet between Stations 17 and 18.
Figure 4. A "Wave of Elevation" soliton which appeared at the end of the work at Standard Station #6 propagating to the right onto the Bank. A) 120 kHz distance plot. B) 420 kHz distance plot. (R/V ALBATROSS IV Cruise 9901 - January 1991).