1 m2 MOCNESS Zooplankton Collected during the
Process Cruises, Austral Autumn 2001 and 2002
Contact information: Kendra L. Daly
College of Marine Science
University of South Florida
140 Seventh Ave. S.
St. Petersburg, FL 33701
727-553-1041 (office) 727-553-1189 (fax)
kdaly@marine.usf.edu
Net sample collections: Meng Zhou, Yiwu Zhu, Ryan
Dorland, Dan Mertes, and Joe Smith
Sample Analyses: Jason Zimmerman, Alexander Timonin, Tatjana
Semenova
Cruises:
Laurence M. Gould, 23 April - 6 June 2001 (LMG 01-04), 18 net tows
Laurence M Gould, 7 April - 21 May 2002 (LMG 02-03), 16 net tows
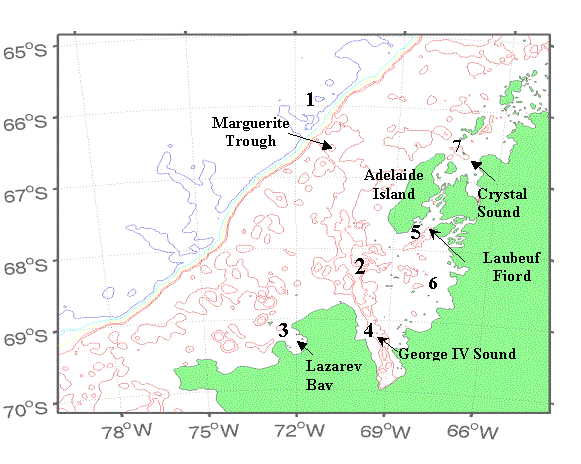
Zooplankton abundance, vertical and horizontal distribution, and population structure was assessed using a 1 m2 Multiple Opening and Closing Nets and Environmental Sampling System (MOCNESS) with nine nets having 333 µm mesh and environmental sensors of temperature, salinity and depth. The entire water column was sampled on the downcast using net # 0, which was not analyzed. The upper water column was typically sampled using nets 1 and 2 from 500 m to 200 m at 150 m depth intervals, nets 3 and 4 from 200 m to 100 m at 50 m depth intervals, and nets 5 to 8 from 100 m to the surface at 25 m depth intervals. Some tows were deployed down to 1000 m, and some tows were towed targeting krill swarms at irregular depths. Approximate locations of process study stations are shown in Fig. 1. Zooplankton samples were immediately preserved in 10% buffered formalin solution. All the large organisms (>15 mm) in the sample were removed and identified to taxa. The sample was then split to about 100 individuals of euphausiids. All euphausiids in the split were identified to species and life history stage and measured for length to the nearest 0.5 mm for larvae and to the nearest 1.0 mm for juvenile and adults. Next the sample was split to about 100 individuals of copepods. Copepods were identified to species and life history stage (female, male, copepodite V, or other copepodite; except Oncaea and Oithona are male, female, and other). All other zooplankton in the split were identified to taxa and counted. For the Euchaetidae, we followed the designation of Park (1994) who ascribed the Antarctic species to the genus Paraeuchaeta. Level 0 shows the number of individuals of zooplankton taxa or species counted in a subsample split. Level 1 shows the abundance of each euphausiid species and stage within size ranges. Greenwich Mean Time was local time + 4 hours.
Reference
Park, T. 1994. Taxonomy and distribution of the marine calanoid copepod family Euchaetidae. Bulletin of the Scripps Institution of Oceanography University of California, San Diego v. 29, University of California Press, Berkeley, CA, 203 pp.
Explanation of Variables
Level 0 - ‘Abundance’
|
Variable |
Description |
Units |
|
Cruise |
Cruise
identifier (LMG0104, LMG0203) |
|
|
Station |
Station
number gives approximate location |
|
|
Date_local |
Self
explanantory |
|
|
Time_local |
Self
explanantory |
|
|
Event |
Event
number from cruise event log; unique ID |
|
|
Lat
|
Latitude
at beginning of net tow |
degrees, minutes, seconds South |
|
Lon |
Longitude
at beginning of net tow |
degrees,
minutes, seconds West |
|
Tow
|
Net
tow number |
|
|
Net
|
Net
number (1-8) |
|
|
Vol_filt |
Volume
of water filtered by net |
c |
|
Displ_vol |
Displacement
volume of sample |
ml |
|
Depth_open
|
Depth each net was opened |
meters |
|
Depth_close
|
Depth
each net was closed |
meters |
|
Taxon |
Scientific
name of organism or common name of group |
|
|
Stage |
Life
history stage; CV = copepodite stage V, C2 = calyptopis stage 2, F2 =
furcilia stage 2 |
|
|
Samp_fraction |
|
|
|
No_Counted |
Number
of individuals counted in a split |
|
Level 1 - ‘Size Frequency (SF) All’
|
Cruise |
Cruise
identifier (LMG0104, LMG0203) |
|
|
Station |
Station
number gives approximate location |
|
|
Date_local |
Self
explanatory |
|
|
Time_local
begin |
Time
net tow began |
|
|
Time_local
end |
Time
net tow ended |
|
|
Lat |
Latitude
at beginning of net tow |
degrees, minutes, seconds South |
|
Lon |
Longitude
at beginning of net tow |
degrees,
minutes, seconds West |
|
Tow |
Net
tow number |
|
|
Net |
Net
number (1-8) |
|
|
Vol_filt |
Volume
of water filtered by net |
cubic
meters |
|
Depth_open |
Depth each net was opened |
meters |
|
Depth_close |
Depth
each net was closed |
meters |
|
Taxon |
Scientific
name of organism or common name of group |
|
|
Stage |
Life
history stage; CV = copepodite stage V, C2 = calyptopis stage 2, F2 =
furcilia stage 2 |
|
|
Length
range |
Size
interval for organisms |
mm |
|
Samp_fraction |
The
subsample split fraction |
|
|
No_counted |
Number
of individuals within size interval |
|
|
Abundance |
Density
of individuals within size interval |
number
per cubic meter |
Note: The flowmeter used to calculate the volume of water filtered did not work for the tows shown below; and no data are shown in the listing for those tows. However, using the net distance and the average angle of the net, the volume filtered was estimated as follows. These estimates have about a 10% error or higher when currents were present.
GLOBEC I St. 4, Cast 9, event #98Net Volume Filtered m3 1 5482 7933 4904 4605 3146 2767 2628 329 GLOBEC I St. 3, Cast 16, event #200Net Volume Filtered m3 1 8012 7893 6334 2865 2806 2447 268
GLOBEC III, St. 4, Cast 9, Event #151
Net# Volume Filtered
4 436
7 253
GLOBEC III, St. 4, Cast 10 Event
#152
Communication was lost with the underwater unit and was unable to be re-established near the end of this tow. The estimate for net # 7 is based on the time from when the net was opened and the average volume filtered/time that was observed on up and down casts.
Net# Volume Filtered
7 2560
GLOBEC III, St. 2, Cast 13 Event
#181
No flow counts were recorded for this cast. All volume filtered values are calculated from the net distance and angle for each of the nets.
Net# Volume Filtered Time Open(min) Net Dist(km)
1 272 5.2 0.359
2 471 9.4 0.638
3 315 6.2 0.421
4 736 15.6 1.010
5 391 8.1 0.517
6 176 4.0 0.227
7 162 3.6 0.213
GLOBEC III, St. 2, Cast 14 Event
#182
(Same as above)
Net# Volume Filtered Time Open(min) Net Dist(km)
1 398 7.5 0.573
2 562 11.4 0.818
3 490 10.4 0.706
4 1623 34.0 2.333
5 396 8.1 0.585
6 203 4.3 0.306
7 185 5.0 0.226
GLOBEC III, St. 3, Cast 15, Event #191
(Same as above)
Net# Volume Filtered Time Open(min) Net Dist(km)
1 311 6.4 0.414
2 207 4.4 0.279
3 294 5.1 0.404
4 170 3.2 0.238
5 264 5.4 0.340
6 687 12.6 0.817
7 1279 23.2 1.604
8 688 11.4 0.790
Fig. 1. Approximate locations of process cruise stations
in Marguerite Bay during austral autumn 2001 and 2002.