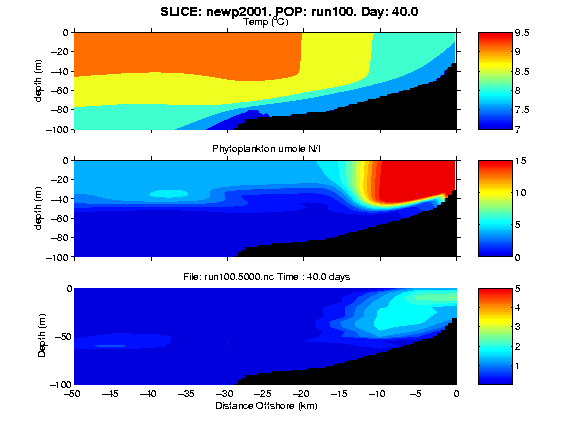
Figure 1. One snapshot of a movie of the temporal and spatial development of temperature, phytoplankton and copepods from a 120 day simulated upwelling ecosystem.
The animations below link our two-dimensional upwelling circulation hydrodynamic-NPZ model with an individual-based model (IBM) for an intermediate sized (ca. 2.5 mm) copepod capable of undergoing diel vertical migration (DVM) at larger sizes. The NPZ model is that of Franks et al. (1986), with the zooplankton component parameterized for macrozooplankton grazers. Temperature (deg. C) and phytoplankton (umole N/l) fields from a 120 day simulation are shown in the top and middle panels. Forcing for this simulation was alternating southward winds (-0.5 dynes/cm2) for 10 days and no winds for 10 days. There was no surface heat flux. The phytoplankton fields (middle panel) show a nearshore bloom (reds) that strengthens during the upwelling periods; the upwelling front returns slightly toward shore during wind relaxation periods. After ca. day 100, a second, smaller phytoplankton bloom occurs offshore (beyond 20 km from shore), that represents phytoplankton growth upon regenerated nutrients (by Z of NPZ model; not shown).

Figure 1. One snapshot of a movie of the temporal and spatial development of temperature, phytoplankton and copepods from a 120 day simulated upwelling ecosystem.
| run100pop.flc [1213 Kbytes] | run100pop.gif [8495 Kbytes] |
| an FLC movie | an animated GIF |
| Larger and better resolution (and smaller filesize), but requires a special player. Links to FLI/FLC players available for Windows, Mac, and Linux operating systems via http://crusty.er.usgs.gov/flc.html. | Smaller and poorer resolution (and larger filesize), but can be viewed directly within most graphical web browsers (i.e., Netscape, Explorer). |
Upon attaining adult size, females store energy reserves in a reproductive compartment, until sufficient energy has accumulated to release a clutch of eggs (ca. 40 eggs/clutch). Egg release only occurred between midnight and 4 AM (e.g. near the surface if they are migrating). The bottom panel of the movie shows the spatially dependent distribution and relative abundance of the copepods throughout the simulation. Initially, they were randomly located. By day 6, there are very few in the surface waters, with a maximum near 50 meters (except in the upwelling nearshore), because the initial 10 ug C individuals have some, but very limited DVM and they tend to accumulate at the average of their daytime and nighttime depths. Also by day 6, there is a substantial phytoplankton bloom inshore of 5 km. By day 20, there has been a substantial decline in the abundance of copepods throughout much of the displayed domain, with patches located at depth offshore (beyond 30 km) and near the surface inshore. By day 30 the patch offshore has disappeared. This was a group of individuals that had no access to food, reached the critical starvation weight and were killed off. Meanwhile the inshore, nearsurface patch has expanded in space and magnified (reproduction has occurred). The scale for the bottom panel is a measure of log relative abundance, so by day 30 there are ca. 100X higher abundances in the patch than outside the patch. From day 30 until day 96, the phytoplankton patch and the copepod patch both expand in depth and offshore extent (with slight interruptions during wind relaxation events). Subsequent to day 96, significant phytoplankton patches develop offshore of 25 km, but these are not available to the copepods, which are actually located further inshore. It should be noted that there is no negative effect on the phytoplankton fields of the grazing and growth of the copepods in the individual based model. Only the Z component of the NPZ model depletes P in this modeling simulation.
Summary: We have identified four metrics for evaluating the response of organisms to their environment: 1) growth/development; 2) reproduction; 3) survival; and, 4) distribution, particularly nearshore retention. For an individual to be successful in an eastern boundary current upwelling system it must grow, reproduce and survive. Moreover, since ocean productivity is greatest nearshore, zooplankton production is enhanced by nearshore retention. Suitable habitat space is the region of the domain that favors nearshore retention and positive individual growth. Model results, using an idealized upwelling circulation, indicate that DVM interacts with the 2D flow fields to retain individuals nearshore when the amplitude of the vertical excursion places animals in near-bottom onshore flow during the day. This occurs more often and from a larger "volume" of the upwelling system for larger organisms than for smaller individuals, and is most effective deep and inshore (<40 km from shore). The spatial extent and magnitude of the phytoplankton bloom (food resources) strongly controls the volume of suitable habitat space for the copepods. Spatially-extensive and high concentration blooms (macrozooplankton scenario) provided a much larger suitable habitat than did smaller blooms (microzooplankton scenario). Rapid growth from small, nonmigratory life stages to larger, migrating stages provides greater opportunity for nearshore retention. This indicates that resource fields are important in determining not only growth rates, but also nearshore retention, and thus, argues for detailed descriptions of how resources vary in space and time.