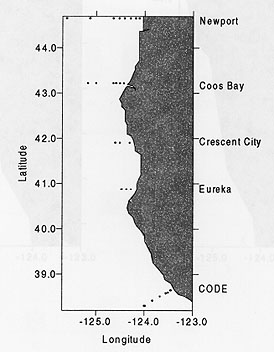
Figure 1. GLOBEC sampling stations off the coast of Oregon and Northern California.
Progress Report: April 1999
Project Subject: LTOP Observations of Zooplankton in the CCS
Investigators: William T. Peterson (PI), Julie Keister, National Marine Fisheries Service, Newport, Oregon
Five hydrographic were sampled for zooplankton between November 1997 and February 1999 (Figure 1). The Newport Hydrological (NH) Line (44.7
°N) was sampled on eight different cruises; the Coos Bay, Crescent City, Eureka on four cruises (Nov 1997, April, August, and November 1998), and the CODE line on thee cruises (Nov 1997, April and August 1998). Along each line, zooplankton samples were taken in conjunction with physical data at several stations on the continental shelf (< 150 m) and in deeper water offshore (to 4000 m depth). Zooplankton was sampled with a 0.5m diameter, 202mm mesh net towed vertically from 100m (depth permitting) to surface, with a 1m diameter, 335mm mesh net towed obliquely from 20m to surface, and with70cm diameter, 335mm mesh paired bongo nets towed obliquely from 200m to surface. This report summarizes results on three aspects of our work: effects of the the 1997-98 el Nino on zooplankton species; alongshore and zonal gradients in zooplankton biomass and species composition, and changes observed in copepod community structure.
Figure 1. GLOBEC sampling stations off the coast of Oregon and Northern California.
El Nino. Profound effects of the el Nino on the zooplankton were seen. Most outstanding was that the euphausiid Nyctiphanes simplex, a shelf species common off Baja California, was common in our samples from November 1997 through November 1998 as far north as the NH line. In addition, during the el Nino two central Pacific euphausiid species normally restricted to the outer reaches of the California Current and south of 40°N (Brinton 1962, Figs. 34-35) were found in nearshore waters off the coast of Oregon: Euphausia recurva was found in January 1998 and E. mutica was found in April 1998 (Table 1). These species have never been recorded in Oregon waters. These observations indicate that both strong poleward and onshore flows occurred during the el Nino.
Based on analysis of changes in sea level, physical oceanographers generally believe that the el Nino began in November 1997 and ended in May 1998. The presence of the uncommon E. recurva and E. mutica off Oregon in January and April may indicate that the strongest el Nino conditions occurred during that period, but the persistence of the el Nino beyond May is indicated in the zooplankton by the presence of N. simplex in our samples through November 1998. In February 1999, the return of "normal" conditions was implicated by the return of Nematoscelis difficilis and Thysanoessa gregaria, two transition-zone euphausiids which occupy the region between 40-45N (Table 1) and which occur commonly off Oregon, especially during winter months.
Alongshore and Zonal Variations in Zooplankton Biomass and Species Composition. Strong gradients in zooplankton biomass were seen both alongshore and across-shelf. In April 1998, the highest biomass values were found on the shelf along the Newport line; biomass dropped off steadily to the south and offshore (Figures 2, 3). In August 1998, when there was strong upwelling, biomass was more variable: off Newport, biomass was high inshore and dropped in slope waters; off Coos Bay, Crescent City, and CODE, biomass was more evenly spread across the shelf; along the Eureka line, biomass increased strongly offshore (Figures 2,4). South of Cape Blanco (43°N), the upwelling zone extends further to sea than in the north, possibly leading to the higher and more uniform distribution of biomass seen along the southern lines. Biomass of euphausiids furcilia, which are important prey items for many fishes, was distributed like total biomass (Figure 5), but biomass of pteropods, which are also important prey for fish, was concentrated along the Coos Bay line and was uniform and low elsewhere (Figure 6). Overall, biomass in April and August 1998 averaged only 11.8 mg C m-3, well below the averages found by Peterson et al. in the early 1970's (Peterson et al. 1979). We attribute these low values to the el Nino event.
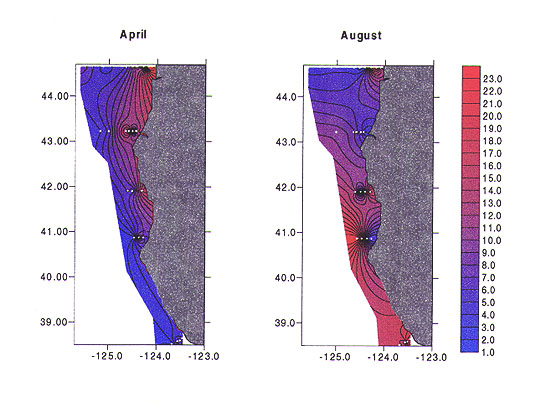
Figure 2. Total zooplankton biomass (excluding pteropods) off the coast of Oregon and Northern California in April and August 1998.
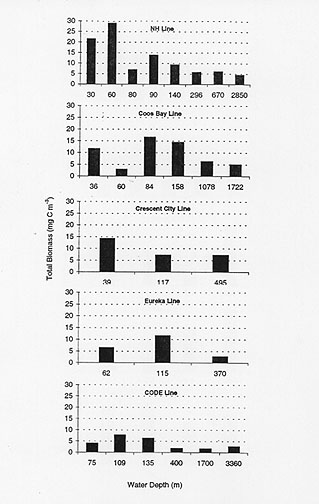
Figure 3. Total zooplankton biomass (excluding pteropods) in April 1998. Water depth is the depth of the station.
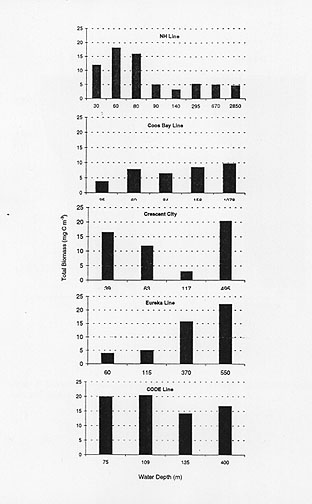
Figure 4. Total zooplankton biomass (excluding pteropods) in August 1998. Water depth is the depth of the station.
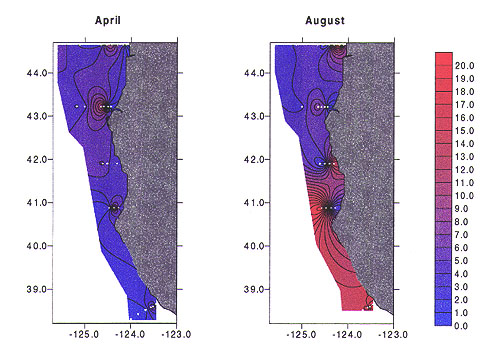
Figure 5. Biomass of euphausiid furcilia off the coast of Oregon and Northern California in April and August 1998.
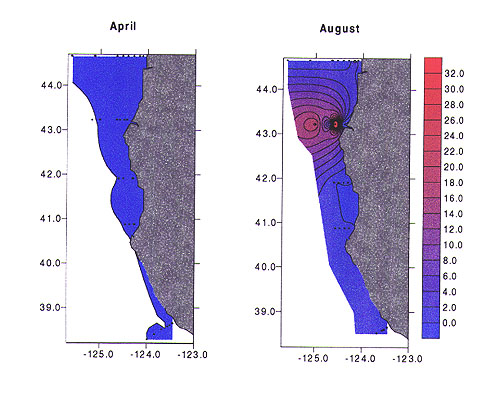
Figure 6. Biomass of the pteropod Limacina helicina off the coast of Oregon and Northern California in April and August 1998.
April and August zooplankton abundance data were
examined for differences 1) among on-shelf, mid-shelf, and off-shelf
samples and 2) among transect lines using Multi-response Permutation
Procedures (MRPP) an ordination technique found in PC-ORD 4.28 (McCune and
Mefford 1999). When differences among groups were found, Indicator Species
Analysis was used to investigate which species were driving the
differences. Results of MRPP (Table 2) and Indicator Species Analyses show that there
were strong onshore-offshore differences in zooplankton community
structure. In April, strongest indicators of inshore-offshore differences
(p<.0001) were the crabs Cancer spp. and porcelain crabs,
decapods (not including euphausiids), ostracods, and Magelona. All
of these indicator species were found primarily onshelf. Several other
species were also indicators, only one of which, Eucalanus bungii,
was found primarily at mid-shelf and offshore. In general, the
onshore-offshore patterns seen in August were weaker than during April. In August, only 10 species were good indicators of onshore or offshore
samples; none were especially strong indicators (p>0.001). Like in
April, most of the good indicators were found primarily inshore with the
exceptions of Metridia spp. and Calocalanus styliremis. In
April, Metridia had been found throughout the sampling range and
C. styliremis had been found primarily inshore. Strongest indicator
species in August were Noctiluca, Metridia, C.
styliremis, and Clausocalanus spp.
Strong alongshore gradients in zooplankton communities were also revealed by MRPP (Table 2). North-south differences were significant in both April and August, but were most pronounced in August during upwelling. Several species of zooplankton, including the copepods Pleuromamma abdominalis, Rhincalanus nasutus, and Heterorhabdus papilliger, were only found south of Cape Blanco. Others, including Candacia bipinnata, Clausocalanus arcuicornis, and Acartia tonsa were only found north of Cape Blanco.
Changes in Community Structure. Two copepod species (Calanus marshallae and Pseudocalanus mimus) that ordinarily dominate the shelf assemblage off Oregon almost completely disappeared between August 1997 and September 1998 (Figure 7 — present Pseudocalanus data). Calanus marshallae was once dominant from June through September, but for the past three years, high numbers were only seen in September (Figure 8). The copepods Paracalanus parvus and Ctenocalanus vanus, which are important in the coastal ecosystem off central and southern California and which (because of northward transport by the Davidson Current) were once common off Oregon only during winter, are now common species off Oregon year-round (Figure 9). The coastal copepod assemblage off Oregon seems to have changed from a boreal assemblage to a warmer water assemblage that is more similar to California shelf waters.
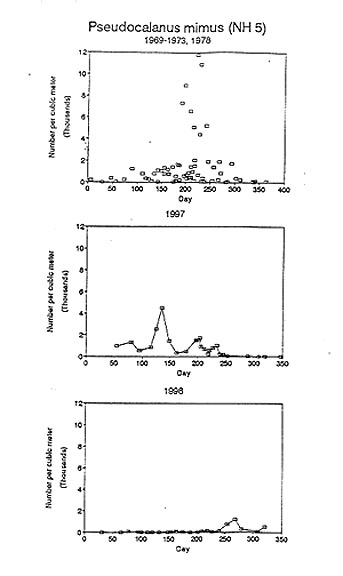
Figure 7. Upper Panel. Seasonal differences in density of the copepod Pseudocalanus mimus at a station five miles offshore of Newport, along the Newport Hydographic Line, from samples collected in 1969-1973 and 1978. We know from the historical data that P. mimus is the numerical dominant copepod in continental shelf waters. Middle and Lower Panels. The seasonal cycle of P. mimus density in the years 1997 and 1998 illustrating that individuals of this species disappeared from shelf waters during the 1997-98 El Nino for more than one year, from late August 1997 until mid-September 1998.

Figure 8. Upper Panel. Seasonal differences in density of the copepod Calanus marshallae at a station five miles offshore of Newport, along the Newport Hydographic Line, from samples collected in 1969-1973 and 1978. This copepod first appears in the plankton in mid-February; highest numbers are found from June through September; individuals disappear in early October and presumably enter dormancy and reside in deep water offshore. Lower Panel. Over the past three years, C. marshallae densities have fallen to less than half the values observed in the 1970's and the seasonal peak in abundance has shifted to September.

Figure 9. Upper Panel. Seasonal differences in density of the copepod Paracalanus parvus at a station five miles offshore of Newport, along the Newport Hydographic Line, from samples collected in 1969-1973 and 1978. During the 1970's this species was chiefly found during autumn and winter months, having been advected from Central California coastal waters with the poleward-flowing Davidson Current. Lower Panel. Over the past three years, the species has become an important member of the coastal copepod community in summer. The copepod Ctenocalanus vanus shows a similar change in seasonal cycle off Oregon.
References Brinton, E. 1962. The distribution of Pacific Euphausiids. Bull.
Scripps Inst. Oceanogr., 8(2): 51-269. Peterson, W.T., C.B. Miller, and A. Hutchinson. 1979. Zonation and
maintenance of copepod populations in the Oregon upwelling zone. Deep-Sea
Res., 26A: 467-494. Table 1. Density (#
m
|
Jan 1998 |
April 1998 |
August 1998 |
Nov 1998 |
Feb 1999 |
||||||
|
NH15 |
NH25 |
NH15 |
NH25 |
NH15 |
NH25 |
NH15 |
NH25 |
NH15 |
NH25 |
|
|
Euphausia pacifica |
0.004 |
1.926 |
0.527 |
0.320 |
0.172 |
0.094 |
0.059 |
5.503 |
0.011 |
18.103 |
|
Nyctiphanes simplex |
0.020 |
0 |
0 |
0.004 |
0.004 |
0 |
0.645 |
0 |
0 |
0 |
|
Nematoscelis difficilis |
0 |
0 |
0 |
0 |
0 |
0 |
0 |
0 |
0.004 |
0 |
|
Thysanoessa gregaria |
0 |
0 |
0 |
0 |
0 |
0 |
0 |
0 |
0.004 |
0 |
|
Thysanoessa spinifera |
0 |
0 |
0.033 |
0 |
0.026 |
0.003 |
3.166 |
0 |
0.004 |
0 |
|
Euphausia mutica |
0 |
0 |
0 |
0.004 |
0 |
0 |
0 |
0 |
0 |
0 |
|
Euphausia recurva |
0 |
0.008 |
0 |
0 |
0 |
0 |
0 |
0 |
0 |
0 |
Table 2. Results of MRPP analyses. Factors investigated were latitudinal line (Line) and position on the continental shelf (Shelf), and position relative to Cape Blanco (Blanco).
|
Data set |
variable |
n |
Test statistic |
Within-group agreement (A) |
p |
|
April samples |
Line |
NH=8 FM=5 CR=3 EU=3 CODE=5 |
-2.88 |
0.043 |
0.007 |
|
August samples |
Line |
NH=8 FM=5 CR=4 EU=3 CODE=5 |
-6.28 |
0.101 |
<0.0001 |
|
April samples |
Shelf |
On=3 Mid=12 Off=9 |
-5.41 |
0.056 |
0.0001 |
|
August samples |
Shelf |
On=3 Mid=13 Off=9 |
-4.00 |
0.045 |
0.001 |