Progress Report: April 1999
Project Title: Patterns, sources and mechanisms of decadal-scale
environmental variability in the NEP
Principal Investigators: Franklin B. Schwing, Richard H. Parrish, Roy Mendelssohn (PFEL),
Grigory Monterey (JIMAR), and Tom Murphree (Naval Postgraduate School)
Our project focuses on decadal, interannual, and seasonal ocean
variability in the North Pacific using retrospective analyses of
atmospheric and oceanic observations. Our first year effort has been mainly
creating the physical data bases that are being used in the NEP program by
this and other projects. Data analysis and interpretation have been
initiated. Preliminary results have been presented at several scientific
meetings, and several scientific papers are in preparation. Our current
work is focusing heavily on the analysis of the historical oceanic and
atmospheric data sets developed and customized in the initial year’s
efforts. The analysis will concentrate on describing the primary patterns
of and mechanisms for seasonal, interannual, and decadal variability in
wind forcing and upper ocean fields. Below are some highlights of our NEP
work to date.
Created data base system to allow rapid and customized access to the
World Ocean Data Base for retrospective climatic change research via Live
Access Server (LAS). The implementation at PFEL of the LAS, developed at
PMEL, allows users on their own computers to subsample the WODB and other
data sets and produce summaries for customized geographic regions in a
number of formats that can be read directly into a variety of visualization
and analysis software packages. [FIGURES 1-2]. The LAS is available at:
http://www.pfeg.noaa.gov/whats_new/las_whats_new.html.
Developed fields of surface and subsurface quantities for
retrospective analyses of decadal variability and comparison with model
output. Summaries of observed data are being used both for direct
analyses of ocean variability and as model validation fields. Global
1° monthly mean surface wind stress fields (from the COADS) and
subsurface ocean temperature and salinity fields at standard depths (from
the WODB). Monthly climatologies and decadal averages for 1966-75 and
1977-86 have been developed for several fields (e.g., wind stress,
temperature, salinity), and have been animated for further analysis.
Monthly climatologies and monthly fields can be viewed on the PFEL LAS.
[FIGURES 3-4].
Describe annual cycles of primary atmospheric and oceanic quantities
based on retrospective analyses and model output. We have used the
NCEP reanalysis and COADS wind and SST and WODB temperature fields to
describe key aspects of the seasonal cycle and interannual to decadal
variability of the NEP. Seasonal climatologies of the observed ocean and
atmospheric fields and derivatives of these fields (e.g. wind curl, mixed
layer depth) are being analyzed. Seasonal anomalies may be strongly
affected by anomalies developed during other seasons. We are comparing
oceanic and atmospheric variability within selected subregions of the NEP
(e.g. Gulf of Alaska, northern California Current).
Understanding the development of the 1997-98 El Niño
– Changes in the North Pacific associated with El Niño
(EN) and La Niña events are dynamically similar to decadal scale
shifts, so they are very useful analogs of climate change in this region.
Atmospheric variations over the NEP were strongly related to the
development of the 1997-98 EN in the tropical Pacific. Regional changes in
wind stress led to dramatic SST anomalies in the NEP, especially during
April-September 1997. Ekman processes driven by anomalous winds played a
role in creating the NEP warm pool - a triangular region of relatively warm
water between Hawaii, Vancouver Island and Baja California. The first major
impacts of the EN on the NEP did not commence until November 1997. These
insights suggest new ways to monitor climatic changes that may affect
marine populations in the NEP. [FIGURES 5-6].
Comparing decadal differences in wind-forced circulation of the North
Pacific – At mid-latitudes in the North Pacific, zonal winter
wind stress doubled in the decade following the 1976 climate shift, leading
to increases in several derived ocean variables: southward Ekman transport;
upwelling due to Ekman pumping; turbulent mixing; and total poleward and
zonal transport. Transports of the North Pacific Current and the
subtropical gyre increased. All of these modifications are likely to be
associated with significant changes in the advection and distribution of
heat, nutrients, and organic material throughout the basin. [FIGURES
7-8].
PUBLICATIONS FROM THIS PROJECT:
Mendelssohn, R., F. Schwing, C. Roy, and R. Parrish. Common and Uncommon
Trends in Oceanic Parameters off South America, unpubl. ms.
Murphree, T. and F. Schwing. Extratropical factors affecting the
evolution of the 1997-1998 El Niño, unpubl. ms.
Murphree, T. F. Schwing, and L. DeWitt. Multiple wave trains and the
analysis of climatic teleconnections during El Niño and La
Niña events, unpubl. ms.
Schwing, F. and T. Murphree. The Northern Oscillation Index (NOI): a
climate index for the northeast Pacific, unpubl. ms.
Monterey, G. and L. DeWitt. 1998. Seasonal to interdecadal variability
of the North Pacific circulation based on the climatological data and the
Princeton Ocean Model. EOS 79(1): OS72.
Monterey, G. and L. DeWitt. 1998. Seasonal cycle of the North Pacific
circulation based on the climatological data and the Princeton Ocean Model.
Proceedings of the Princeton Ocean Model Users Meeting, Rosenstiel School
of Marine and Atmospheric Science, Miami, 32 pp.
Murphree, T. and F.B. Schwing. 1998. Tropical–Extratropical
Interactions in the North Pacific Region During the 1997-1998 El Nino. EOS
79(1): OS73.
Murphree, T. and F.B. Schwing. 1998. The origins and impacts of the
1997-1998 El Nino. EOS 79(45): F522.
Parrish, R.H., F.B. Schwing, and R. Mendelssohn. 1998. Shifting
Mid-latitude Winds: A Mechanism for Decadal Climate Change in the North
Pacific. EOS 79(1): OS72.
Schwing, F.B. 1998. Patterns and mechanisms for climate change in the
North Pacific: the wind did it. In: Proceedings, ‘Aha Huliko’a
Hawaiian Winter Workshop, (G. Holloway, P. Müller and D. Henderson,
eds.) SOEST Special Publication, University of Hawaii at Manoa, Honolulu,
HI. pp. 29-36.
Schwing, F. B., P. Orton, D. A. Jay, H. Batchelder, and L. K. Rosenfeld.
1999. Conference Explores El Nino's Relationship to the Northeast Pacific.
EOS 80: 122-127.
ADDITIONAL SCIENTIFIC PRESENTATIONS FROM THIS PROJECT:
DeWitt, L. and R. Mendelssohn. Accessing and Visualizing Archived and
Near Real-Time Data Sets for Monitoring Oceanographic Change. CalCOFI
Conference, November 1998, Pacific Grove, CA.
Brodeur, R., P.T. Strub, F. Schwing, M. Ohman and H. Batchelder.
Retrospective data analysis in the US GLOBEC Northeast Pacific (NEP)
program. PICES, October 1998, Fairbanks, AK.
DeWitt, L. and R. Mendelssohn. Accessing and Visualizing Archived and
Near Real-Time Data Sets for Monitoring Oceanographic Change. Eastern
Pacific Ocean Conference, September 1998, Mt. Hood, OR.
Murphree, T. and F.B. Schwing. The evolution and impacts of the
1997-1998 El Nino. Eastern Pacific Ocean Conference, September 1998, Mt.
Hood, OR.
Schwing, F.B. and T. Murphree. Anomalous ocean conditions in the
Northeast Pacific, 1997-1998: El Nino or not?. Eastern Pacific Ocean
Conference, September 1998, Mt. Hood, OR.
Schwing, F.B. Time Series: New Methods, Fisheries and the Environment.
Alaska Fisheries Science Center, Seminar Series, February 1999, Seattle,
WA.
FIGURES
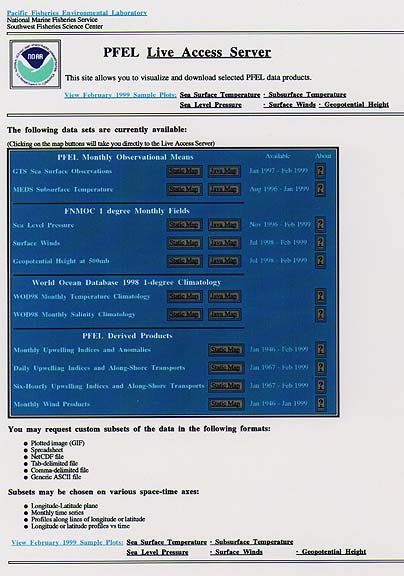
FIG. 1. Users entering the PFEL Live Access Server (LAS) will get this
image, which allows access to the data sets shown. This front end shows the
data sets or products and the period they are available. Information about
the data set can be viewed by pressing the "?". Users also can
view the most recent monthly global images of several fields (example is
Fig. 4).
The URL for the LAS is
http://www.pfeg.noaa.gov/whats_new/las_whats_new.html
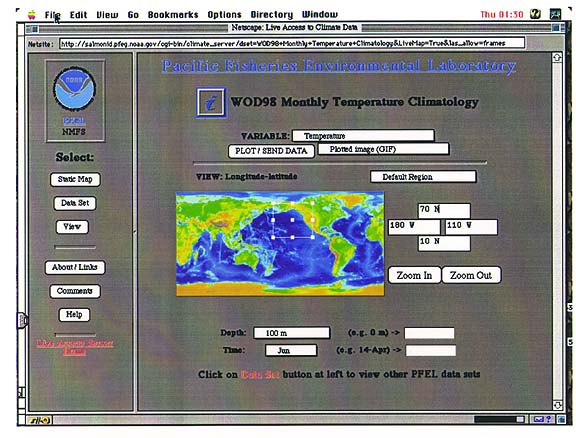
FIG. 2. Users selecting a Static Map or Java Map option for one of the
data sets will receive an image similar to this. Options allow the user to
select the variable, format, geographical region, depth (if applicable),
and time. The user also can change the data set, and view by lines (e.g.
depth profile, time series), planes (e.g. long-lat, depth-time), and
volumes (e.g. long-lat-depth).

FIG. 3. Pressing the "PLOT/SEND DATA" button will display a
map image similar to that shown here, or a list of the data, depending on
the user’s request. Shown is the June climatology of 100m temperature
for the NEP.
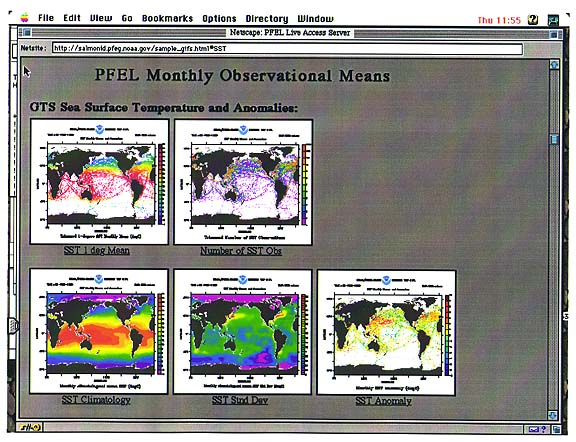
FIG. 4. This is an example of some of the updated monthly global
summaries available via the PFEL LAS. These maps are based on the February
1999 data and the February monthly climatologies. Updates are available a
few days after the beginning of the month.

FIG. 5. Monthly anomalies of SST, surface wind velocity, and outgoing
long-wave radiation (OLR, a proxy for atmospheric convection) for the
Pacific during May 1997. Positive (negative) anomalies are hatched
(shaded). An unusually weak North Pacific High led to anomalous cyclonic
winds in the NEP and were associated with weaker trades extending into the
western equatorial Pacific. The anomaly of the curl of the wind stress (not
shown) displays a pattern similar to, and consistent with, the SST
anomalies. Positive (negative) SST anomalies were overlaid by negative
(positive) curl, which presumably resulted in less (greater) Ekman pumping.
Anomalies of subsurface temperature (not shown but similar to Fig. 8) are
consistent with this idea that ocean anomalies in early 1997 were due to
regional atmospheric anomalies rather than tropical El Niño
processes.

FIG. 6. Derivation of extratropical Northern Oscillation Index (NOIx),
an index analogous to the SOI. The NOIx was developed to provide a time
series that integrates physical variability in the North Pacific. Shown
here are the monthly time series of sea level pressure (SLP) at 35°N
135°W, the approximate center of the North Pacific High (NPH) for
1981-1998 and its climatology (upper panel); the SLP anomaly of the NPH
compared to SLP anomalies at Darwin and Tahiti, the series contributing to
the SOI (middle panel); and the NOIx (NPH-Darwin) and SOI (Tahiti-Darwin)
time series (lower panel). The lower panel reflects similarities
as well as differences in the SOI and NOIx. Both series show the major El
Niño (negative) and La Niña (positive) events, but the
amplitude and timing differs between the two. The NOIx identifies La
Niña events more strongly, and may generally better reflect
variability in the NEP than the SOI. These series are being compared from
1951, and with a number of other physical and biological time series in the
NEP.

FIG. 7. a) Winter (DJF) mean wind stress over North Pacific, averaged
for decade 1977-86. Compared to decade average for 1966-75, stress was
greater across central North Pacific (30-40°N), and more northward
directed in NEP. b) Change in Ekman surface transport, estimated from
difference in winter wind stress during 1977-86 less 1966-75. Surface
transports became more southward (northward) south (north) of 40°N,
and increased into Gulf of Alaska and toward the west coast. c)
Change in vertical velocity (upwelling), estimated from divergence in Ekman
transport (center panel). Blue (red) shades denote areas of relatively
greater (less) upwelling. The pattern suggests an increase in winter
upwelling over a large area of the central North Pacific and Bering Sea,
but less winter upwelling in the eastern Gulf of Alaska and southern
California Current.
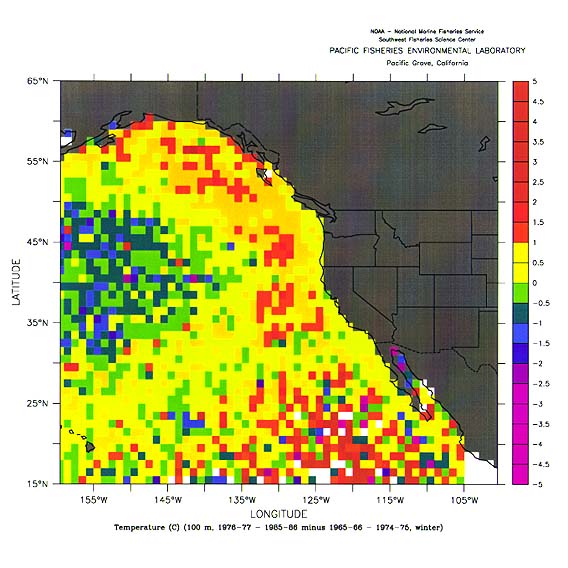
FIG. 8. Decadal difference in winter temperature at 100m, 1977-86 less
1966-75. Red/orange denotes relatively warmer; blue denotes relatively
cooler. The pattern of cooling in the central North Pacific and warming
around the basin periphery corresponds with the pattern of upwelling
estimated from Ekman divergence. It also is very similar to the
temperature anomaly field observed during the 1997-98 El Niño.