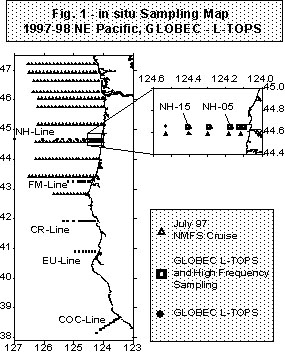
Figure 1. In situ sampling map. 1997-98 NEP-GLOBEC LTOP
As part of the west coast GLOBEC long-term observation program we began measuring nutrient and chlorophyll distributions off the Oregon coast in July 1997. Three types of sampling have been conducted: a broad scale sampling in July 1997 (with R. Emmett, NOAA/NMFS) included eleven transects extending from the shore to 120 mi. offshore, high frequency sampling along the Newport hydroline (with B. Peterson, NOAA/NMFS), and additional sampling along 1-5 other transects every few months (with R. Smith et al. Oregon State University). General features of the broad scale survey include evidence of more upwelling, increased nutrients and higher chlorophyll in the southern half of the region compared with the northern half. High frequency sampling along the Newport hydroline showed less upwelling, lower nutrients and lower chlorophyll compared to non-El Niño years. Comparison of the nutrient and chlorophyll distributions with physical data will be presented to suggest the magnitude of the impact of changes in upwelling dynamics on primary production.
Goals of the biological studies of the Northeast Pacific (NEP) GLOBEC and El Niño sampling are to address three questions:
1. How do shifts in climate affect the distribution of nutrients and
primary production?
2. How did the 1997-1998 El Niño condition affect nutrients and
primary production off Oregon?
3. How do variations in physical and biological processes off Oregon
affect poleward moving coastal and California Current waters?
Methods
We used three spatial/temporal schemes for sampling. During July 1997 we sampled 11 transects extending from 42-47°N and 124-127°W (Fig. 1). Our NEP-GLOBEC sampling included 2-5 transects off Oregon and northern California (Fig. 1) during September and November 1997, and January, April, and August 1998. In addition high frequency sampling (once or twice a month) was carried out along the inner portion of the Newport line (Fig.1).

Figure 1. In situ sampling map. 1997-98 NEP-GLOBEC LTOP
Results
The spatial distribution of temperature, nitrate, chlorophyll, and organic carbon in surface water (43-47°N and 124-127°W) is shown in Fig. 2.
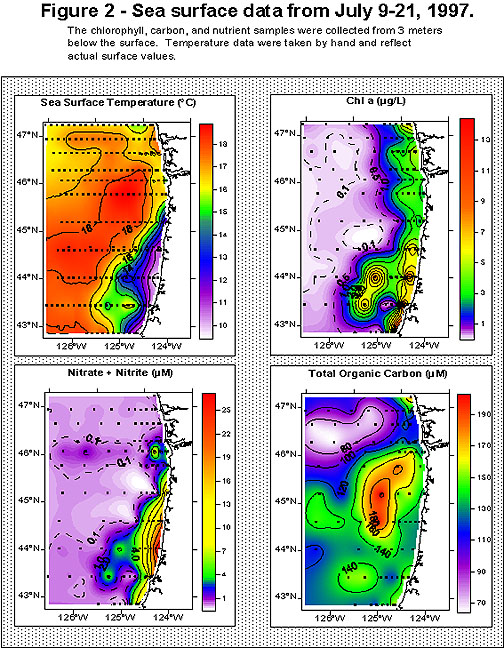
Figure 2. Sea surface data from July 9-21, 1997. Chlorophyll, carbon, and nutrient samples were collected from 3 meters below the surface. Temperature data were taken by hand and reflect actual surface values.
| Table 1. REGIONAL COMPARISON: | ||||
|---|---|---|---|---|
| Region | Temp (°C) | NO3 (mM) | Chl (mg/L) | TOC (mM) |
| Offshore | 18 | <0.1 | <0.1 | <80 |
| Columbia River Plume | 18 | <1.0 | 0.1-0.5 | 140-200 |
| N. Coast | 16 | 2-6 | 2-4 | 120-140 |
| S. Coast | 10-14 | 6-26 | 2-14 | 120-140 |
High frequency sampling along the Newport transect showed that El Niño conditions resulted in a 2°C increase in surface temperature (Fig. 3), a 50% reduction in integrated nitrate (Fig. 4), and a 70% reduction in integrated chlorophyll (Fig. 5).
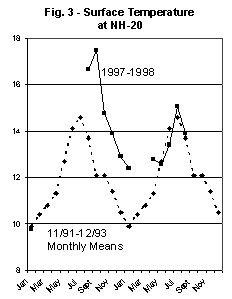
Figure 3. Surface Temperature at NH-20.
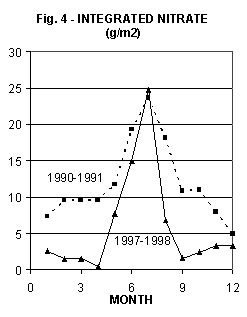
Figure 4. Integrated Nitrate (g/m2) by month for 1990-91 and 1997-98.
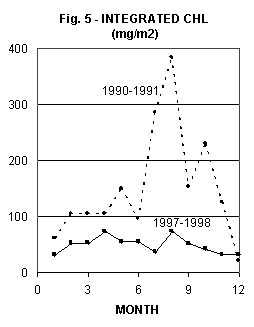
Figure 5. Integrated Chlorophyll concentration (mg/m2) by month for 1990-91 and 1997-98.
Results from the September 1997 GLOBEC Newport transect confirm the low nutrient levels in the upper 20-30 m along the Newport line all the way from 160 m offshore to the coastline (Fig. 6). These low nutrient conditions were accompanied with low chlorophyll levels and a subsurface chlorophyll maximum at about 30 m (where nitrate levels were about 1 mM) (Fig. 6). By August 1998 normal upwelling conditions had returned accompanied by much higher chlorophyll levels throughout the water column and a chlorophyll maximum in the surface water near the coastline (Fig. 6).
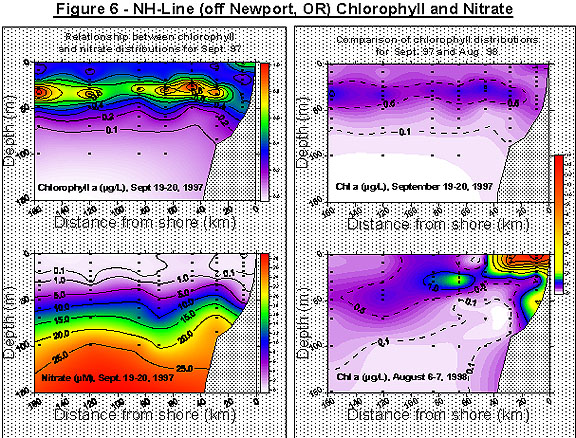
Figure 6. Chlorophyll and NItrate for NH-line off Newport, Oregon.
Conclusions and future work
The 1997-1998 El Niño resulted in significantly warmer and nutrient depleted water off the coast of Oregon. The low levels of nutrients are probably the primary cause for the reduced levels of chlorophyll and primary production. By August 1998 conditions had returned to normal in terms of the total standing stock of chlorophyll and the patterns of distribution with depth.
During the next two years of sampling we hope to provide further analysis of the causes and consequences of variations in lower trophic level activity along the coast of Oregon and its influence on the characteristics of southward flowing water in the California Current.
References
Hill, J. and P.A. Wheeler. 1999. Variations in concentrations and C:N ratios of dissolved and particulate organic carbon and nitrogen in Oregon coastal and offshore waters. ASLO Ocean Science Meeting, Santa Fe, New Mexico, February 1-5.
Hill, J. Temporal and spatial distribution of DOC and DON in the surface waters off the Oregon coast. Master's Thesis, Oregon State University, in preparation (1998).
Corwith, H. Comparison of nutrient and chlorophyll levels off the coast of Oregon between El Niño and non-El Niño years. Master's Thesis, Oregon State University, in preparation (1999).