Report of
R/V Lawrence M. Gould Cruise LMG01-03
to the
Western
Antarctic Peninsula
18 March to 13
April 2001
United States Southern Ocean
Global Ocean
Ecosystems Dynamics Program
Report Number
1
Report of
R/V Lawrence M. Gould Cruise LMG01-03
to the
Western
Antarctic Peninsula
18 March to 13
April 2001
LMG01-03 report prepared by Richard Limeburner,
Robert Beardsley, Mark McDonald, Sue Moore and Deborah Thiele
United States
Southern Ocean
Global Ocean
Ecosystems Dynamics Program
Report Number 1
Available
from
U.S.
Southern Ocean GLOBEC Planning Office
Center
for Coastal Physical Oceanography
Crittenton
Hall
Old
Dominion University
Norfolk,
VA 23529
Sponsored
by Office of Polar Programs, National Science Foundation


Acknowledgments
This
cruise report was prepared by Richard Limeburner, Bob Beardsley, Mark
Macdonald, and Deb Thiele. We especially thank Captain Sanamo and the officers
and crew of the R/V Gould Cruise
LMG01-03 for their skill and superb assistance, which allowed deployment of the
moorings and drifters under difficult weather conditions, observations of the
marine mammals, and completion of the hydrographic survey. Often, the moorings
were deployed in heavy seas among icebergs and the ship’s officers were still
able to navigate the ship to specified mooring deployment sites.
Special
thanks to Skip Owens of Raytheon Polar Services (RPS) for coordinating the
successful mooring deployment operations. The successful mooring planning,
design, and deployments were primarily due to the efforts of Scott Worrilow,
with assistance from Ryan Schrawder and Jim Ryder. Thanks also to Andy Nunn,
Jenny White, and Jonette Tuft of RPS for helping on deck and maintaining and
operating the shipboard scientific equipment and coordinating this instrumentation
with the scientific party. Thanks to Claudia Cenedese for helping with the CTD
stations and mooring deployments. This research effort is sponsored by the
National Science Foundation, NSF research grant OCE-99-10092. All data and
results in this report are to be considered preliminary.
Table of Contents
1. Purpose
2. Accomplishment Summary
3. Cruise Results
3.1 Bathymetric Survey
3.2 Mooring Deployments
3.3 Hydrographic Data
3.3.1 Calibration
3.3.2 CTD Data
4. Meteorological Measurements
4.1 Introduction
4.2 Instrumentation
4.3 Data Acquisition and Processing
4.4 Description of Cruise Weather
5. Marine Mammal Observations
5.1 Acoustic Census of Mysticete Whales
5.2 Visual Survey, Photo Id And Biopsy Summary
6. Chief Scientist’s Log of Daily Events
7. Cruise Personnel
Acknowledgements
Appendix 1 Bathymetric Surveys of the Mooring Sites
Appendix 2 Drifter tracks
1. Purpose
The primary purposes of cruise R/V Lawrence M. Gould (LMG01-03) were to deploy a Woods Hole Oceanographic Institution (WHOI) array of six current meter moorings near Marguerite Bay, deploy a Scripps Institute of Oceanography (SIO) moored array of eight whale acoustic recording packages (ARPS) along the western Antarctic Peninsula, deploy 6 near-surface satellite-tracked drifters, and to conduct a marine mammal survey of the Marguerite Bay region. This report summarizes the events that occurred during cruise LMG01-3 on the R/V Gould.
A central hypothesis of the Southern Ocean Global Ocean Ecosystems Dynamics (SO GLOBEC) collaborative research program is that a unique combination of physical and biological factors contribute to the enhanced growth, reproduction, recruitment, and survivorship of Antarctic krill (Euphausia superba) on the central western Antarctic Peninsula (WAP) shelf. In particular, this region provides the following conditions that are especially favorable to winter survival of larval and adult krill: a) a clockwise shelf circulation that retains the krill population in a favorable environment for extended periods of time; b) an early and long-lasting ice cover that provides dependable food and protection for larval krill to grow and survive over winter; and c) on-shelf intrusions of warm, salty, nutrient-rich Upper Circumpolar Deep Water, which affects hydrographic and ice properties and enhances biological production. The moored array, drifter, and float component of the Southern Ocean GLOBEC program is investigating shelf circulation processes and their spatial and temporal variability using long-term moorings and satellite-tracked Lagrangian drifters and isobaric floats. Supporting data on the surface forcing (wind stress and heat flux) will also be obtained and the combined data set used to describe the shelf circulation and water property variability on vertical scales of 10s of meters and time scales from hourly to seasonal.
2. Accomplishment Summary
The severe Antarctic weather was a potential limiting factor during cruise LMG01-3. Winds were often greater than 20 kts during the cruise and all science operations were halted when the winds were greater than 35 kts. However, only one day was spent waiting for an improvement in weather conditions. During the cruise, we successfully deployed the six current meter and eight whale acoustic moorings along the western Antarctic Peninsula, deployed six near-surface drifters, made marine mammal observations of the region, and made six conductivity-temperature-depth (CTD) casts at the WHOI moorings. The LMG01-03 cruise track is shown in Figure 1 and mooring deployment locations are shown in Figure 2.
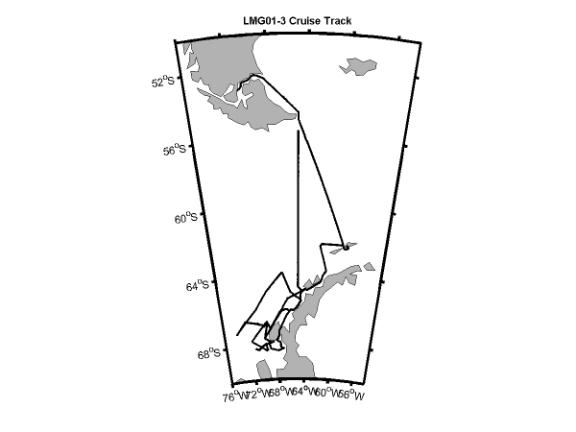
Figure 1. LMG01-3 cruise track
.
3. Cruise Results
We
departed Punta Arenas, Chile at 1330 UTC on 18 March 2001, accompanied by 40 kt
winds and steamed east through the Straits of Magellan, and then south to the
Drake Passage. The passage to Antarctica took four days and the seas were
typically rough with 20 to 40 kt winds but relatively mild air temperatures. We
arrived at King George Island on 23 March and offloaded two scientists and
equipment by evening, then steamed to the northern whale acoustic mooring site
S8, where we deployed the mooring in rough seas. The R/V Gould then steamed to Palmer Station and arrived early on 24
March. The day at Palmer station was spent offloading personnel and supplies
and repositioning the mooring anchors and buoys on the ship in preparation for
the upcoming mooring deployments.
3.1
Bathymetric Surveys
Digital depth data was collected with a Knudsen fathometer from Punta Arenas to Palmer Station, using a sound speed of 1500 m s-1. The sound speed, based on CTD data collected in Marguerite Bay during the January 2001 LTER cruise, was changed to 1459 m s-1 on 25 March just before leaving Palmer Station. The sound speed was changed to 1449 m s-1 on 28 March at 1949 UTC and changed back to 1459 m s-1 on 29 March at 2000 UTC. We made a small-scale bathymetric survey at each of the mooring sites prior to deployment and the results of these surveys are shown in Appendix 1.
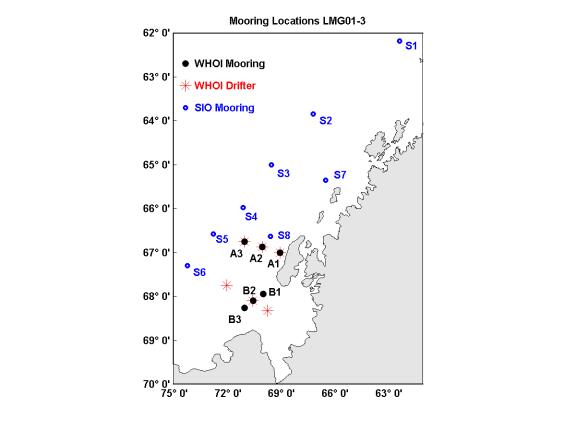
Figure 2. Locations of the moorings and
drifters deployed on LMG01-03.
3.2 Mooring Deployments
The R/V Gould departed Palmer Station at
1400 UTC on 25 March 2001 and steamed to the whale acoustic mooring site S7.
The mooring was successfully deployed at night under rough seas. A CTD station
planned for the S7 site was cancelled due to 35 kt winds and the rough seas.
The ship then arrived at the A1 mooring site at 1200 UTC on 26 March and we
first made a detailed bottom survey of the local bathymetry. The moorings are
designed for a specific depth and the A1 mooring site had very rough
bathymetry, but a suitable site was found for the deployment (Appendix 1). The
mooring locations are shown on Figure 2 and listed in Table 1.
The A1
mooring was deployed on 26 March under difficult working conditions. Strong
winds were diminishing and the wind was from a different direction than the
swells. The deck was awash during the deployment and we were informed that
those conditions were as good as we should expect. After the deployment, we completed
CTD 1 at the A1 mooring site and deployed a near-surface satellite tracked
drifter.
Table 1. LMG01-3 mooring and CTD station locations.
Station |
Date |
Time UTC |
Latitude |
Longitude |
Depth (m) |
|
Deploy S1 Mooring |
3/23/01 |
0706 |
62° 16.470' S |
62° 10.000' W |
1651 |
|
Deploy S7 Mooring |
3/25/01 |
2349 |
65° 22.620' S |
66° 28.210 W |
450 |
|
Deploy A1 Mooring |
3/26/01 |
1940 |
67° 01.134' S |
69° 01.217' W |
450 |
|
CTD 1 |
2/26/01 |
2121 |
67° 01.970' S |
69° 02.260' W |
306 |
|
Deploy Drifter 30460 |
2/26/01 |
2149 |
67° 02.400' S |
69° 03.000' W |
400 |
|
Deploy S8 Mooring |
2/27/01 |
0132 |
66° 38.241' S |
69° 33.095' W |
407 |
|
Deploy B3 Mooring |
3/29/01 |
1242 |
68° 15.345' S |
70° 59.853' W |
450 |
|
CTD 2 |
3/29/01 |
1340 |
68° 15.610' S |
70° 59.890' W |
440 |
|
CTD 3 |
3/29/01 |
1637 |
68° 06.120' S |
70° 31.950' W |
616 |
|
Deploy B2 Mooring |
3/29/01 |
2018 |
68° 06.091' S |
70° 31.675' W |
811 |
|
CTD 4 |
3/29/01 |
2237 |
67° 56.920' S |
69° 54.380' W |
467 |
|
Deploy B1 Mooring |
3/30/01 |
0212 |
67° 56.890' S |
69° 54.398' W |
444 |
|
Deploy Drifter 26373 |
3/30/01 |
0456 |
68° 19.920' S |
69° 42.109' W |
256 |
|
Deploy Drifter 24406 |
3/30/01 |
0722 |
68° 06.162' S |
70° 31.797' W |
809 |
|
Deploy Drifter 30461 |
3/30/01 |
1132 |
67° 45.216' S |
71° 58.957' W |
340 |
|
CTD 5 |
3/30/01 |
2015 |
66° 51.0' S |
70° 00.0' W |
567 |
|
Deploy A2 Mooring |
3/30/01 |
2015 |
66° 51.883' S |
70° 00.683' W |
564 |
|
Deploy Drifter 30458 |
3/31/01 |
0018 |
66° 52.331' S |
70° 01.168' W |
569 |
|
CTD 6 |
3/31/01 |
1112 |
66° 45.010' S |
70° 59.900' W |
782 |
|
Deploy A3 Mooring |
3/31/01 |
1439 |
66° 45.002' S |
70° 59.991' W |
490 |
|
Deploy Drifter 30459 |
3/31/01 |
1500 |
66° 44.543' S |
71° 00.012' W |
491 |
|
Deploy S5 Mooring |
3/31/01 |
1940 |
66° 35.197' S |
72° 42.311' W |
3450 |
|
Deploy S6 Mooring |
4/1/01 |
0250 |
67° 17.900' S |
74° 10.800' W |
3059 |
|
Deploy S4 Mooring |
4/1/01 |
1403 |
65° 58.400' S |
71° 04.100' W |
2962 |
|
Deploy S3 Mooring |
4/1/01 |
2153 |
64° 59.406' S |
69° 28.795' W |
2521 |
|
Deploy S2 Mooring |
4/2/01 |
0658 |
63° 50.799' S |
67° 08.829' W |
3056 |
During
the night of 26 March, we steamed to the whale-acoustic mooring site S8 and
made a brief bottom survey of the region before deploying the S8 mooring. The
bathymetry at the S8 site is shown in Appendix 1. After the S8 mooring deployment,
the barometer began to fall and the winds increased in strength. At sunrise on
27 March, the winds were over 50 kts from the northeast and the barometer, at
950 mb, was dropping 3 mb hr-1. We spent the day at the A2 mooring
site, waiting for the weather to improve. At 2000 UTC, the winds were not
decreasing, the barometric pressure was 948 mb and holding, and the seas were
building to over 6 meters, so the Captain decided to steam into Marguerite Bay
and find some shelter from the seas.
On the
morning of 28 March, we were in Marguerite Bay, off the south end of Adelaide
Island. The winds were still above 40
kts and the temperature had fallen to -5°C, but the seas were more moderate than offshore. We decided to bottom survey the three
mooring sites located along the B line. Target mooring deployment positions
were defined from the bathymetric surveys at the B line (Appendix 1).
The
morning of 29 March was clear with 10 kt winds and mooring B3 was deployed at
1242 UTC. We then made a CTD cast, CTD
2, at the B3 mooring site. The B2 mooring was deployed at 2018 UTC on 29 March
and CTD 3 was made at the B2 mooring site. The seas were still calm, so we
decided to deploy a third mooring that day and mooring B1 was deployed in the
evening and CTD 4 was made at the B1 mooring site. During the night of 29
March, we deployed three drifters near the B mooring line while steaming to the
A line.
On the afternoon of 30 March, we made a bathymetric survey of the A2 mooring site. CTD 5 was completed in the late afternoon at the A2 mooring site and we then deployed mooring A2 and a drifter. That evening, we made a bathymetric survey of the A3 mooring site and, on the following mooring, we completed CTD 6 and deployed A3. During the afternoon of 31 March, we began deploying the remaining five SIO whale acoustic moorings. S5 and S6 were deployed on 31 March, S4 and S3 on 1 April, and S2 on 2 April. The mooring and CTD locations are both listed in Table 1.
3.3 Hydrographic Data
The
ship’s CTD system consisted of a Seabird Electronics Model 911+ CTD
sampling at 24 Hz with a quartz crystal pressure transducer, two temperature
and conductivity sensors pairs, a PAR (Photosynthetically Active Radiation)
sensor, a fluorometer sensor, and a SeaTech 25 cm light transmission sensor.
The CTD fish was lowered at 30 m min-1 and the data were logged with
DOS Seabird Electronics software. The CTD data was averaged into 1-m bins and
the averaged downcast data is presented in this report. The two conductivity
sensors on the CTD agreed with each other within 0.003 m S cm-1, and
thus only one of these sensors was used to process the data in this report.
3.3.1 Calibration
Approximately four water samples were collected at each station for calibration of the conductivity sensors on the SBE-911+ CTD. Figure 3 summarizes the comparison between the conductivity measured by the CTD and the in situ conductivity calculated from the measured salinity obtained from the water sample bottle using a Guildline Salinometer.
The RMS difference in conductivity
between the CTD and the water sample bottles was 0.0048 and no correction was
made to the raw conductivity data. All CTD data in this report will be
transmitted to the National Oceanographic Data Center.
3.3.2
CTD Data
Temperature, salinity and sigma-t profiles
and t/s correlations are shown next for the six CTD casts (Figures 4-9).

Figure 3. Differences between the CTD conductivity and the
seawater sample conductivity during the cruise.
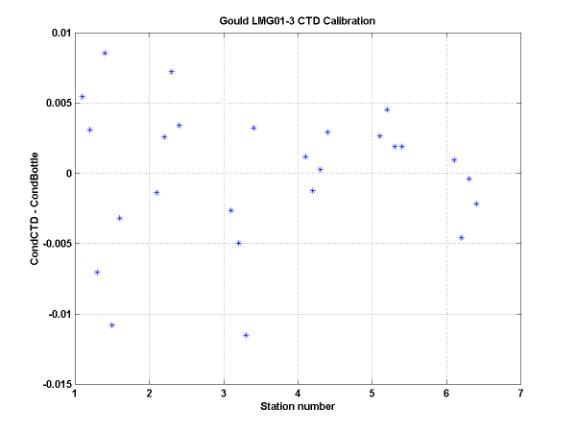
Figure 4. CTD 1 profiles located at WHOI mooring A1.
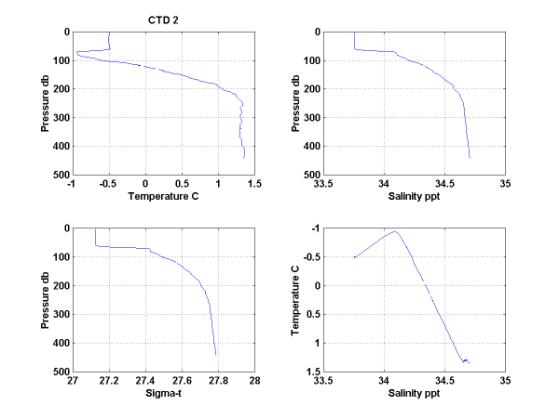
Figure 5. CTD 2 profiles located at
WHOI mooring B3.
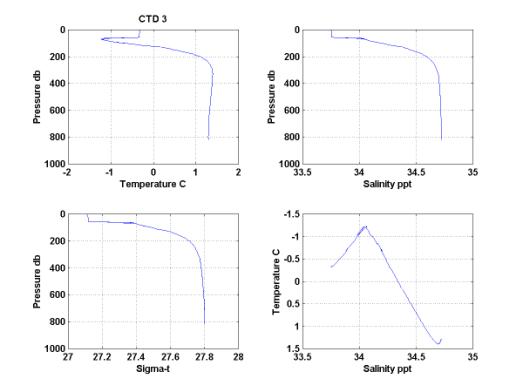
Figure 6. CTD 3 profiles located at
WHOI mooring B2.
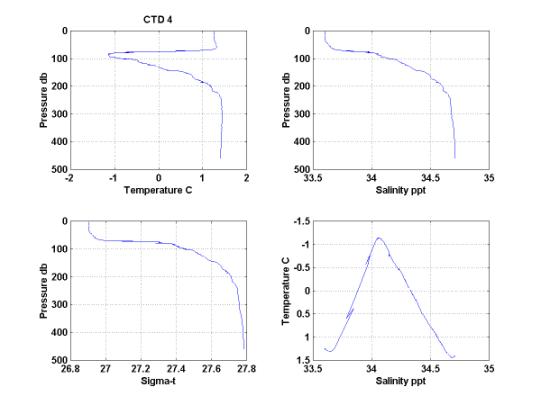
Figure 7. CTD 4 profiles located at
WHOI mooring B1.
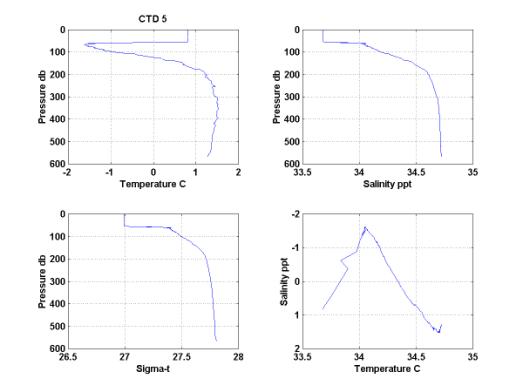
Figure 8. CTD 5 profiles located at
WHOI mooring A2.
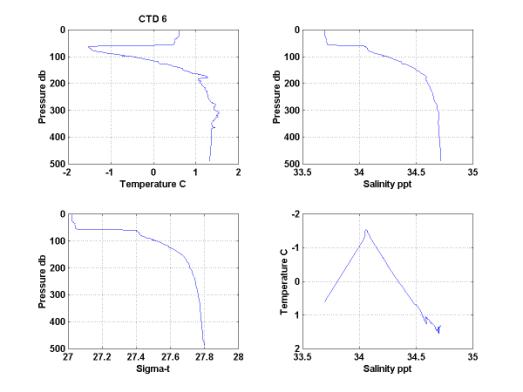
Figure 9. CTD 6 profiles located at
WHOI mooring A3.
4. Meteorological Measurements
4.1 Introduction
A good knowledge of the surface
meteorological conditions during the U.S. SO GLOBEC program is essential to
understand the role of surface momentum and heat flux forcing on the regional
circulation and upper ocean properties. The surface meteorological data are
also useful in interpreting other physical and biological data collected during
the program.
The primary source of surface
meteorological data during U.S. SO GLOBEC will be that collected aboard the L.M. Gould and N.B. Palmer during their cruises in the study area. LMG01-03 is the first U.S. SO GLOBEC
cruise, and this report provides a preliminary description of the
meteorological data collected on this cruise.
The L.M.
Gould left Punta Arenas (PA) on 18 March and arrived at Palmer Station on
24 March (Leg 1). The Gould left Palmer Station on the next
day and returned to Palmer Station from the U.S. SO GLOBEC area to the south on
8 April (Leg 2). The L.M. Gould left Palmer Station on 9
April for PA and arrived on 13 April (Leg 3). A full suite of meteorological
data was collected during the cruise with two exceptions. Neither sea surface
temperature (SST) nor sea surface salinity (SSS) data were collected while the L.M. Gould was docked at Palmer
Station. The ship uses GMT year day
(YD) as given by Global Positioning System (GPS) for time. Leg 2 corresponds to YD = 84.61 to 98.52.
4.2 Instrumentation
The meteorological sensors are mounted on
the ship’s main mast (Figure 10). The
sensors include a pair of wind monitors and other sensors to measure air
temperature (AT), relative humidity (RH), barometric pressure (BP), and
incident shortwave (SW) and longwave (LW) radiation. Sea surface temperature (SST) was measured using a remote sensor
in the intake manifold, and sea surface salinity (SSS) was measured using a
thermosalinograph placed in the wet lab.
The different sensors and their calibration history and installation
dates are given in Table 2. Based on
this table, the port wind monitor and the three radiation sensors (PAR, SW, and
LW) are past their next scheduled calibration.
In particular, the SW and LW sensors have not been recalibrated since
September 1997.
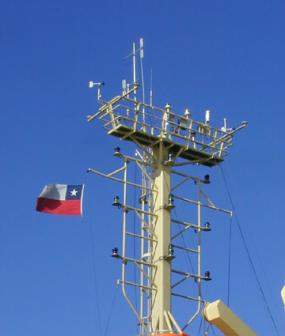
Figure
10. Meteorological sensors mounted on platform
railing on top of mast.
4.3 Data Acquisition and Processing
The raw L.M. Gould shipboard meteorological data were collected using the
ship’s data acquisition system (DAS). A
1-minute processed subset of the raw data was saved at the end of each day in a
flat ASCII text file on the ship’s DAS_DATA directory on drive Q (e.g., the
data for YD=99 and YD=100 are located in Q:\.geopdata\JGOF\jg099.dat and
jg100.dat respectively). This 1-minute
time series was produced using a Joint Global Ocean Flux Study (JGOFS) code
that merged the meteorological data with navigation and other data and combined
the ship’s motion and the measured (relative to the ship) wind speed and
direction data to make "true" wind speed and direction relative to
the ground.
Table
2. LMG01-03 meteorological sensors, their
calibration history, and
time of installation. The last column indicates if the sensor is
to be
re-calibrated every year (A) or every two
years (BA).
|
Variable |
Sensor |
Serial Num. |
Last Cal. |
Next Cal. |
Installed |
Cal. Inv. |
|
Star. Wind |
RM Young 5106 |
WM 28393 |
11/7/00 |
11/7/01 |
12/28/00 |
A |
|
Port Wind |
RM Young 5106 |
WM 35061 |
2/4/99 |
2/4/00 |
8/26/99 |
A |
|
AT, RH |
RM Young 41372VC |
2904 |
11/30/99 |
11/29/01 |
7/23/00 |
BA |
|
BP |
RM Young 61201 |
BP 00873 |
11/30/99 |
11/29/01 |
7/22/00 |
BA |
|
PAR |
Biosp. Inst. QSR-240P |
6394 |
3/22/99 |
3/21/00 |
|
A |
|
SW |
Eppley PSP |
28933F3 |
9/21/97 |
9/21/98 |
|
A |
|
LW |
Eppley PIR |
32031F3 |
9/3/97 |
9/3/98 |
|
A |
|
SST |
Sea-Bird 3-01S |
1619 |
7/27/99 |
7/26/00 |
|
A |
|
SSS |
Sea-Bird 21 |
219209-1577 |
12/30/99 |
12/29/00 |
|
A |
The daily data was obtained from drive Q
and converted into standard variables using the MATLAB m-file
read_gould_met1m(YD). This program also
edits the raw SST data and stores the final data set in a MATLAB mat-file for
each day (e.g., jg100.mat for YD=100).
The raw SST time series contains many values that were below the surrounding
values by ~ 0.2oC to 0.5oC or more. These data dropdowns occurred through the
cruise, with the amplitude and frequency of the dropdowns varying but the
character of the dropdown remaining the same.
A simple filter was used (clean_gould_sst.m) to replace the dropdowns
with linear interpolation. An example of the raw and edited SST is shown in
Figure 11. Any additional hand-editing of the SST and sea surface salinity
(SSS) time series was done at this point and the final edited series stored in
each day’s mat-file (e.g., jg100.mat).
The m-files start_gould_met1m(first_YD)
and merge_gould_met1m(last_YD) were used to combine the 1-day jgxxx.mat files
into a single 1-minute continuous time series for each variable. The merged data were then stored in
gould_met1m.mat.
For further analysis, the 1-minute data in
gould_met1m were low-pass filtered and subsampled using make_gould_met5m into
5-minute time series. The filter used
is the pl66tn set with a half-amplitude period of 12 minutes. Both the
shortwave radiation and PAR time series were corrected for small negative
nighttime biases. The 5-minute data
were then used to estimate the surface wind stress and heat flux components using
bulk methods called by compute_gould_wshf5m.
Two gaps in SST (when the ship was at the Palmer Station dock) were
filled using linear interpolation so that the surface fluxes could be computed
for the entire period of the cruise.
The errors introduced by using the approximate SST at Palmer Station are
small enough to ignore. The surface
wind stress and heat flux data were then added to the gould_met5m, so that this
5-minute contains best versions of the surface meteorological conditions and
forcing for the cruise.
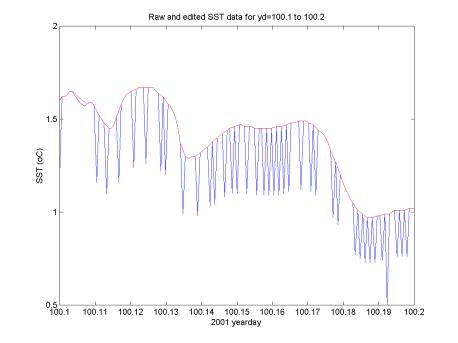
Figure
11. Raw (blue) and edited (red) SST time series
for a 2.4-hour period on YD 100.
As mentioned above, the JGOFS data file
jgxxx.dat placed on drive Q presents only the "true" wind speed and
direction. The actual raw wind measurements
are stored each day in another directory and will be included in the cruise
data cd-rom. Without that data, it is
difficult to make an accurate assessment of the JGOFS code that removes the
ship’s motion from the relative wind measurements made on the mast. A preliminary look can be made by comparing
wind speed and the ship’s speed over the ground (SOG), to see if sudden changes
in SOG are reflected in the wind speed.
The example shown in Figure 12 is not definitive but does suggest that
the JGOFS "true" wind still contains some ship motion. A full analysis of the raw data will be
needed to check the JGOFS code and see if a better code for "true"
wind can be developed. Until this
analysis is done, the wind speed and direction data and those variables that
are functions of wind speed (e.g., wind stress) contained in gould_met1m and
gould_met5m must be considered as preliminary values.
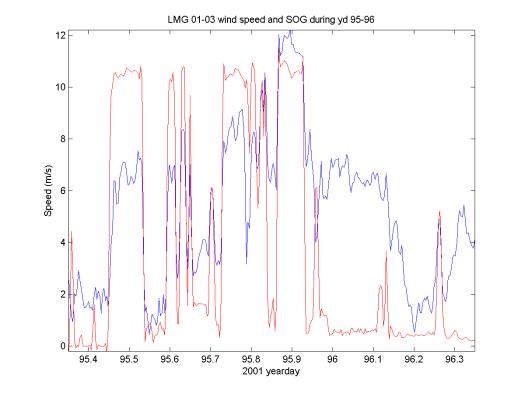
Figure
12. Plot of ship’s speed over the ground (SOG)
from GPS in red and the
JGOFS "true" wind speed. Note how the wind speed tends to jump when
the
ship stops and starts.
4.4 Description of Cruise Weather
Time series of the 5-minute surface
meteorological data are shown in Figure 13 for the entire cruise. During Leg 2
(YD=84.61 to 98.52), a deep low pressure system passed over the region on YD
87, with strong winds above 40 kts towards the southwest to south for almost
two days (peak winds exceeded 50 kts for several hours). As the low pressure system passed, the winds
dropped and a short 3-day period (YD 88-91) followed with winds 10-20 kts
towards the north and northeast. This
good weather window allowed the completion of the WHOI and SIO mooring
deployment work. Winds became strong
again on YD 91-93, with maximum winds between 30 and 40 kts during YD 92. The L.M.
Gould spent the rest of Leg 2 searching for and studying whales in the
inland passages and inside Marguerite Bay until heading back to Palmer Station
on YD 97. During Leg 2, the skies were usually overcast, with occasional snow,
so the downward flux of shortwave radiation was generally small: mean 28 W m-2,
with a maximum of 296 W m-2 on YD 94. The downward flux of longwave radiation dropped from values near
280-300 W m-2 to roughly 200 W m-2 during the few periods
with clear skies. Using this drop as an
indicator of clear skies, there were clear skies for only about 12% of Leg 2.
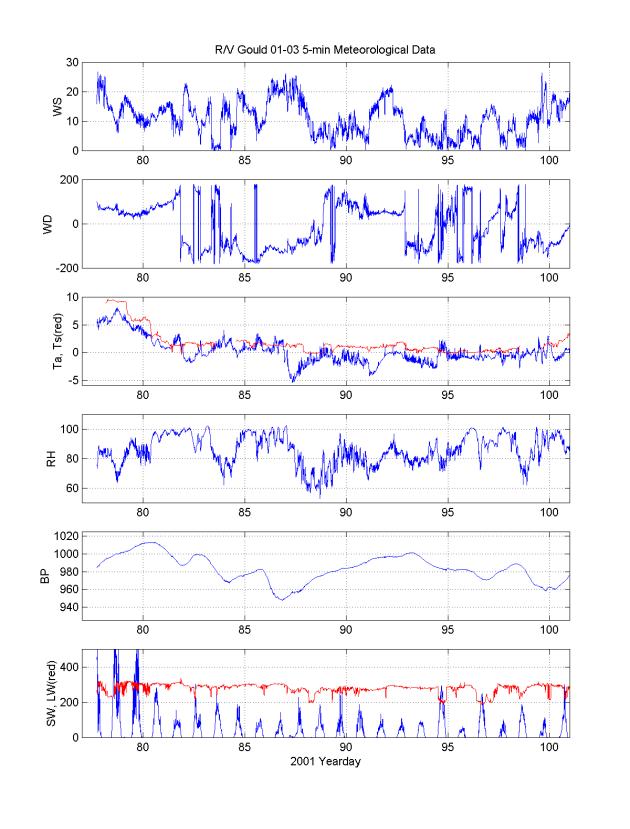
Figure
13. Surface meteorological measurements during
LMG01-03.
5. Marine Mammal Observations
5.1 Acoustic Census
of Mysticete Whales
Most large whales produce
distinctive calls such that passive acoustic methods can be used to study their
distribution, behavior, and minimum absolute abundance. The repetitive call of the ordinary blue
whale is ideal for long-range signal transmission. Although blue whale calls vary by geographic region, each
population produces a characteristic low-frequency (~20 Hz) repetitive call of
roughly 10 to 20 seconds duration, sometimes with multiple components. The detection range for blue whale sounds
from a simple bottom recorder is typically 20 km for a reliable consistent
detection, and longer if one applies matched filter techniques, which require
knowledge of the call character. The
long-term nature of seafloor recorder deployments allows for a statistically
significant number of acoustic encounters even with a widely dispersed whale
population, assuming whales call roughly 10-50% of the time. The recordings will likely also include
sounds from minke, right, fin, and humpback whales.
Mysticete whales will be
detected via reception of their calls on passive, bottom-mounted acoustic
recorders. Detection of whale calls via
moored passive acoustic recorders has proven quite effective during recent
studies, especially for blue and fin whales.
New technology, that of long-term deployments of autonomous low power
recorders, makes an acoustic survey of mysticete whales in remote locations
practical. Deep water is desirable
partly because the ambient noise, which is largely produced at the surface, is
reduced at depth and also because acoustic travel paths will interact less with
the seafloor, which absorbs acoustic energy.
Given the great uncertainty
in the numbers of blue whales in the Southern Ocean (500 to 5000), and in the
subspecies to which they belong, we believe the minimum census estimates which
can be provided by acoustic monitoring is a key goal of the proposed project.
If we were to have 800 acoustic contacts per season, for instance, it would be
clear that the International Decade of Cetacean Research (IDCR) population
estimates are severely underestimating the actual populations. Even in the case where we would obtain 80
acoustic contacts per season, in keeping with the IDCR estimates, we should be
able to provide some estimate of which geographic areas and/or subspecies the
animals are from. Application of the
techniques of point transect theory to the results of the survey where each
acoustic contact is assigned a range should allow a minimum census estimate,
the primary factor which will remain to be answered from other combined visual
and acoustic data being the percent of whales calling during a time constant.
The second fundamental goal
of this work will be minimum population estimates and seasonal occurrence
profiles for fin and humpback whales.
Other species, such as minke and sperm whales, may be detected but are
expected to be so infrequent as to make population density estimates
unreliable. Perhaps the most important overall result of this work will be to
establish an acoustic detection baseline from which to measure future changes
in relative abundance of Southern Ocean mysticete whales.
Throughout the cruise, we
deployed and recorded 36 directional sonobuoys and two broadband sonobuoys,
both randomly and when whales were sighted, as a means to record and thereby
"groundtruth" mysticete whale calls in this remote region. Recordings
were obtained from humpback, minke, and fin whales during the cruise. No blue or right whales were sighted or
heard during this cruise.
We
have deployed eight seafloor acoustic recorders, which each record a hydrophone
that is floated about 5 m above the seafloor continuously at 500 samples per
second for 15 months, writing the data to 36 gigabytes of computer hard drive
in each instrument. The recorders have
a 16-bit dynamic range and are powered by lithium double-D size batteries,
which are placed inside high tensile aluminum pressure cases. The seafloor recorders use a system of drop
weights, benthos glass balls, and an acoustic release for recovery.
5.2 Marine Mammal Visual Survey, Photo ID,
And Biopsy Summary
A visual survey for
cetaceans was conducted on LMG01-03 during daylight hours on all days when
weather conditions allowed. Searching was conducted by the International
Whaling Commission (IWC) observer (Deborah Thiele) and Sue Moore, with
assistance from the rest of the acoustic mooring team. Sightings were recorded
on a laptop-based Wincruz Antarctic program, which also logged GPS position,
course, and ship speed automatically. Seals, seabird concentrations, ice
concentration, SST, and depth were also recorded on the program. Survey effort
generally commenced at first light from the outside bridge wings and/or inside
the bridge (weather dependent) and ceased at dark. Visual surveys alone were
conducted during the oceanographic and acoustic mooring components of the
cruise. Large numbers of humpback whales were observed during the afternoon
transit across the Bransfield Strait. Five days of ship time were allocated to
conduct cetacean survey (including closing on sightings, biopsy, photo
identification, and sonobuoy deployment) from first light on Tuesday, 3 April
to the end of day on Saturday, 7 April. The weather improved for this part of
the survey, with calm seas and a lifting of the Peninsula cloud blanket,
providing us with some rare sunny days! During this time, the ship traversed
the inside channels to the north of, and including, Adelaide Island. In Matha
Strait, two large feeding groups of the dark shouldered minke whale were
sighted (total of 80 animals). Photographs were obtained and biopsies of four
minkes from the largest group were taken. Upon entering the northern end of
Marguerite Bay, just near Rothera Station, a large group (30) of killer whales
were sighted. The killer whales broke into sub-groups and traveled north past
the ship with many accompanying fur seals and a minke whale. One humpback was
also seen in the vicinity. The ship took a southwest course to Neny Island and
then headed across the Bay and towards Palmer Station on a course close to the
coast and inside the islands from Matha Strait onwards. Two pairs of humpbacks
were located late in the afternoon of 7 April, with photo
identification and biopsy obtained from one pair. Total biopsies taken: 5 minke
(one from a group of 7 and 4 from the feeding group of 50) and 5 humpback (one
from one pair and both animals from another two pairs).
Table 4. LMG01-03 marine mammal
observations.
|
Total species |
Total sightings/animals |
|
Fin whale |
1:3 |
|
Minke ordinary |
9:91 |
|
Like minke |
5:14 |
|
Hourglass dolphin |
1:4 |
|
Unidentified cetacean |
1:1 |
|
Unidentified large whale |
3:5 |
|
Killer whale |
4:53 |
|
Ziphiidae |
2:5 |
|
Humpback whale |
38:81 |
|
Humpback whale and like
fin whale (mixed group) |
1:12 |
|
Undetermined minke whale |
18:40 |
|
Like fin whale |
1:3 |
|
Unidentified whale |
4:4 |
|
Total |
88:316 |
6. Chief Scientist's Daily Log
All
times local time,
GMT-4
Sunday
– 18 March 2001
1330 Depart
Punta Arenas with West wind over 40 kt
Steaming eastward out the
Straits of Magellan
1415 Safety
meeting with 2nd Mate
Monday
– 19 March 2001
Steaming south to the Drake
Passage
Tuesday
– 20 March 2001
Steaming south in the Drake
Passage
Wednesday
– 21 March 2001
Steaming south in the Drake
Passage
Deployed 2 test sonobuoys
Thursday
– 22 March 2001, Day 81
0830 Arrived
King George Island
Offloaded Brenda Hall’s
party and gear
1530 Departed
King George Island
Steaming west to SIO mooring
S1
Friday
– 23 March 2001, Day 82
0306 deployed SIO whale acoustics mooring S1 in a snowstorm
Steaming to Palmer
Station
Saturday
– 24 March 2001, Day 83
0800 Arrive
Palmer Station
Offload PS gear
Move mooring gear
Sunday 25 March 2001, Day 84
1000 Depart
Palmer Station
Steaming to SIO mooring S7
Monday
– 26 March 26 2001
0730-1100 A1
bottom survey
0858 Deploy sonobuoy
1130-1530 Deploy
A1 rough seas, wind decreasing, deck awash
1700 CTD 1
1749 Deploy
drifter 30460
Tuesday
– 27 March 27 2001
56 kt winds and barometric
pressure < 948 mb
unsafe to work on deck
1600 steam
to Marguerite Bay for shelter
Wednesday
– 28 March 28 2001
Winds > 40 kts,
unsafe to work on deck
0930 Began
bathymetry survey of B1 mooring site
1700 Began
bathymetry survey of B2 mooring site
2000 Began bathymetry survey of B3 mooring site
Thursday
– 29 March 2001
0530 Began
mooring B3 preparation wind < 10 kts
0630 Deploy
sonobouy
0842 Deployed
B3 mooring
0915 CTD 2
1618 Deployed
B2 mooring
1230 CTD 3
while hydraulics were being repaired
Friday – 30 March 2001
CTD 4
Deploy B1 mooring
Deploy drifter 26373
Deploy drifter 24406
Deploy drifter 30461
Deploy sonobuoy
CTD 5
Deploy mooring A2
Saturday – 31 March 2001
Deploy drifter 30458
CTD 6 at 0700
1039 Deploy
A3 mooring
1100
Deploy
drifter 30459
Deploy
S5 mooring
Deploy S6 mooring
Sunday – 1 April 2001
Deploy S4 mooring
Deploy S3 mooring
Deploy S2 mooring
Monday – 2 April 2001
Deploy S2
Steam to the Grandidier Channel
Begin marine mammal observations
Tuesday – 3 April 2001
Briscoe Islands marine mammal observations
Wednesday – 4 April 2001
North of Adelaide Island marine mammal
observations
Sunny day, minke whales
Thursday – 5 April 2001
Off Rothera marine mammal observations
Killer whales
Friday – 6 April 2001
Marguerite Bay marine mammal observations
Minke whales
Saturday – 7 April 2001
Marguerite Bay marine mammal observations
1200 Steaming back
to Palmer Station
Sunday – 8 April 2001
0800 Arrive Palmer
Station
Monday – 9 April 2001
0900 Depart Palmer
Station for Punta Arenas
Tuesday – Thursday – 10-12
April 2001
Steaming to Punta Arenas
Friday – 13 April 2001
0800 Arrive Punta
Arenas
7. Cruise Personnel
Science Party
Richard Limeburner Chief Scientist
Robert Beardsley Senior Scientist
Scott E. Worrilow Electronics Engineer
Ryan C. Schrawder Electronics Engineer
James R. Ryder Mooring Engineer
John Gunn Scientist
Claudia Cenedese Scientist
Mark A. McDonald Scientist
Sue E. Moore Scientist
Allan W. Sauter Scientist
Ana Sirovic Student
Deborah Thiele Scientist
Brenda Hall Scientist
Ethan Perry Scientist
Robert Farrell Palmer Station
Manager
Kenneth Davis Palmer Station
Craig Bucher Palmer Station
Robert Moore Palmer Station
Roger Gorman Palmer Station
Cheryl Hansen Palmer Station
David Bunker Palmer Station
Michael Rogers Palmer Station
Daniel Naber Palmer Station
Thomas Leipart Palmer Station
Mark Williams Palmer Station
Jose Dominguez Palmer Station
Raytheon Polar Services
Harold H. Owen III Marine Project Coordinator
Jennifer Ann White Marine Technician
Andrew F. Nunn Electronics Technician
Jonnette Tuft Marine Science
Technician
Ship Officers and Crew
Warren M. Sanamo,
Jr. Master
Morris J.
Bouzigard Chief Mate
Jesse Gann 2nd
Mate
Tracy Ruhl 3rd
Mate
Paul B. Waters Chief Engineer
Gerald Tompsett 1st Engineer
Russel Lesser 2nd
Engineer
Noli Tamayo Oiler
Donde Dasoy Oiler
Mark Stone Cook
David Steinberg Cook
Luciano Albornoz Galley Hand
Fernando Naraga Deck
Efren Prado Deck
Rafael Sabino Deck
Dionito Sabinas Deck
Appendix 1
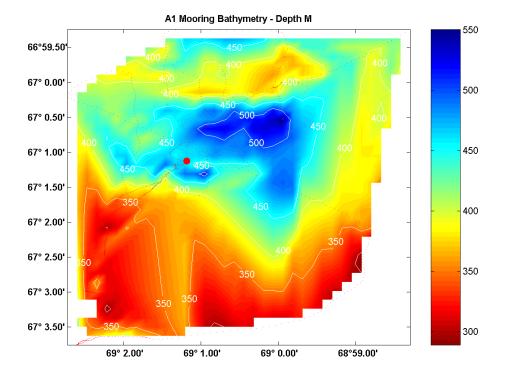
Figure 1.
Bathymetry at the A1 mooring site.
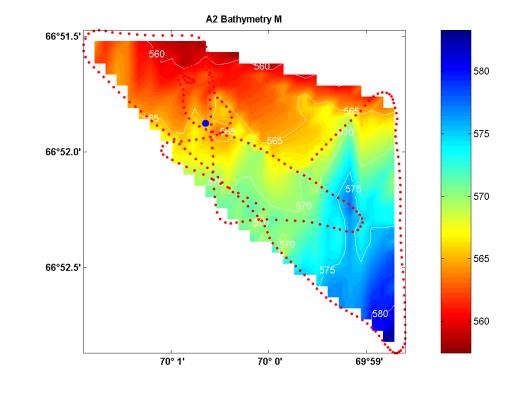
Figure 2.
Bathymetry at the A2 mooring site.
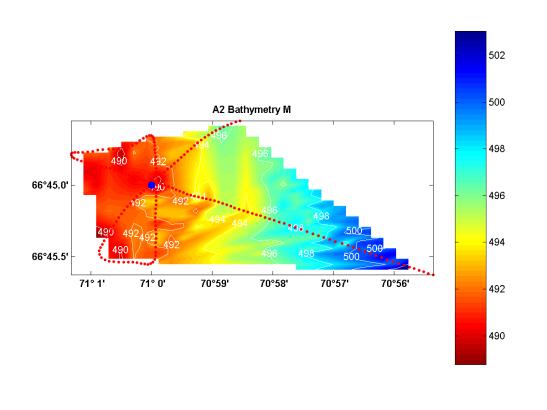
Figure 3.
Bathymetry at the A3 mooring site.
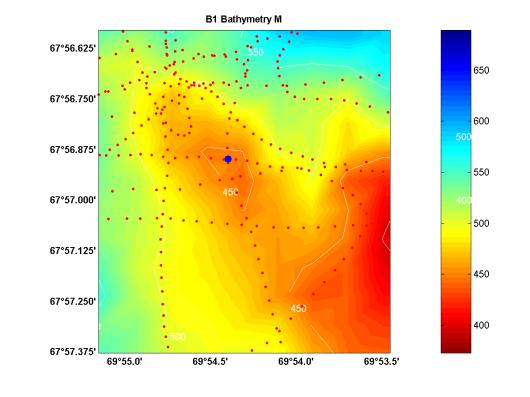
Figure 4. Bathymetry at the B1 mooring site.
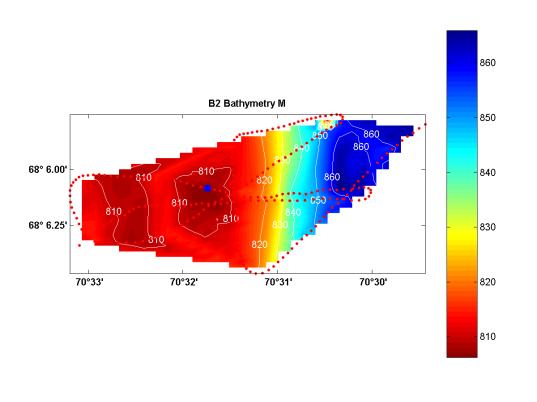
Figure 5. Bathymetry at the B1 mooring
site.
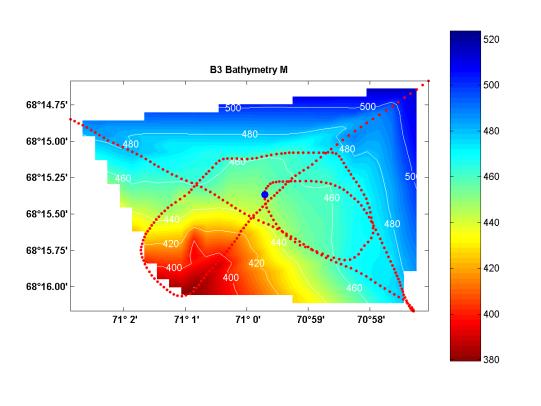
Figure 6. Bathymetry at the B3 mooring site.
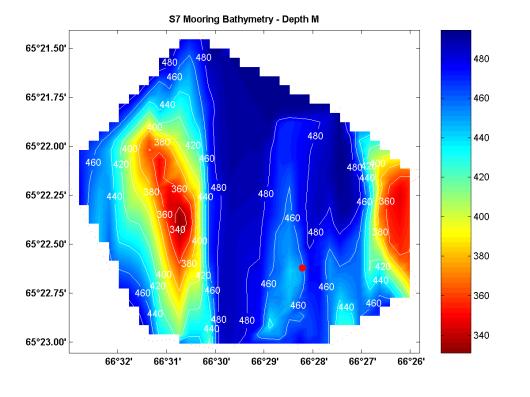
Figure 7. Bathymetry at the S7 mooring site.
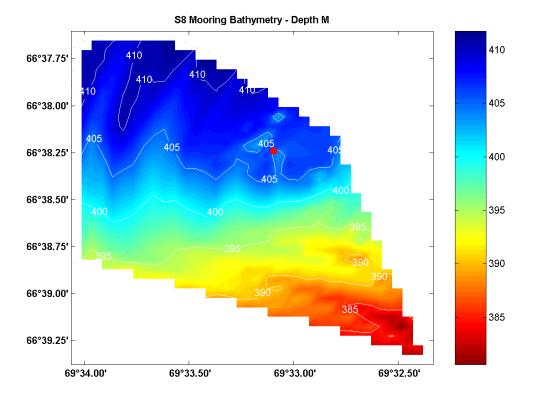
Figure 8. Bathymetry at the S8 mooring site.
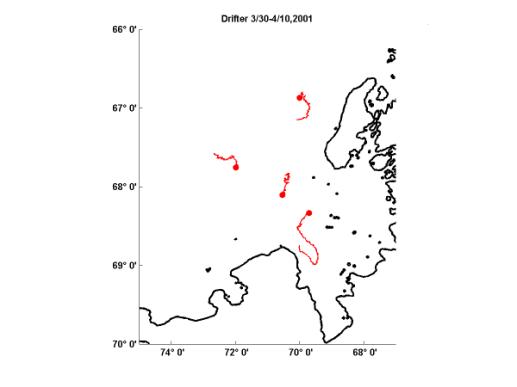
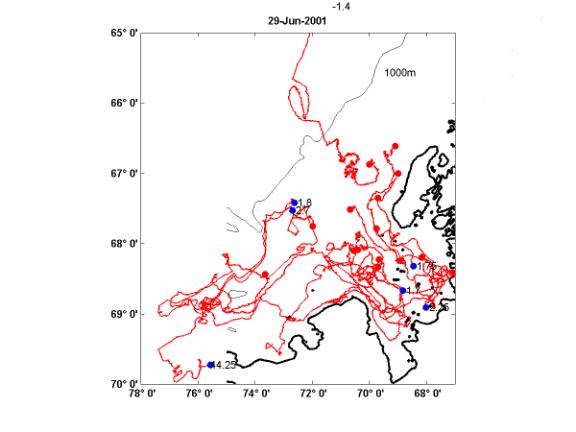
Appendix 2. Drifter tracks