CRUISE REPORT
March 29, 2002
R/V Laurence M.
Gould Cruise LMG02-1A
Punta Arenas
to Punta Arenas
February 6 –
March 3, 2002
In
support of NSF Southern Ocean GLOBEC programs
WinDSSOcK: WINter
Distribution and Success of Southern OCean Krill: Moored Array, Drifter and
Float Measurements
Robert
Beardsley, Richard Limeburner, and Breck Owens
Department
of Physical Oceanography
Woods
Hole Oceanographic Institution
Woods
Hole, MA 02543
rbeardsley@whoi.edu
and
Mysticete Whale Acoustic Census within the SOGLOBEC
West Antarctic
Peninsula Region
Mark
McDonald
2535
Sky View Lane
Laramie,
Wyoming 82070
John
Hildebrand, Sean Wiggins, and Ana Širović
Scripps
Institution of Oceanography
La
Jolla, CA, 92093-0205
Deborah Thiele and Rebecca Pirzl
International
Whaling Commission - SO GLOBEC
Deakin University
Warrnambool, Australia
R/V Laurence M. Gould cruise LMG02-1A
Table of Contents
1. Purpose
2. Accomplishment Summary
3. Mooring, Drifter and Float Measurements
3.2 MooringOperations
3.3 Moored Data Return
3.4 Hydrographic Data
3.4.2 CTD Data
3.6 Float Deployments
4.2 Instrumentation
4.3 Data Acquisition and Processing
4.4 Description of Cruise Weather
4.5 Description of Surface Forcing
5.2 International Whaling Commission Cetacean Sighting and Biopsy Summary
7. Chief Scientist's Log of Daily Events
8. Cruise Personnel
Acknowledgements
Appendix A. Bathymetric
Surveys of the Mooring Sites
Appendix B. Surface
Temperature, Salinity, Fluorescence Maps
Appendix C.
Cruise Event Log
Appendix D. Draft
Moored Array Data Report
R/V Laurence M. Gould cruise LMG02-1A
Punta Arenas
to Punta Arenas
February 6 –
March 3, 2002
1. Purpose
The primary purpose of R/V Laurence M. Gould cruise LMG02-1A was to recover a Woods Hole Oceanographic Institution (WHOI) array of six current meter moorings deployed near Marguerite Bay and redeploy three moorings, recover and redeploy a Scripps Institution of Oceanography (SIO) moored array of eight whale acoustic recording packages (ARPs) along the West Antarctic Peninsula, deploy six near-surface satellite-tracked drifters and twelve satellite-tracked isobaric floats, and to conduct a marine mammal survey of the Marguerite Bay region. This report summarizes the events that occurred during cruise LMG02-1A on the L.M. Gould.
A central hypothesis of the U.S. Southern Ocean GLOBEC collaborative research program is that a unique combination of physical and biological factors contributes to the enhanced growth, reproduction, recruitment and survivorship of Antarctic krill (Euphausia superba) on the central West Antarctic Peninsula (WAP) shelf. In particular, it was thought that this region provides the following conditions that are especially favorable to winter survival of larval and adult krill: a) a clockwise shelf circulation that retains the krill population in a favorable environment for extended periods of time; b) an early and long-lasting ice cover that provides dependable food and protection for larval krill to grow and survive over winter; and c) on-shelf intrusions of warm, salty, nutrient-rich Upper Circumpolar Deep Water which affects hydrographic and ice properties and enhance biological production. To begin to investigate these ideas, the WHOI moored array, drifter and float component was designed to investigate shelf circulation processes and their spatial and temporal variability using long-term moorings and satellite-tracked Lagrangian drifters and isobaric floats. Supporting data on the surface forcing (wind stress and heat flux) will also be obtained and the combined data set used to describe the shelf circulation and water property variability on vertical scales of 10’s of meters and time scales from hourly to seasonal.
Other components of the U.S. Southern Ocean GLOBEC program have been designed to investigate the relationships between krill and their predators, including marine mammals. The SIO moored array was deployed to record sounds made by whales and other marine mammals in the study area over the last year. This information will be used to identify the existence of different types of whales in the West Antarctic Peninsula area, their spatial and temporal distribution, and some sense of their population density. The SIO moored array effort was augmented by a visual marine mammal survey conducted during the cruise by two IWC observers and the deployment of sonobuoys to identify the presence of whales during the IWC survey and hopefully collect simultaneous acoustic and visual data on the same whale.
2. Accomplishment Summary
After conducting a XBT/XCDT/ADCP transect across the Drake Passage, the L.M. Gould left Palmer Station Monday (February 11) and headed south to recover and redeploy WHOI and SIO moorings deployed in the study area last year on cruise LMG01-3. With good working weather for the next eight days and skilled personnel, the mooring work proceeded quite smoothly, with seven of the eight SIO ARPs recovered and five redeployed. With the exception of the S8 instrument, which failed to surface after many release commands were sent, the other SIO instruments worked well, with most returning a full data set. During this same period, five of the six WHOI moorings were also recovered and two new moorings deployed along the C-line. The three WHOI moorings on the northern A-line had no noticeable damage. On the southern B-line roughly across the mouth of Marguerite Bay, the two southern most moorings B2 and B3 were recovered in patchy ice, with damage to the upper instruments due to passing icebergs. The B1 mooring was lost with no trace. On February 19, the first of several storms with high winds curtailed mooring operations and the L.M. Gould steamed into Marguerite Bay to conduct marine mammal survey work in the protected waters east of Adelaide Island. The remaining one WHOI mooring and two SIO ARPs were successfully deployed during short windows of good weather, while the marine mammal survey work was reduced to just a few short periods of conditions suitable for visual search. Despite these limitations, the main concentration of whales was found along the northern ice edge in Marguerite Bay and five biopsies were collected from humpbacks there. Two additional humpbacks were also sampled on Tuesday (February 26) after the L.M. Gould docked at Palmer Station. In addition, a total of six satellite-tracked surface drifters and eight isobaric floats were deployed, and nine CTD casts made at the WHOI mooring sites.
The cruise track for LMG02-1A is shown in Figure 1, and the mooring recovery and deployment and drifter and float launch positions are listed in Table 1.
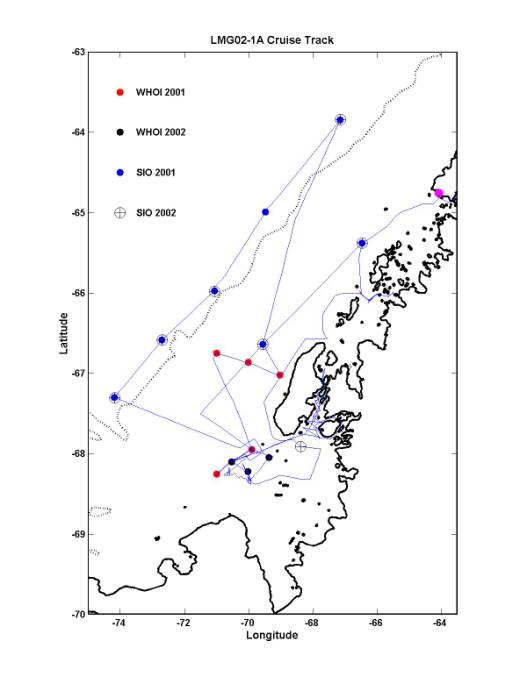
Figure 1. Cruise track for LMG02-1A from Palmer Station (February 11) to Palmer Station (February 26). The red dots show the positions of the WHOI A-line and B-line moorings deployed in 2001, the black dots the three new WHOI moorings deployed on this cruise 2002, the blue dots the SIO mooring positions used in 2001, and the black circle with cross the positions where SIO ARPs were deployed on this cruise. Not shown is SIO S1, located north of Palmer Station, which was recovered and redeployed.
Station
|
Date
|
Time UTC
|
Latitude
|
Longitude |
Depth m
|
|
Recover S1 Mooring |
2/9/02 |
2339 |
62° 16.470’ S |
62° 10.000’ W |
1651 |
|
Recover S7 Mooring |
2/12/02 |
0752 |
65° 22.620’ S |
66° 28.210’ W |
450 |
|
Deploy Drifter 25180 |
2/12/02 |
1503 |
66°
04.01’ S |
68°
07.92’ W |
388 |
|
Deploy Float 138 |
2/12/02 |
1505 |
66°
04.01’ S |
68°
07.92’ W |
388 |
|
S8 Mooring |
2/12/02 |
|
66° 38.241'S |
69° 33.095'W |
407 |
|
Deploy Drifter 24477 |
2/13/02 |
0221 |
66° 40.150’ S |
69° 30.010’ W |
|
|
Deploy Float 139 |
2/13/02 |
0222 |
66° 40.190’ S |
69° 29.940’ W |
|
|
CTD 1 (A1) |
2/13/02 |
0742 |
67° 01.249’ S |
69° 00.959’ W |
455 |
|
Recover A1 Mooring |
2/13/02 |
0830* |
67° 01.134’ S |
69° 01.217’ W |
450 |
|
CTD 2 (A2) |
2/13/02 |
1321 |
66° 51.583’ S |
79° 00.250’ W |
562 |
|
Recover A2 Mooring |
2/13/02 |
1352 |
66° 51.883’ S |
70° 00.683’ W |
564 |
|
CTD 3 (A3) |
2/13/02 |
1859 |
66° 44.428’ S |
71° 00.720’ W |
490 |
|
Recover A3 Mooring |
2/13/02 |
1947 |
66° 45.002’ S |
70° 59.991’ W |
490 |
|
Deploy Float 137 |
2/14/02 |
0249 |
67° 26.726’ S |
70° 22.950’ W |
|
|
CTD 4 (B1) |
2/14/02 |
0737 |
67° 56.603’ S |
69° 54.586’ W |
522 |
|
CTD 5 (B3) |
2/14/02 |
1355 |
68° 15.145’ S |
70° 59.332’ W |
462 |
|
Recover B3 |
2/14/02 |
1503 |
68° 15.345’ S |
70° 59.853’ W |
450 |
|
CTD 6 (B2) |
2/14/02 |
1911 |
68° 05.573’ S |
70° 31.157’ W |
822 |
|
Recover B2 |
2/14/02 |
1944 |
68° 06.091’ S |
70° 31.675’ W |
811 |
|
Recover S6 |
2/15/02 |
1535 |
67° 17.900’ S |
74° 10.800’ W |
3057 |
|
Deploy S6A |
2/15/02 |
1648 |
67° 18.250’ S |
74° 10.150’ W |
3099 |
|
Recover S5 |
2/15/02 |
2348 |
66° 35.197’ S |
72° 42.311’ W |
3450 |
|
Deploy S5A |
2/16/02 |
0039 |
66° 34.990’ S |
72° 41.430’ W |
3421 |
|
Recover S4 |
2/16/02 |
0834 |
65° 58.400’ S |
71° 04.100’ W |
2962 |
|
Deploy S4A |
2/16/02 |
0936 |
65° 58.730’ S |
71° 03.640’ W |
2944 |
|
Recover S3 |
2/16/02 |
1902 |
64° 59.406’ S |
69° 28.795’ W |
2521 |
|
Recover S2 |
2/17/02 |
0721 |
63° 50.799’ S |
67° 08.829’ W |
3056 |
|
Deploy S2A |
2/17/02 |
0842 |
63° 50.460’ S |
67° 07.840’ W |
3047 |
|
Deploy Float 110 |
2/18/02 |
1007 |
67° 30.000’ S |
71° 30.100’ W |
430 |
|
Deploy Float 112 |
2/18/02 |
1229 |
67° 42.990’ S |
70° 41.950’ W |
778 |
|
Deploy Float 142 |
2/18/02 |
1450 |
67° 56.850’ S |
69° 54.470’ W |
442 |
|
Deploy C1 |
2/18/02 |
2122 |
68° 02.940’ S |
69° 21.790’ W |
450++ |
|
CTD 7 (C1) |
2/18/02 |
2243 |
68° 02.599’ S |
69° 19.855’ W |
515 |
|
Deploy Float 111 |
2/18/02 |
2332 |
68° 03.190’ S |
69° 21.940’ W |
401 |
|
Deploy Drifter 25120 |
2/18/02 |
2333 |
68° 03.200’ S |
69° 22.000’ W |
401 |
|
Deploy Drifter 24476 |
2/19/02 |
0037 |
68° 11.600’ S |
69° 38.710’ W |
827 |
|
Deploy Float 124 |
2/19/02 |
0039 |
68° 11.710’ S |
69° 38.740’ W |
828 |
|
Deploy C2 |
2/19/02 |
1132 |
68° 13.331’ S |
70° 01.730’ W |
850 |
|
Deploy Drifter 25119 |
2/19/02 |
1144 |
68° 14.040’ S |
70° 01.060’ W |
868 |
|
CTD 8 (C2) |
2/19/02 |
1231 |
68° 14.606’ S |
69° 59.954’ W |
890 |
|
Deploy C3 |
2/21/02 |
2344 |
68° 06.006’ S |
70° 31.799’ W |
815 |
|
CTD 9 (C3) |
2/22/02 |
0037 |
68° 05.8493’ S |
70° 30.529’ W |
818 |
|
Deploy Drifter 25181 |
2/22/02 |
0115 |
68° 05.630’ S |
70° 30.400’ W |
867 |
|
Deploy S9 |
2/23/02 |
1848 |
67° 54.499’ S |
68° 23.003’ W |
687 |
|
Deploy S7A |
2/25/02 |
2338 |
65° 22.620’ S |
66° 28.150’ W |
470 |
|
Deploy S1A |
2/28/02 |
0748 |
62° 16.420’ S |
62° 10.040’ W |
1658 |
Table 1. LMG02-1A mooring, float, drifter, and CTD station locations. Notes: 1) Time for mooring recovery is when release command was sent, and mooring started up to the surface (* means time is +/- 5 min, otherwise, time is accurate to the minute). 2) Time and position for CTD is time and position when the fish reaches the bottom of the cast. Depth is reading at start of cast. 3) Float times and positions as recorded on the bridge as instrument launched. 4) Time and mooring position for mooring deployment is when the anchor is released as recorded on the bridge. 5) Topography at C1 is very rugged, so actual depth where C1 anchor landed could be between about 450 m and 395 m (worst case). Depth at drop site was 450 m, however, fallback may cause the actual depth to be less.
3. Mooring, Drifter and Float Measurements
3.1
Bathymetric Surveys
Digital depth data were collected with a Knudsen fathometer using a
sound speed of 1500 m/sec from Punta Arenas to Palmer Station. At Palmer
Station, the sound speed was changed to 1456 m/s about 1800 Z February 11. This value was the depth-averaged sound
speed computed using CTD profile data collected at LTER stations 200.000,
200.020, and 200.040 located west of the southern tip of Adelaide Island in
water greater than 500 m deep during the January 2002 LTER cruise. This value was checked against
depth-averaged sound speed values computed using CTD data collected on this
cruise, and found to be within a few m/s.
The sound speed was changed back to 1500 m/s at Palmer Station on
February 26 for the trip north to Punta Arenas.
Small-scale depth surveys were made prior to the deployment of the three
new WHOI moorings. The original
objective of the C-line moorings was to monitor the in-flow and out-flow across
the month of Marguerite Bay. The C1 and
C2 moorings were located along the northern part of a line between the tips of
Adelaide and Alexander Islands to investigate inflow, while C3 was located on
the western edge of the George VII channel to investigate outflow. Sites C2 and C3 were located too far south
in the ice to be reached, and an initial pass over the C1 target showed it to
be too bumpy and deep to deploy a mooring.
Using the high-resolution SO GLOBEC digital data base to pick new sites,
we chose to deploy C1 and C2 close to the line between the two islands and C3
at the B2 site, roughly 90o to C1-C2, thus forming a L. All three mooring sites were located within
the multi-beam data area, which made it easier to pick smoother sites. Since the SO GLOBEC depth data were not
corrected for local sound speed, we made full depth surveys at C1 and C2, and merged
the new C3 data collected during the C3 deployment with data collected last
year during the B2 deployment. Plots of
the depth surveys are shown in Appendix A.
3.2 Mooring
Operations
One primary objective of LMG02-1A was to recovery the 6 WHOI current meter moorings and the 8 SIO Acoustic Recording Package moorings (ARPs) deployed last year on LMG01-3, refurbish the 8 ARPs and redeploy them, and deploy 3 new WHOI moorings. To accomplish this, the cruise track was designed with the following sequence of mooring operations: 1) recover S1 on south transit to Palmer Station; 2) steam south from Palmer Station to recover S7 and S8; 3) recover WHOI A1, A2, A3, 4); 4) recover WHOI B1, B2, B3; 5) steam north along the outer line of SIO ARPs, recover S6, S5, S4, S3, and S2 and deploy refurbished ARPs from earlier recoveries at these sites; 6) deploy WHOI C1, C2, C3; 7) deploy refurbished ARPs at S8 and S7 on way to Palmer Station, and S1 on northbound transit to Punta Arenas. This plan was chosen to minimize steaming time between mooring operations plus provide adequate time between ARP recoveries to turn these instruments around for redeployment and sufficient time between the WHOI recoveries and deployment of the new moorings for two "workhorse" ADCPs and two SeaGauges (bottom pressure, temperature, conductivity recorders) to be downloaded, checked, and made ready for redeployment in the new moorings.
Overall, we followed this sequence during the cruise with a few modifications. The ARP at S8 responded to acoustic interrogation but did not lift off the bottom despite repeated lease commands being sent and acknowledged. It was left and not replaced. There was no response at B1 to any commands sent by the deck unit. The ARP at S3 was recovered but not replaced, so there would be one unit to deploy at a new site (S9) located in Rothera channel. The C3 mooring was deployed at the old B2 site since the intended C3 site was deep into the ice pack south of the ice edge. Figure 2 shows the location of the ice edge in southern Marguerite Bay on February 13. The red dot in Figure 2 is roughly 3 nm south of B2 and 6 nm north of B3.
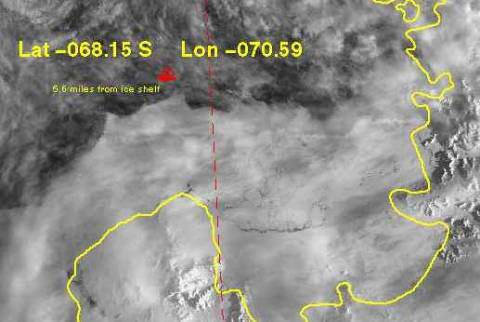
Figure 2. Satellite image of southern Marguerite Bay, showing the extent of pack ice on February 13. The B3 and original C3 mooring locations were south of the ice edge.
Fortunately, we had eight straight days of good working weather leaving Palmer Station, and with skilled personnel and excellent equipment, the mooring work went quickly and smoothly. During this period, all of the ARPs were recovered except S8 and 5 were redeployed, 5 of the 6 WHOI moorings were recovered (including B3 in the ice), and the new C1 and C2 moorings deployed. Mooring operations were then suspended due to rough weather, and the rest of the mooring work was done during a few brief windows of good working weather. A more detailed description of the mooring operations is given in the Chief Scientist's Cruise Narrative (section 6). The positions, time and water depth of all mooring recoveries and deployments are listed in Table 1.
The success of the mooring operations on LMG02-1A was due to the following factors. The combination of the new RPS mooring winch, knuckle crane, and stern A-frame with highly skilled personnel on deck made for efficient and safe mooring operations. The ship handling was excellent, with Captain Robert at the helm in the aft control room with a clear view of the aft deck during all mooring recoveries. The depth survey grids and mooring deployment approaches were done skillfully by the mate on watch at the bridge.
3.3 Moored
Data Return
The 6 WHOI current moorings were deployed during LMG01-3 along two transects, the A-line located west off central Adelaide Island, and the B-line located towards the southwest of the southern tip of Adelaide Island. The 3 moorings along the A-line were called A1, A2, and A3, with A1 being closest to Adelaide Island. The 3 moorings in the B-line were called B1, B2, and B3, with B3 located closest to Alexander Island. The positions and depths of these 6 moorings are given in Table 1.
The A-line moorings were recovered with no apparent damage to any instrument or mooring equipment. The B1 mooring was never recovered. The B2 mooring was recovered with the flotation collar on the upper-most instrument (ice profiler) broken off. The data from SEACAT 1457 (file B2sc050m900s) indicates that the B2 ice profiler lost its buoyancy at July 14, 2001 19:29:36 GMT - Bastille Day. Instruments on B2 above 100 m are affected. The B3 mooring was recovered with the top flotation sphere flooded. The metal bracket for the ARGOS beacon was bent, which had apparently created a small leak which allowed water to fill the sphere. All instruments on the B3 mooring except the deep SeaGauge sank to a different deeper depth on June 19, 2001 at 16:00 GMT.
A preliminary summary of the data return from the different instruments is given in Table 2. A draft copy of a moored data report is included in Appendix C.
Table 1. Moored Data Summary showing good data (blue), unprocessed data (gray), and lost data (red).
3.4
Hydrographic Data
Hydrographic data were collected during LMG02-1A using several difference approaches. Both eXpendable BathyThermograph (XBT) probes and eXpendable Conductivity/Temperature/Depth (XCDT) probes were used to collect profiles of temperature and conductivity during the southward ADCP transect conducted across the Drake Passage. XBTs were also used to obtain temperature profiles at each of the SIO bio-acoustic moorings, in order to estimate sound speed profiles needed to help process the moored data. Conductivity/Temperature/Depth (CTD) profiles were taken at each of the WHOI mooring sites, both prior to mooring recovery and after mooring deployments, so that the CTD data can be used to check the T/C calibrations of the moored instruments. In addition, water samples were collected at all CTD stations for filtration for later chlorophyll-a analysis at Palmer Station. Twelve Niskin bottles were fired at each station, with two at the surface, one at the standard depths 10, 25, 50, 75, 100, 150, 200, 300 m, and two at the bottom of the cast. Three water samples for salinity comparisons were drawn from each surface and bottom bottles at the last four CTD stations. A brief description of the CTD, its operation during the cruise, and the processed profiles will be given next. The XBT and XCDT data are available on the cruise data CD.
The ship’s CTD system consisted of a Sea-Bird Electronics Model 9Plus CTD sampling at 24 Hz with a DigiQuartz quartz crystal pressure transducer, a primary and secondary pairs of Sea-Bird temperature and conductivity sensors, a Chelsea fluorometer sensor, and a WET Labs light transmissometer. The CTD fish was lowered at between 20 - 40 m/min and the data was logged using a Sea-Bird 11Plus deck unit and DOS Seabird Electronics software. The CTD data was averaged into 1 m bins and the averaged downcast data is presented in this report. Andy Nunn collected and processed all the CTD data, Breck Owens did final processing and plotting, and Sara Disick collected the water samples, did the filtration, and determined the sample salinities using the ship’s Guildline AutoSal salinometer.
3.4.1 Calibration
Two
tests were conducted to determine how well the CTD temperature and conductivity
sensors worked on this cruise. The
first test consisted of comparing the primary and secondary temperature and
conductivity profiles at each station.
The results (Table 2) show that the two sensor pairs exhibited a
consistent offset, with a mean difference between the primary and secondary
temperature sensors of -0.00088 +/- 0.00024 oC and between the
primary and secondary conductivity sensors of 0.00250 +/- 0.00040 mS/cm. These are quite small differences, which
would cause a difference in salinity at say (30 mS/cm, 1 oC, 500 m)
of only 0.0010 psu due to the temperature offset and 0.0032 psu due to the
conductivity offset, or a combined difference of about 0.004 psu.
|
Station |
T1-T2 |
STD |
C1-C2 |
STD |
|
A1 |
-0.96 |
3.17 |
0.194 |
0.283 |
|
|
-0.89 |
0.13 |
0.189 |
0.009 |
|
A2 |
-0.73 |
1.26 |
0.250 |
0.136 |
|
|
-0.86 |
0.34 |
0.229 |
0.028 |
|
A3 |
-1.10 |
6.13 |
0.229 |
0.603 |
|
|
-0.92 |
0.30 |
0.228 |
0.027 |
|
B1 |
-1.19 |
5.46 |
0.248 |
0.510 |
|
|
-0.97 |
0.25 |
0.260 |
0.022 |
|
B2 |
-0.80 |
4.14 |
0.234 |
0.376 |
|
|
-0.88 |
0.58 |
0.218 |
0.055 |
|
B3 |
-1.17 |
3.53 |
0.203 |
0.377 |
|
|
-0.87 |
0.24 |
0.232 |
0.028 |
|
C1 |
-0.56 |
4.68 |
0.302 |
0.367 |
|
|
-0.86 |
0.11 |
0.266 |
0.011 |
|
C2 |
-0.62 |
3.18 |
0.295 |
0.274 |
|
|
-0.84 |
0.16 |
0.268 |
0.014 |
|
C3 |
-0.76 |
4.98 |
0.293 |
0.485 |
|
|
-0.82 |
0.14 |
0.278 |
0.013 |
|
Mean |
-0.88 |
0.24 |
0.250 |
0.040 |
Table 3. Comparison of CTD primary (1) and secondary (2) temperature and conductivity sensors for the nine CTD casts made on LMG02-1A. Shown for each cast is the mean and standard deviation for the difference temperature and conductivity, computed over the entire cast (upper value) and over the deeper part beneath 300 m (lower value). Units are milli-degree C and milli-S/m. The mean and standard deviation of the nine entire cast values are given at the bottom.
The second test was a comparison of the
bottle salinity SAS (as
determined using the AutoSal) with the CTD salinity SCTD computed using the primary temperature and
conductivity values and pressure recorded when the Niskin bottle was
fired. A total of 48 water samples were
taken and processed, three were discarded as clear outliers, and the remaining
45 bottle salinities used to compare with the CTD values. The salinity difference between bottle and
CTD (SAS - SCTD) is plotted in Figure 2
as a function of sample number, with blue squares denoting the surface samples
and the red circles the bottom samples.
There is a tendency for the difference to be of order – 0.010 psu for
the first two groups of bottom samples, however, this trend changes at later
stations as does the initial trend of the surface samples. The mean difference over the 45 samples
was SAS - SCTD
= -0.0067 +/- 0.0050 psu, with the CTD reading higher salinity than the
AutoSal. The first sensor test
indicated that the primary salinity would be roughly 0.004 psu higher than the
secondary salinity. The results of both
tests suggest that the CTD primary salinity reads roughly 0.005 psu high, and
that the secondary salinity is accurate to within +/- 0.002 psu. The processed CTD data include both primary
and secondary values, so subsequent analysis should use the secondary
temperature and salinity data as the more accurate. However, the difference is relatively small, and the CTD profile
data presented in this report were taken with the primary sensor pair.
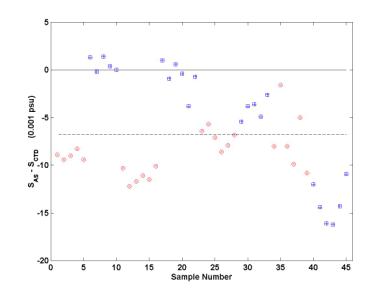
Figure 3. Difference between the in-situ water sample salinity SAS and the primary CTD salinity SCTD versus sample number. The blue squares represent surface samples, and the red circles bottom samples. The dashed line is the mean difference.
3.4.2 CTD Data
Plots of temperature, salinity, density, sound speed, dissolved oxygen, fluorescence, beam transmission, and T/S correlation are shown next for the 9 CTD casts made during LMG02-1A (Figures 4-9). The units used are oC, psu, kg/m3, m/s, ml/l, volts, %, and potential temperature oC versus psu. Note that the depth-averaged sound speeds are all close to the LTER-based 1456 m/s value to set the ship’s sounder for this cruise.
A relatively warm (>0.5 oC) surface layer overlying cold winter water (< -0.5 oC) was observed at the three A-line moorings. The warmest surface water occurred at A1 while the freshest surface water (about 33.45 psu) was found at A2. The surface waters had the lowest light transmission and highest fluorescence, which peaked near 2 volts at A3. Along the B-line, the upper water column structure was more complex. A clear core of cold winter water occurred at B1 and B2, but was less distinct at B3. The surface waters above this cold layer showed interleaving of warm and cool layers. The surface salinity was less than along the A-line, with the water getting fresher southwestward from B1 towards B3. The mooring B3 was recovered in patchy ice, and the surface water there was the coldest (-1.6 oC) and freshest (33.05 psu) water found at any of the nine CTD stations. Fluorescence was high along the B-line, exceeding 4 volts at B1 and B2, and 2 volts at B3. The upper water column structure was also complex at the three C moorings.
The surface salinity decreased from C1 to C2 to C3, while surface fluorescence increased from C1 (1.5 volts) to C2 and C3 (3.5 volts). Thus the highest fluorescence waters were found at B1, B2 (C3), with intermediate values at A3, B3, and C1.
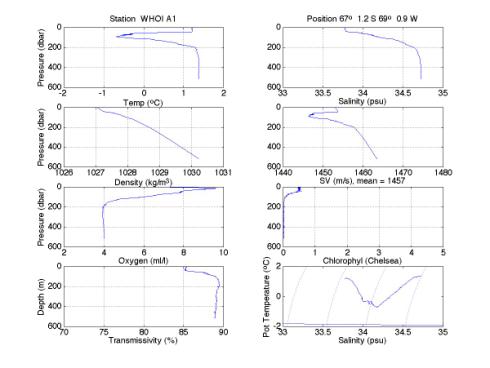
Figure 4. CTD profile data at WHOI mooring site A1
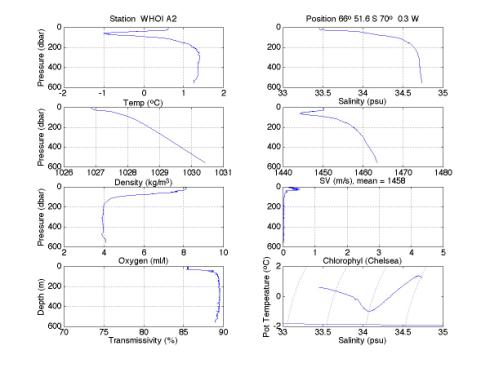
Figure 5. CTD profile data at WHOI mooring site A2.
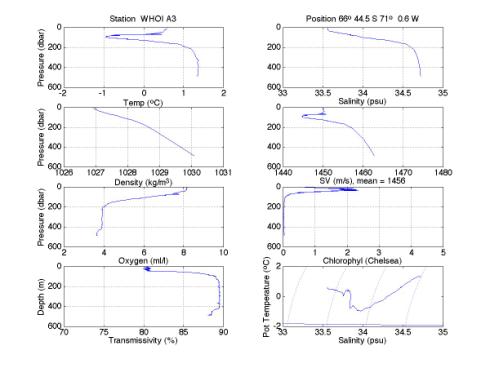
Figure 6. CTD profile data at WHOI mooring site A3.
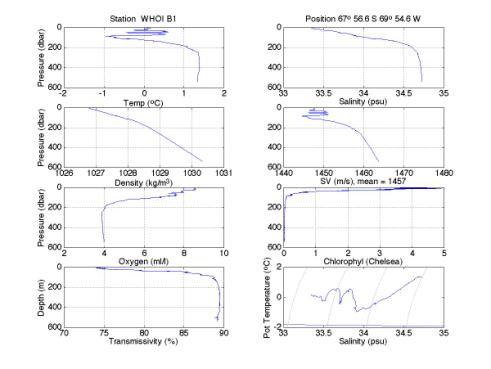
Figure 7. CTD profile data at WHOI mooring site B1.
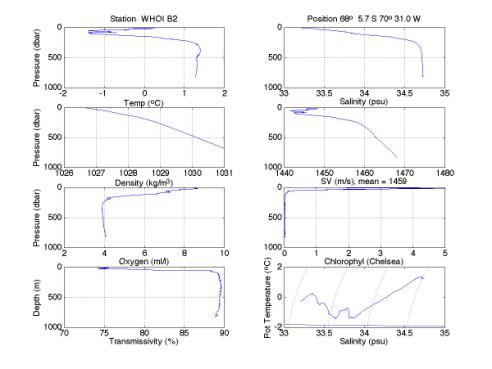
Figure 8. CTD profile data at WHOI mooring site B2.
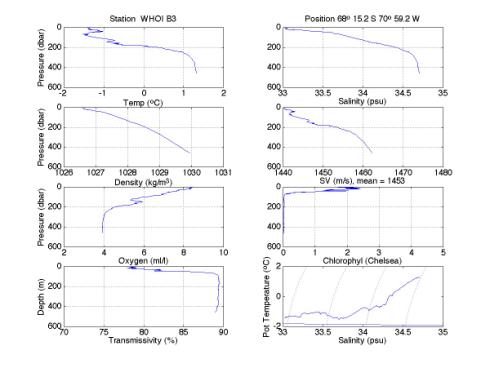
Figure 9. CTD profile data at WHOI mooring site B3.
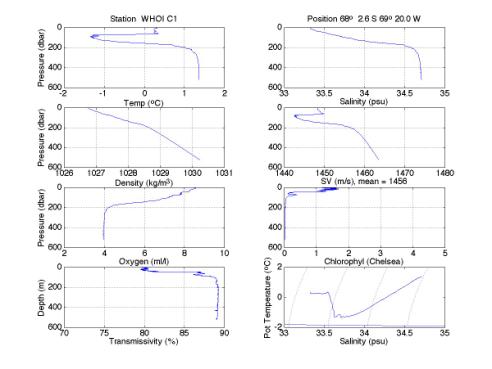
Figure 10. CTD profile data at WHOI mooring site C1.
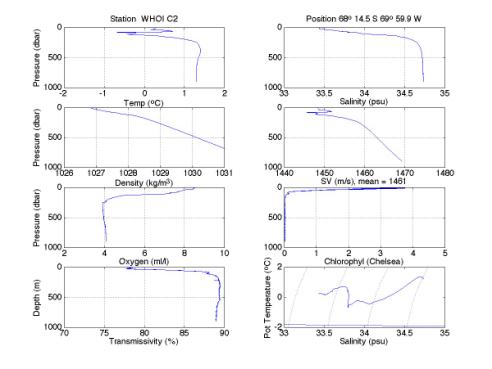
Figure 11. CTD profile data at WHOI mooring site C2.
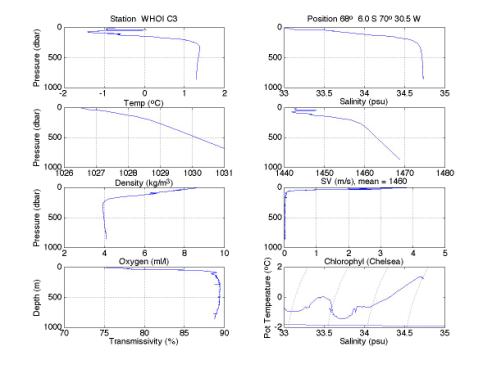
Figure 12. CTD profile data at WHOI mooring site C3.
3.5 Drifter
Measurements
A total of 6 WOCE-style, near-surface drifters (Sybrandy and Niiler, 1991; Brink et al., 2002) were deployed in the waters near Marguerite Bay (see Table 1 for their launch positions and time). Each drifter was equipped with a holey sock drogue centered at 15 m, and reported its position via Service ARGOS roughly 20 times per day. Tracks for the first few days after deployment are shown below.
Figure 13. Initial tracks through March 1 for the six surface drifters deployed during LMG02-1A.
3.6 Float
Deployments
The original plan for this cruise was to launch 12 profiling floats in the inflow, outflow, and central area of Marguerite Bay. These floats are a new version of the design used in previous experiments, such as WOCE and the Argo float program. The basic concept is for the float to descend to a depth, here 250 m, drift with the ocean current, then descend quickly to a deeper depth, here the bottom or 600 m, and make a profile of temperature and salinity to the surface of the ocean. At the surface the floats are tracked by satellite and send their data back to shore and then descend for another cycle. In the past, these floats have used the ARGOS satellite system for positioning and transferring the data back to shore. The floats deployed on this cruise use GPS for positioning and the ORBCOMM satellite system, which has two-way communications, for data transfer. This configuration allows for at least an order of magnitude increase in bandwidth and two orders of magnitude decrease in the time on the surface. It is presently being used successfully in the subtropical North Atlantic.
The profiling floats were programmed for a 5-day repeat cycle. Prior to the cruise, the number of polar orbiting ORBCOMM satellites had been reduced to only two, greatly limiting the time window for communications. The software in the float limited the time on the surface to only two and half hours, which meant that if the time estimates for taking the profiles to the surface were off, the floats would miss the satellites or only have partial data transfer. The first three floats were launched on 12-14 February. When the floats surfaced for the first time, there was limited communications from only two of the three floats. At this time, the LMG had arrived on location for the deployment of the next set of floats. These next 5 floats were deployed. Upon further discussion with J. Valdes who was monitoring the reception of data at Woods Hole, it was determined that the float data was not getting through the ORBCOMM system effectively. The remaining four floats were not deployed and will be reprogrammed and deployed on the 2003 LMG SO GLOBEC mooring cruise.
4.
Meteorological Measurements
4.1 Introduction
A good knowledge of the surface meteorological conditions during
the Southern Ocean GLOBEC (SO GLOBEC) program is essential to understand the
role of surface wind stress and heat flux forcing on the regional circulation
and upper ocean properties. The surface
meteorological data are also useful in interpreting other physical and
biological data collected during the program.
The primary sources of surface meteorological data during SO GLOBEC
include the data collected aboard the L.M.
Gould and N.B. Palmer during their cruises in the study area and two
Automated Weather Stations (AWSs) that were deployed on small islands in the
mouth of Marguerite Bay in May, 2001 during NBP01-3. This section provides a
preliminary description of the meteorological data collected on LMG02-1A.
The L.M. Gould left
Punta Arenas on February 6 and arrived at Palmer Station on February 11 (Leg
1). She left Palmer Station on the next
day and returned to Palmer Station from the SO GLOBEC area to the south on
February 26 (Leg 2). The L.M. Gould left Palmer Station the next
day for Punta Arenas and arrived there on March 3 (Leg 3).
A full suite of
meteorological and underway data was collected during the cruise with two
exceptions. Sea surface temperature (SST), sea surface salinity (SSS), and
fluorometer data were not collected while the ship was docked at Palmer
Station. The ship’s meteorological data
acquisition system (DAS) was turned off for 41 minutes on February 18 between
1339 and 1419 GMT. This was done in a successful
attempt to reduce some high frequency noise present in some of the variables
(e.g., shortwave radiation, air temperature).
The ship uses GMT year day (yd) as given by GPS for time. Leg 2 corresponds to yd = 42.8007 to
57.4000. Our description here will
focus on the surface forcing during Leg 2, when the LMG was working in the
study area.
4.2 Instrumentation
The
meteorological sensors are mounted on the ship’s main mast (Figure 10). The sensors include a pair of wind monitors
and other sensors to measure air temperature (AT), relative humidity (RH),
barometric pressure (BP), incident shortwave (SW) and long-wave (LW) radiation,
and PAR. Sea surface temperature (SST)
was measured using a remote sensor in the intake manifold, and sea surface
salinity (SSS), fluorescence (Fluor), and light transmission (Trans) were
measured using a thermosalinograph, fluorometer, and transmissometer placed in
the wet lab. The different sensors and
their calibration history and installation dates are given in Table 2.
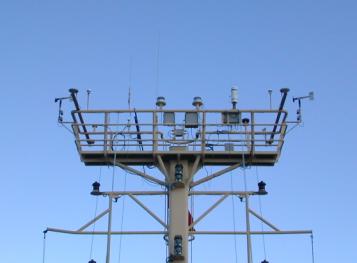
Figure 14. Meteorological sensors mounted on platform railing on top of
mast.
|
Variable |
Sensor |
Serial Num. |
Last Cal. |
Next Cal. |
Installed |
Cal. Inv. |
|
Star. Wind |
RM Young 5106 |
WM 28394 |
4/15/01 |
4/15/02 |
6/7/01 |
A |
|
Port Wind |
RM Young 5106 |
WM 35061 |
4/15/01 |
4/15/02 |
4/15/01 |
A |
|
AT, RH |
RM Young 41372LC |
6133 |
10/31/01 |
10/31/02 |
12/1/01 |
A |
|
BP |
RM Young 61201 |
BP 01150 |
11/7/00 |
11/7/02 |
After LMG01-4 |
BA |
|
PAR |
Biosp. Inst. QSR-240P |
6394 |
6/5/01 |
6/5/03 |
7/19/01 |
BA |
|
SW |
Eppley PSP |
31701F3 |
6/1/01 |
6/1/02 |
7/19/01 |
A |
|
LW |
Eppley PIR |
32031F3 |
6/1/01 |
6/1/02 |
7/19/01 |
A |
|
SST |
Sea-Bird 3-01/S |
031619 |
6/2/01 |
6/2/02 |
7/20/01 |
A |
|
SSS |
Sea-Bird 21 |
219209-1577 |
11/10/01 |
11/10/02 |
Prior to LMG01-8C |
A |
|
Trans |
WET Labs C-Star 25cm |
CST-168R |
12/20/01 |
|
Prior to 2002 LTER |
|
|
Fluor |
Turner 10AU-005-CE |
6046 RTD |
|
|
|
|
Table
4. LMG02-1A meteorological and underway
sensors, their calibration history, and time of installation. The last column indicates if the sensor is
to be re-calibrated every year (A) or every two years (BA).
4.3 Data Acquisition and Processing
The raw L.M. Gould
shipboard meteorological and underway data were collected using the ship’s
DAS. A 1-min processed subset of the
raw data was saved at the end of each day in a flat ASCII text file on the
ship’s data drive Q:\.geopdata\JGOF\.
This 1-min time series was produced using a JGOFS code that merged the
met data with navigation and other data and combined the ship’s motion and the
measured (relative to the ship) wind speed and direction data to make ”true” wind
speed and direction relative to the ground.
The light transmission data is not included in the JGOFS subset.
The daily 1-min data were obtained from drive Q, converted into
standard variables using the MATLAB m-file read_lmg_met1m(yd), and after simple
editing, stored as MATLAB mat files (e.g., the file for yd 50 is
jg050a.mat). These files were then
merged into a composite file lmg_met1m.mat for the entire cruise using
merge_lmg_met1m. A subset of the 1-min
cruise data (called cruise_met.mat) was created to cover Leg 2, when the L.M. Gould was working in the study area
south of Palmer Station. This
cruise_met data were then used to estimate the surface wind stress and heat
flux using create_lmg_wshf1m and stored back in cruise_met. For further analysis, 1-hour averaged wind
stress and heat flux time series were constructed and saved as part of
cruise_met. Copies of these MATLAB
files, the m-files used to construct them, the edited daily JGOFS mat-files,
summary figures, and document are included in the cruise data CD.
Overall, the data quality of the
meteorological and underway data looks good with one important exception. The short-wave radiation time series
exhibits a negative bias during the night-time which is both large and variable
in time (Figure 15). Unlike the PAR
record which exhibits a clean day/night transition from nearly 0 to much larger
values, the day/night transition is difficult to determine due to the low
values on insolation and the large variable bias. It is not clear if this bias is in the sensor itself or in the
electronics between the sensor and the ship’s DAS. An initial attempt was made to remove this bias by subtracting
from the raw SW data a line which connects the lowest value before sunrise and
the lowest value after sunset, and setting the SW values between sunset and
sunrise to 0. This corrected series
(called swnf in cruise_met) was used to compute the short-wave heat flux
component.
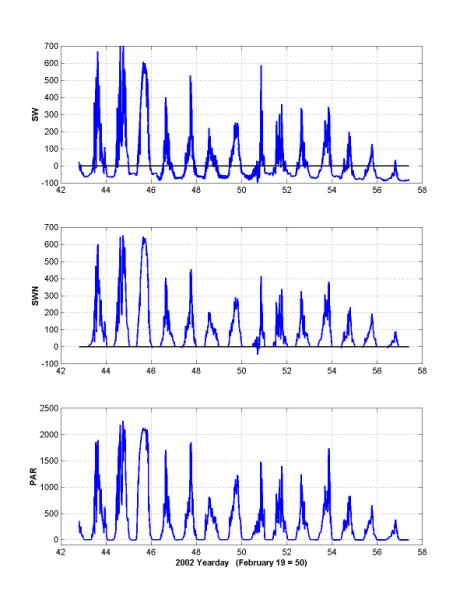
Figure
15. Raw shortwave radiation SW (top
panel), “corrected” shortwave radiation SWN with the nighttime bias removed
(middle panel), and raw PAR (bottom panel).
These data have been averaged over 10-min for plotting.
4.4 Description of
Cruise Weather
Time series of the 10-min averaged surface meteorological data
during Leg 2 are shown in Figure 16.
Winds were generally moderate (less than 25 kts) and oriented primary
towards and from the NE for most of the first 8 days of this leg. The air and sea surface temperatures reached
their lowest values on yd 45, when the L.M.
Gould was working in the edge of the ice recovering the B3 mooring. The winds during this day were from the SW,
and the air was both cold and relatively dry.
The first major storm arrived on yd 50, with a quick drop in the barometric
pressure, winds from the N and NE, reaching over 40 kts as the L.M. Gould stopped its mooring work and
steamed into Marguerite Bay near Rothera.
This storm continued to bring warm air and strong winds as the L.M. Gould conducted marine mammal survey
work inshore east of Adelaide Island.
As the winds weakened over the next several days, the L.M. Gould was able to resume mooring
work, and on the afternoon and evening of yd 53, conditions were prefect (very
weak winds, good sunlight) for the marine mammal work conducted along the ice
edge in southern Marguerite Bay. Our
hopes to continue to work the ice edge evaporated the next morning (yd 54) when
the second major storm hit Marguerite Bay. High winds persisted for most of the
rest of this leg, reaching over 40 kts from the NE on yd 56 during a rapid drop
in barometric pressure. We spent part
of this period working in Pendleton Pass, where the ship was partially
sheltered from the high winds over the shelf.
The winds did drop sufficiently for the SIO S7 mooring to be deployed
just before returning to Palmer Station.
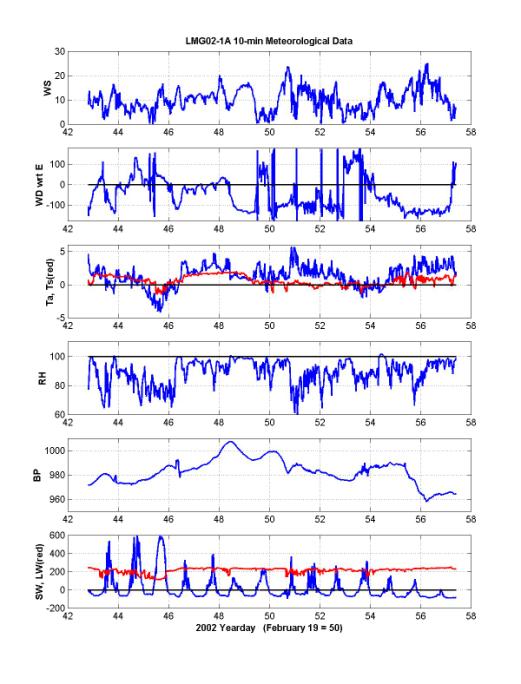
Figure
16. Surface meteorological measurements
during Leg 2 of LMG02-1A. The wind
direction plotted is the direction the wind vector is pointing with respect to
E (e.g., a wind blowing towards the south = -90o, an eastward wind =
0o). Units: wind speed, m/s;
temperature, oC; relative humidity, %; barometric pressure, mb;
short- and long wave radiation, W/m2.
4.5 Description of Surface Fluxes
The surface wind stress and heat flux
components are shown in Figure 17 for Leg 2.
The two major storms produced peak wind stresses of about 1.0 N/m2,
with much weaker stresses (less than 0.2 N/m2) for about 70% of this
leg. These two storms dominate the mean
stress, which has a magnitude of 0.10 N/m2 directed towards the SSW
(-97o CCW wrt E). Table 5
gives simple statistics for the east (Tx) and north (Ty) wind stress and the
heat flux components for Leg 2.
|
Variable |
Mean |
St. Dev. |
Min |
Max |
|
Tx |
-0.013 |
0.146 |
-0.661 |
0.534 |
|
Ty |
-0.097 |
0.166 |
-0.970 |
0.279 |
|
Qnet |
-27.7 |
101.5 |
-236.1 |
331.5 |
|
Qsw |
71.1 |
113.7 |
0 |
589.6 |
|
Qlw |
-102.0 |
27.7 |
-194.5 |
-69.3 |
|
Qsen |
8.1 |
15.8 |
-41.4 |
73.8 |
|
Qlat |
-4.9 |
12.8 |
-53.7 |
25.4 |
Table 5. Wind stress and
heat flux statistics for LMG02-1A Leg 2.
Units: wind stress, N/m2; heat flux, W/m2.
The mean net heat flux into the ocean during Leg 2 was -28 W/m2. The generally overcast and cloudy conditions
limited the incident shortwave flux to relatively low daily values, but also
caused a decrease in the long-wave heat loss.
The resulting net radiation flux was –31 W/m2, roughly
comparable with the mean net heat flux.
The weak mean sensible heat flux gain and latent heat flux loss tend to
counterbalance, so that the net air-sea flux was only Qsen + Qlat = 3 W/m2, which is not significantly
different from 0.
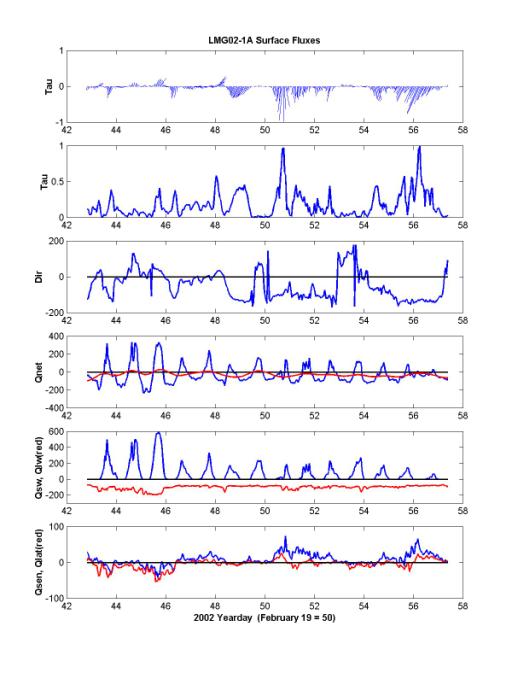
Figure 17. Surface wind
stress and heat flux during LMG 01-03.
Units of wind stress are N/m2 and heat flux W/m2.
5. Marine
Mammal Observations
5.1
Acoustic Census of Mysticete
Whales
The primary goal of this project is to determine the minimum population estimates, distribution and seasonality of mysticete whales within the West Antarctic Peninsula region. These data will be integrated with the rest of the SO GLOBEC data set to improve the understanding of krill ecology in the area. Because the vocalizations of most baleen whales are species specific and easily recognizable, passive acoustic techniques can be used to determine long-term, seasonal presence of a species in the area. The species of interest are blue (Balaenoptera musculus), fin (B. physalus), humpback (Megaptera novaeangliae) and minke (B. bonaerensis) whales. Southern right whale (Eubalaena australis) and sperm whale (Physeter macrocephalus – an odontocete) calls may also be detected but are expected less frequently.
The primary purpose of this cruise
was to recover and redeploy 8 bottom-mounted acoustic recording packages
(ARPs). The ARPs consist of a data
logging system with 2 18-GB hard disks, an acoustic release, and a hydrophone
component floating 10 m above the mooring.
The sampling has been conducted continuously at 500 samples/s over the
11 months of the deployment. Also during
this cruise, sonobuoys were deployed opportunistically to supplement the information
obtained from the visual observations, as well as the ARP data. Sonobuoys are expendable underwater
listening devices. Four main components
of a sonobuoy are a float, radio transmitter, saltwater battery, and
hydrophone. The hydrophone detects underwater
sounds, which get transmitted to the underway ship using radio waves. These sounds can be reviewed for whale calls
in real-time and simultaneously recorded onto a digital audio tape (DAT). We deployed 3 types of sonobuoys: 41B and
57B omni-directional sonobuoys that cannot determine the location of the sound
source, and 53B DiFAR (Directional Fixing And Ranging) sonobuoys that can be
used to determine the exact bearing of the sound from the sonobuoy.
Seven of the eight ARPs were successfully recovered. Most instruments came back in fairly good condition. There was evidence of crevice corrosion on the shallow water instrument (S7) and corrosion due to a connector leak in one of the deeper instruments (S3). The other shallow water instrument (S8) never surfaced even though we were able to talk to it acoustically and send the release command. Four instruments (S1, S2, S3, and S4) appear to have complete, high quality data sets. The other three instruments (S5, S6, and S7) had problems that resulted in partial data return. We have been unable to read one of the hard disks from the leaky instrument. The other disk is full with good data, so we are hoping to recover the first disk upon return to land and thus retrieve all data for that site.
All of the recovered instruments were serviced, parts in question were replaced and we were able to redeploy them. The deployments of all 7 instruments were successful. Six of the 7 instruments were deployed at the original sites, and one was deployed at a new site within Marguerite Bay (S9). Old site S3 was not repopulated, and no new instrument was deployed on S8. (See Figure 1 for ARP locations.)
Preliminary analysis of the ARP data shows high numbers of calls on all instruments. Blue whale calls (Figure 18) seem to be present in numbers greater than expected, and there is evidence of the presence of calling blue whales year round. Also, initial blue whale call analysis indicates the possibility of higher source levels than have been reported for the species previously. Blue whale calls seemed stronger on the shelf break than on the shallow water instruments. Fin whales (Figure 19) seem to be present seasonally, with stronger fin whale calls heard on the instruments from the shelf break. A few minke whale calls were seen in the preliminary analysis. Seal calls were heard on S7, they are mostly likely crabeater seals (Figure 20). Two types of unidentified calls (Figure 21) were seen frequently on all instruments, showing higher call presence during the ice-covered periods. The source of these sounds is not known at this time, but the two possibilities are a fish species or minke whales. No southern right or humpback whale calls were seen in the preliminary analysis.
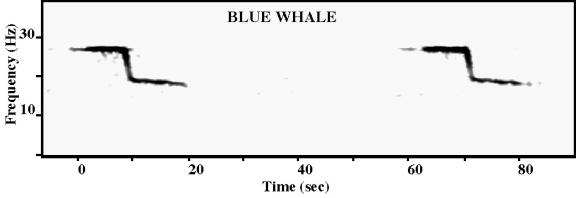
Figure 18. Antarctic blue whale calls recorded on the ARPs. The call is a 28 Hz tone of 10 s duration, followed by a 1 s down-sweep (28-19 Hz) and a 10 s slightly down-swept tone (19-18 Hz).
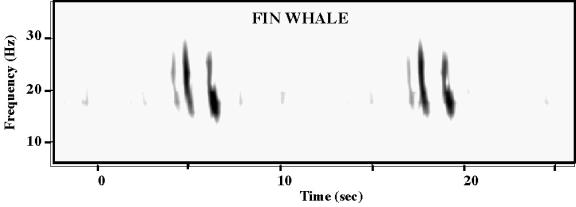
Figure 19. Antarctic fin whale calls recorded on the ARPs. The call produced by the whale is a single down-swept pulse (30-15 Hz). Multipath propagation produced 2 additional pulses.
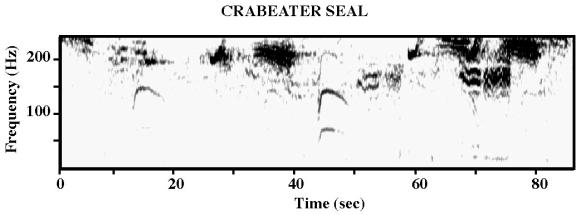 Figure
20. Seal calls recorded on ARPs, most
likely crabeater seals. Complex tones
and pulses are produced. Some of the
original energy might have been above 250 Hz (the Nyquist frequency for ARPs).
Figure
20. Seal calls recorded on ARPs, most
likely crabeater seals. Complex tones
and pulses are produced. Some of the
original energy might have been above 250 Hz (the Nyquist frequency for ARPs).
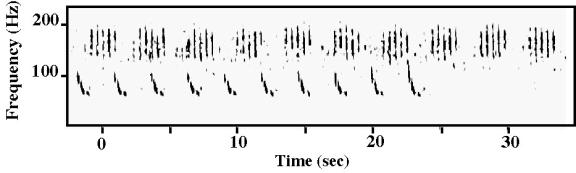
Figure 21. Unidentified calls recorded on the ARPs. Sets of 5 down-swept pulses are produced by one animal, and a set of single down-sweeps (110-60 Hz) by a different animal.
Sonobuoys were deployed both when marine mammals were visually detected and also randomly throughout the cruise. A total of 39 sonobuoys was deployed – 34 omnidirectionals (19 of type 41B and 15 of type 57B) and 5 DiFARs (53B). The locations of all the deployments are shown in Figure 22 and given in the cruise event log (Appendix 2). Species heard on the sonobuoys were blue whales, minke whales, and possibly a fin whale (Figure 22) Sperm whales clicks, as well as unidentified beaked whale species (possibly Hector’s beaked whale) whistles were heard on sonobuoys deployed in the Drake Passage.
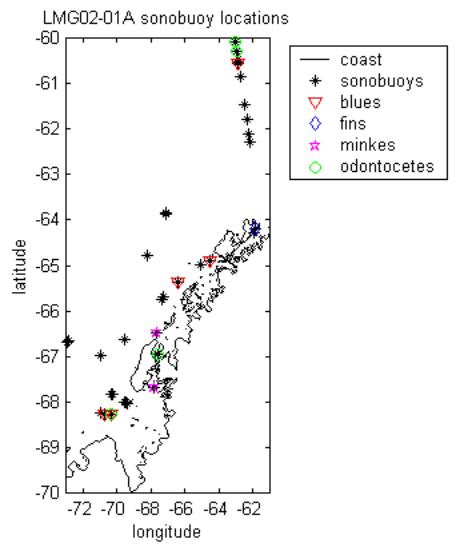
Figure 22. Sonobuoy deployment locations with species heard on the sonobuoy marked. Calling whales can be heard at large distances from the sonobuoy so a detected call does not necessarily indicate vicinity of whales.
5.2
International Whaling Commission Cetacean Sighting and
Biopsy Summary
Visual survey was conducted throughout the cruise in suitable weather conditions and commenced off the east coast of Chile on the southward journey to the Western Antarctic Peninsula study area. Few sightings were made until reaching the Boyd Strait and Gerlache Strait area on 10 February. Humpback whales were numerous in this area (28 sightings/59 animals). Throughout the first mooring deployment phase of the cruise (11 – 18 February), small numbers of humpback, sei, minke, killer and unidentified whale sightings were made. After weather conditions deteriorated at B2 mooring site on 19 February, the ship headed for Porquois Pas to conduct cetacean survey in calmer waters until weather cleared in Marguerite Bay. Weather conditions were not good, and only small numbers of humpback and minkes were sighted. Mooring deployments commenced in Marguerite Bay the evening of 21 February.
Cetacean survey continued on the afternoon of 22 February on a track to the ice edge. Humpback whales were concentrated near the ice edge (10 sightings/30 animals) at the southern end of Marguerite Bay. Two biopsy trips were made using the zodiac, resulting in five biopsies (skin and blubber) from two groups. Plans to continue survey along this ice edge to the east were cancelled due to worsening weather the next morning.
The ship again headed for the protected east coast of Adelaide Island and Matha Strait. Matha Strait was reached on the morning of 24 February. The ice edge here extended out into the mouth of the Straits, precluding survey. A large number of seals were evident here throughout the sea ice. The ship headed further north to Pendleton Straits and cetacean survey was conducted throughout this area. Humpback whales were concentrated in the Pendleton Strait/Mudge Passage area. Single minke whales were also sighted throughout the passage.
Palmer Station was reached on 26 February. Two pairs of humpbacks were sighted off Cormorant Island by Palmer Station personnel and a zodiac trip to obtain biopsies resulted in two samples from one pair and individual photo-identification records for all four animals. Humpback whales were also numerous during the transit through Dallman Bay on 27 February (20 sightings/42 animals). Calm conditions across the Drake Passage on 28 February provided good sightings of three groups of Mesoplodon, hourglass dolphins and a sperm whale.
The total time on effort up to 28 February was 148 hours 40 minutes.
|
Cumulative species |
Cumulative sightings/animals |
|
Unidentified large whale |
7/10 |
|
Hourglass dolphin |
2/14 |
Humpback |
75/168 |
|
Undetermined minke |
13/18 |
|
Unidentified whale |
11/62 |
|
Killer whale |
1/25 |
|
Sei |
1/8 |
|
Unidentified small whale |
1/2 |
|
Unidentified cetacean |
2/3 |
|
Like minke |
2/2 |
|
Mesoplodont |
3/13 |
|
Sperm whale |
1/1 |
|
Cumulative TOTAL |
117/322 |
Table 6. Summary of cetacean sightings during LMG02-1A (to end 28 February)
Figure 23. Map of cetacean sightings in study area.
6. Chief Scientist’s Cruise Narrative
Wednesday (2/6) (yd=37)
The
start of LMG02-1A was delayed one day while we waited for a shipment of lithium
batteries for the SIO moorings to arrive. The original air shipment of three
containers got split en route, with one container making it to Santiago and the
other two eventually arriving in Mexico. Once they were found, these two
containers were sent to Miami and then Santiago, where AGUNSA hired a plane to
fly all three containers to Punta Arenas, where they were delivered to the ship
at 1500, just two hours before we were to steam. These batteries are considered
"hazardous material", and can not be air shipped on an airplane with
passengers, thus the need to hire an empty commercial jet for the Santiago to
PA leg.
Ship
left PA with pilot aboard at 1700 (Local Time = GMT-3). Strong winds from the
west at ~25 kts, with scattered clouds. Andy fixed the connection on the
long-wave (PIR) sensor, so that it seems to be working fine. After dinner, the Chief Mate gave us a
safety briefing, and we all donned our survival suits, and entered the rescue
boat. Then we held a brief science meeting with all the science crew and
Raytheon staff.
Thursday (2/7) (yd=38)
Sky
was most clear all day, with some scattered clouds. Held meeting with Captain
and all mooring folks, to explain what operations would be done, and how the
different groups would work together. I
analyzed the CTD data taken at 3 deep stations just west of the southern tip of
Adelaide Island on the LTER cruise LMG02-1 to compute a mean sound speed for
our bathymetry work. The mean value was 1456 m/s. The original (default) value 1500 m/s will be changed to this new
value at Palmer Station. Andy held a
short class on using the new automatic XBT launcher at 1900, and the
XBT/XCDT/ADCP section across Drake Passage was started about 21:48.
Friday (2/8) (yd=39)
Continued
the XBT/XCDT/ADCP section across the Drake. The auto XBT launcher is working
well. Winds strong all day, about 25-30
kts from the N and NW. Overcast
occurred all day, causing very low shortwave readings from the PSP. Because
these values were so low, I processed the JGOFS met data collected on LMG02-1,
and found that during the last five days when the LMG was steaming back to PA,
the PSP values ranged from ~ 800 W/m2 on clear days to lows around
200 W/m2 on cloudy days. The
long-wave sensor PIR values also ranged from ~ 180 to 320 W/m2, with
a mean value of ~ 260 W/m2, over the last 4 days of LMG02-1. The
initial PIR values on our cruise seem a little low in comparison, but ok. Andy
checked that the PIR and PSP calibration coefficients were correctly entered in
the ship's DAS software.
Saturday (2/9) (yd=40)
Clear
sky in morning, with bright sun, distinct shadows on deck, lower winds, 10-20
kts from W and NW, with air temperatures now down to roughly 5 oC. The XBT/XCDT/ADCP section was continued,
with surface ARGOS drifters deployed at some specified XBT sites. Deb spotted several whales, and Mark deployed
several sonobuoys, catching blue whale calls that identified the whales as
belonging to the Antarctic group. We
started the SO GLOBEC cruise event log with Deb's whale watch (decided not to
include the XBT/XCDT deployments in the event log since that data will be sent
to Teri Chereskin (SIO) as part of her research effort). During the day, the
sky remained most clear, with PSP readings reaching up to roughly 600 W/m2,
which seems more normal. Will want to check on the PIR and PSP values collected
today by processing today's JGOFS met data tomorrow morning.
Afternoon
marked more clouds, some overcast developing. ETA to the first SIO mooring S1
is about 1800, just after dinner. Approached S1 about 1840, then waited while
the hydraulic hose on knuckle crane was repaired. A XCDT cast was made at 1855, providing a clean cast to about 550
m. S1 release command first sent 1913,
then resent. S1 surfaced about 2020 and was onboard by 2039. S1 was taken directly to Baltic room and
secured, and deck secured, we continued the XBT/XCDT section towards Palmer
Station.
Sunday (2/10) (yd=41)
Entered
Gerlache Strait in very early morning, some low clouds and overcast, but still
bright, winds down to 5-10 kts, from the SE. Deb and Rebecca starting their
marine mammal survey early, and had seen some whales before 0850, when first
sonobuoy was launched. The initial reading of S1 indicates blue, humpback, and
fin whale calls, plus a periodic loud noise in the last few days, suggesting
some ship had passed using an air gun.
Meet NBP during final approach to Palmer Station.
The
LMG docked at Palmer Station at 1645.
Safety meeting with Station Manager just after docking. Off loading of
gear for Palmer Station started, and once the vans were removed from the deck,
Scott and crew relocated the mooring winch and some other deck equipment. Most of the scientific party went ashore,
some took the trolley to visit the small peninsula just north of the station,
but only saw a few penguins and no seals, some went to the station store, and
then most went to the station bar for fun and pool. The crew of the NBP came ashore after dinner, including John
Anderson, the chief scientist on their geophysics cruise. We meet, and I showed
him some of the GLOBEC multibeam data that we have collected, and he agreed to
give us much of his NBP SeaBeam data except for several small regions where
they have done extensive mapping as part of two students’ thesis research. I
assured him that this was fine. John has already told Susanna York to send us
John's data once their cruise is over, and Susanna is back at Lamont. John also
mentioned several maps and references to the bathymetry in the GLOBEC area,
which we will get after the cruise. I was very glad to meet John, and obtain
his cooperation.
Maria
Vernet asked if we would be willing to collect water samples for chlorophyll
analysis. We agreed to collect 10 bottles at standard depths during the CTD
casts made at the WHOI moorings, provided this activity did not require much
extra time. Marie then set up a filtration system in the dry lab, and went over
the water collection and processing methods. The filters with samples will be
stored in the freezer for analysis back at Palmer Station.
The
winds picked up during the evening, with some rain.
Monday (2/11) (yd=42)
Awoke
at 0700 to find winds up to 30-40 kts, with gusts up to 50 kts and heavy rains
at times. These high winds make it too dangerous to use the main crane, so we
will have to wait until the winds are down below 30 kts before the LMG hatch
cover on the main hold can be opened and the van and other supplies that can
not be frozen can be lifted using the main crane and transferred to shore. Also, the ship needs the winds from the W
and NW to be below 30 kts in able to steam away from the dock without danger of
being pushed on the opposite rocky shore.
The
winds finally dropped below 30 kts around noon, and after lunch, we all went to
work on off loading the remaining van and other supplies for Palmer Station.
Then got our mooring gear spotted and secured on deck and the VACMs and floats
in the deck wet lab. Randy and Josh and others got the rest of the scientific
gear and supplies in the hold organized and secured. Around 1500, Andy changed the ADCP sampling configuration file to
the GLOBEC file. Andy also changed the sound speed in the ship's depth sounder
from 1500 m/s to 1456 m/s, which we will keep fixed until our return to Palmer
Station. With a bit of sun braking through the overcast, and NE winds of 15-25
kts, we left Palmer Station at 1600. The LMG will steam at roughly 6-8 kts to
reach the SIO mooring S7 at 0400 tomorrow. We have a very tight cruise
schedule, and hope to recover both S7 and S8 before heading to the WHOI A-line
to start mooring recovery there.
John
has asked that we obtain a sound speed profile at each of the SIO mooring
sites. There is one case of 24 XCDTs on board, but it is unclear if these can
be used (Andy is checking with RPS). There are several cases of XBTs on board,
so we decided to drop a XBT at the next two mooring sites (S7 and S8), which
should provide the temperature profile needed for constructing the sound speed
profile. Breck has also asked about
making a CTD cast just before or after his float deployments. The instruments initially remain at the
surface for about 30 min before starting their first decent. The CTD cast is to check the float
temperature and conductivity sensor calibration. To save time, we decided that Breck could launch floats at the
WHOI mooring sites with no time cost since we plan to make a CTD cast at each
mooring site. The other floats could be
launched without a CTD profile, since the water properties below 200 m are
horizontally uniform enough to allow a check of the float's bottom values.
Tuesday (2/12) (yd=43)
Arrived
at S7 at 0400, and decided to wait for more light before starting the S7
recovery. While waiting, deployed one sonobuoy and made XBT cast 77. By 0445,
sufficient light to start, and the release was fired at 0455, mooring spotted
at 0522, and on deck by 0545. During
final maneuvering to pick up instrument, the ship's DAS froze, so that the
Captain did not have wind information in the aft control room. Andy had to
reboot the DAS, which did not take long, so it was up as we left S7. Departed S7 for S8, with a deployment of one
WHOI surface drifter and one float roughly half-way between S7 and S8.
Drifter
25180 was deployed at 1203, and float 138 deployed at 1205. Conditions are excellent, winds 10-15 kts
from the NW, scattered clouds, some clear sun. The ship slowed to a few kts and
both instruments launched over the port quarter. Ship then picked up speed and
continued to S8. Andy has some 800-m XBTs that we can use along the outer SIO
mooring line. We will continue to use XBTs at the inner SIO sites.
Arrived
at S8 at 1700, having deployed a sonobuoy about 1645 and XBT cast 78 about 0.3
nm from the site. Burn command was sent 4 times with confirmation received,
however, mooring appears to be stuck in the bottom. A short snow squall with
increased winds passed the ship about 1745-1830, followed by moderate winds ~15
kts and clear visibility, great conditions for mooring recoveries. Decision
made to wait on station until 2300, hoping that the mooring will free itself
from the bottom and surface. The ship will steam a line over the mooring 1 nm
on each side, and monitor the acoustic range to the mooring. At 1100, decision
made to leave S8 and steam to A1. As
leaving site, drifter 24477 was deployed at 2321 and float 139 deployed at
2322.
Wednesday (2/13) (yd=44)
Arrived
at A1 at 0400. Andy and Breck made CTD cast 1 about 0.2 nm from A1, tripping 12
bottles, doubles at surface and bottom, singles at the other standard depths.
Standard procedure is for the CTD to be lowered to 10 m for approximately 10
min for the oxygen sensor to equilibrate with the water temperature. Andy and Sara drew water samples for salt
and filtration. The CTD was onboard by
0507, and the release command sent while the ship was still 0.2 nm downwind
(east) of the reported position. The
ship slowly headed towards the site, release command resent, and the mooring
surfaced about 50 ft behind the ship at about 0530. Recovery went smoothly, although there was a wire wozzle near the
ADCP. Little growth (just a slight film
on the flotation balls. The mooring was on deck by 0646, and the deck cleared
by 0745. We then headed for A1, with an ETA of 0945.
Arrived
A2 at 0945. Scott checked that release was there, then we did CTD cast 2 about
0.3 nm to north of A2 position. CTD
cast completed by 1042, then we steamed slowly towards A2 until about 500 m
from site, Scott sent the release command at 1052, and A2 popped to surface
within a few minutes. The recovery went very smoothly, and all equipment looked
in good shape except the top two microcats had one holder broken off. A2 was on
deck by 1206, and after a break for lunch, equipment was put away and the deck
cleared by 1400 as we headed for A3. The weather during the recovery varied
from very brief snow showers to sunny skies with only a few clouds to low
overcast. Winds were moderate, ~ 10
kts. The barometric pressure has been
very steady at ~ 975 mb for most of the day.
ETA at A3 is 1530.
Arrived
at A3 at 1515, with ship stopped about 0.3 nm to the N. Scott tried but did not
hear any return from the release. Even with ship declutched, no return. Checked
deployment position with independent data from last year, and found that the
position given in the cruise report is correct. Decided to do CTD cast 3, then
try to talk to release again. CTD cast
3 was completed by 1616, and ship repositioned about 0.3 nm from A3 location,
declutched, but no response. Moved ship to top of location, release did
respond, giving a range of 492 m, about exactly water depth, so we were very
close to top of mooring. Ship drifted
back from location, and Scott sent the release command at 1647, and top float
surfaced ~ 30 sec later. The rest of the recovery went smoothly, with all
instruments looking good, almost no growth on any sensors. A3 mooring was on
deck by 1800. After dinner, deck was cleared and ship started towards B1. ETA is 0400 tomorrow. Breck and Dick
deployed float 137 at 1049, about half-way between A3 and B1.
Thursday 2/14 (yd=45)
Arrive
at B1 at 0350. Scott was unable to talk with the acoustic release, from ranges
of 0.3 nm to ~0 nm, so we made CTD cast 4. After CTD was completed by 0455,
Scott sent fire command at 0513, with no response. At 0537, ship started a spiral visual search out to ~ 4 nm with
no luck. This search stopped at 0700, and the ship headed for B2 as Deb started
the MM survey. Arrived at B2 at 0833, and Scott got release there confirmation.
Since the ship was surrounded by significant ice, we decided to go to B3 and
work on it, while waiting for the wind to blow away the ice from B2. Ice patchy on way to B3.
Weather
this morning was excellent, bright sunrise, very few clouds, winds ~ 5kts, low
seas (few whitecaps).Can see mountains on Adelaide and Alexander Islands.
During yesterday and this morning, the barometric pressure has remained nearly
constant, until 0700 when the pressure is starting to rise.
Arrived
at B3 at 1027. Scott could talk to the release, so we did CTD cast 5 about 0.3
nm to NE of mooring location. CTD cast
completed by 1110, and we decided to get an early lunch before sending the
release command and starting the recovery. It is sunny, with very few clouds,
excellent visibility (can see mountains on Alexander Island), winds have
increased to 20-30 kts towards the SW, and ice patches with roughly half clear water. This will be a cool recovery, with air
temperature about -3 oC, SST about -1.3 oC, wind chill
about -20-25 oC.
At
1155, release command sent, from a range of about 900 m. No confirmation, so
ship moved closer and release command sent again at 1200. Release confirmation came at 1203, and the
red floatation sphere popped to surface by 1206. Only one glass ball was
visible, and it was underwater frequently.
After trying to hook into the glass balls, the captain backed into the
red sphere, and the rest of the mooring then recovered. The B3 mooring was on
deck at 1315. It looks like a berg hit the uppermost (yellow) floats, catching
on the sharp angles of the ARGOS/light bracket and causing a small leak at the
top of the sphere. As a result, all the instrumentation about the red flow was
hanging down from the red float.
Hopefully this happened late in the deployment. The bottom pressure
record looks fine at B3, with no indication of mooring movement over the deployment
period. We cleaned the deck while the ship headed back to B2. Noticed several seals on flows that passed
close to the ship, also one penguin.
Arrived
at B2 at 1530 and completed CTD cast 6 at 1634. Moved ship to about 0.3nm of
site, and sent the release fire command at about 1644 (the yellow sphere popped
up at 1646). Some ice patches were present, but did not present any problems.
The entire mooring was on deck by 1815. The ice profiler had lost its entire
flotation collar with 4 poly floats, i.e., the four plastic rods that attached
the collar to the stainless steel frame were broken off), so the profiler was
hanging down from 100-m yellow float.
The profiler has a depth recorder, so it should be easy to determine
when this happened.
Then
headed towards B1 and open waters and Scott conducted a box grid stopping every
2 nm to try to talk with the release.
This search was started about 2030 and ended about 0200. Then the ship headed for SIO mooring S6. ETA = 1200.
Friday 2/15 (yd=46)
Spent
morning steaming to S6. Weather: low
overcast, fog, air slightly warmer than water by about 1 oC, winds
15 -25 kts from the NW, but variable. Barometric pressure shows a very curious
short bump then depression starting about 0730 and lasting to about 0900,
perhaps a mini front associated with the fog and highly variable winds.
Arrived
at S6 at 1215. Sent first fire command at 1218, then sent second fire command
at 1235, and received confirmation, as S6 started to rise. During the ascent of
S6, got replacement unit ready to deploy.
Deployed replacement at 1348, roughly 0.4 nm from original site. S6 then
surfaced and was recovered and on deck by 1412. Andy then dropped an old
deep-water XBT while we waited from replacement S6 to land on the bottom. Final
commands sent 1500, and we headed for S5, ETA = 2030.
I
realized today that Sara had been taking water samples for Chl-a filtration but
not for salinity, a result of my miscommunication. Salinity samples were taken by Jordan on the southward Drake
Passage crossing to check the new TSG just installed on the ship. Once these
samples are analyzed by Sara, we can check the TSG calibration for this
cruise. New primary and secondary
temperature and conductivity sensors were put on the CTD just prior to this
cruise, and these sensors will be shipped back to SeaBird for calibration
immediately after this cruise. We will
take two surface and two bottom water samples on all remaining CTD casts to
check the conductivity calibrations. Hopefully, this limited check, plus the
pre- and post-cruise SeaBird calibrations should be sufficient to determine the
uncertainty in the CTD data.
Breck
compared primary and secondary temperature and conductivity data for the first
6 CTD casts, and found very small differences, especially below 300 m. The mean differences between the two
temperature and conductivity sensor sets averaged over measurements beneath 300
m are -0.90 +/- 0.04 milli-degree C and 0.226 +/- 0.023 milli-S/m. These
differences are small enough that the CTD primary sensor data will be used
without any adjustment.
Arrived
S5 at 2030. Sent first release command
at 2033, then second at 2048 and got confirmation of mooring rising from
bottom. During ascent of S5, got its
replacement ready and deployed S5A at 2139.
Andy then did a deep XBT. S5 surfaced about 2230, and recovered on deck
by 2236. Final commands to S5A sent 2300, and we started for S4. ETA =
0430. Weather overcast, winds 10-20 kts
from the NW, barometric pressure slowly rising. Little light, but used the
acoustic ranging to the S5 unit to steer ship to within 40 m of the ship when
it was spotted from the bridge.
Saturday 2/16 (yd=47)
Arrived
S4 at 0430, proceeded to wait until 0500 to start because of darkness. Sent three release commands (last at 0534)
until confirmation of mooring ascent. Then prepared replacement mooring S4A and
launched it at 0636. S4 recovered and
on deck by 0710. The hydrophone had an egg sack attached, Ana took photos and
saved the egg sack in a container. Final commands sent to S4A at ~0800, and
Andy did a deep XBT cast as we left the site, heading for S3. ETA = 1500.
Fire Drill at 1230.
Over
the last few days, Dick has downloaded the SeaGauges, and made plots of the raw
data. All five recovered units appear to have worked well, with a full data
return. Comparisons between the SeaGauge temperature with the CTD temperature
extrapolated to the SeaGauge depth just before recovery shows that the SeaGauge
temperature reading is very close to the CTD value, suggesting that the
SeaGauge temperature sensor is in calibration.
Comparison with the SeaGauge
conductivity/salinity data just before recovery shows an offset of order
0.15 psu for all units. The instrument calibration sheets from SeaBird indicate
that the conductivity cells were calibrated before being cleaned, but not
recalibrated after cleaning, so there could be a bias and slope offset. We may try to mount the SeaGauges to the CTD
and let them soak at 10 m for several record cycles, to get a comparison point
at the fresh end (33.7 psu) of the T/S range.
The comparison with the deep CTD data gives a comparison at the saline
end of the range (34.7 psu). This
approach may provide what is needed to correct the SeaGauge data. Dick also has
downloaded the work horse ADCPs, which appear to have worked correctly. Dick was
able to get all three units ready to deploy on the new C moorings.
Arrived
S3 at 1525, Sent three release commands (last at 1602), before getting
confirmation of mooring ascent. S3
recovered and on deck by 1710, then deep XBT taken as ship heads for S2. ETA = 0400.
The
decision was made to not deploy a replacement instrument at S3, so that it
could be deployed at a new site S9 within Marguerite Bay. Also, there is some concern that the S4A
hydrophone may be too quiet, i.e., have low gain, so at S2, John and group will
decide if they want to revisit S4A and recover it and deploy a new instrument
with a different hydrophone. They decided to leave S4A as is.
Sunday 2/17 (yd=48)
Arrived
at S2 about 0400. Sent second release command at 0721, with confirmation of
instrument starting to rise. Then prepared S2A and deployed it at 0542. S2 recovered and on deck at 0616. Then a
deep XBT fired at 0630, and two sonobuoys launched at 0631 (it failed) and
0636. Final commands sent to S2A at
0653, and we headed for float site F4. ETA = 0700 tomorrow.
Meet
with Captain, Randy, Scott, Josh, Deb at 12:30 to go over schedule for rest of
cruise. We will try to deploy our three new WHOI moorings on Monday and
Tuesday, then drag at B1. Then the rest of the cruise can be devoted to MM
work. Will determine positions for WHOI moorings this afternoon. The ice
images, plus information coming from the NBP which is working south of us,
suggests that we will not be able to get close enough to Alexander Island to
deploy C3 at its intended position. The first alternative is to deploy C3 at
B2, in order to get a full 2 year record there. We can do this utilizing all
the spare wire rope (365 m) left over from last year’s cruise.
At
1500, John suggested that we pass S8 on the way to F4, so that they can
determine if the instrument is still there or not. If there, they will disable
the release and plan to drag for it or use a ROV on next year's mooring cruise.
Asked bridge to do this.
Talked
with Dick and Breck about target positions for the C moorings. Plan is to deploy C1 at or near initial
site, C2 in the George VI deep channel, and C3 near B2. This would place the
moorings in a L, with two across the month of Marguerite Bay and one offshore. One might guess that the surface flows may
be coherent, but the deep flows uncoupled. These are all high risk locations,
since all moorings on the B-line had ice damage. However, these new moorings
will have the top-most float at ~ 100m, which should help. Also, the B2 mooring
came back, so hopefully the new C3 mooring located there should also come back.
John
found S8 at 2400 still on the bottom, and left it with the release disabled.
Monday 2/18 (yd=49)
Arrived
at F4 at 0700 and deployed float 110 at 0707, then headed to F5. Deployed float
112 at F5 at 0929, and float 145 at F6 (B1) at 1153.
In
route, noticed that some variables in yesterday's JGOF met file had
considerable high frequency noise. The
variables affected were SW, LW, AT, WS, and RH, all variables placed on the
mast or base of the mast. Andy shut
down the system around 1030 and is doing some tests to help determine and fix
the problem.
Randy
reported that the NBP had found a distinct ice-edge at -68 23' S, -69 48' W,
just about 3 nm south of the proposed C2 site.
Also reported winds from the east and southeast, which might push the
ice towards the north. We plan to go to C2 after C1 and determine if conditions
allow us to deploy at C2. If not, need to move northward.
Arrived
at one mile southwest of the proposed C1 site about 1400, and started a
bathymetry survey. It took almost an hour to get the MATLAB plotting program to
work optimally on my PC, but Dick go it going, as we were starting with the
depth survey. After finding the proposed
C1 site too shallow, we moved site to west using SeaBeam data as a guide. About 1630, completed depth survey, and
moved down-wind to set up for the C1 deployment. The deployment went smoothly, with the top flotation sphere going
in the water at 1658 and the anchor released at 1822. Because of the difficult
angle of the approach, the bumpy bottom, and the possibility of some fallback,
the actual mooring depth could vary from 450 (design depth, and most likely
actual depth) to the shallowest of 396 m.
Then CTD 7 was completed by 2007, Scott disabled the C1 release at 2017,
and float 111 and drifter 25120 were deployed at 2032 and 2033 as we left C1
and headed for C2. Drifter 24476 and float 124 were deployed at 2137 and 2139
about halfway between C1 and C2.
On
our way to C2, we checked that the sound speed (1456 m/s) set in the ship's
sounder was close to that computed at B2 (depth average is 1459 m/s). The
difference would only make a 2 m difference in a 1000-m depth reading, so any
adjustment for this in the C2 depth survey was ignored.
As
we approached the proposed C2 position near midnight, it became clear that this
site was several miles deep into heavy ice, making it an impossible place to
deploy a mooring without causing heavy damage to the instruments on the mooring
when it was being dragged through the surface waters.
Tuesday 2/19 (yd=50)
Using
the complete coverage of the SO GLOBEC SeaBeam data in the George VI channel
region, we made a high- resolution map of the channel as a guide, and steamed
north along 70 W until we left the ice front and found a relatively level
region within the channel. Because we
wanted the site to be within the deep channel (so we can learn about the deep
currents in this the major cross-shelf channel, and the bottom quite irregular
even in the channel, we conducted an extensive depth survey from 0030 to 0430
to locate a good site, with a design depth of 850 m. Then woke Scott 0500, redesigned the 1000-m C2 mooring to fit the
850-m site, and headed 1.75 nm to the southeast of the drop site to start
deploying the mooring. The top
flotation sphere was deployed at 0608 and the anchor dropped at 0832, after a
long tow to the drop point. As we were
deploying the mooring, the barometer and air temperature stated to fall, the
wind increased to a sustained 30+ kts from the north, and the seas started to
build by noon.
After
CTD 8 was completed and the release disabled, we decided to steam to C3 (the
original B2 site) to see if the conditions had improved enough for safe mooring
operations. Heaved to at C3, the back deck was awash, and the pitching motion
would put much too much strain on the mooring line, so Scott called off the C3
deployment and the ship steamed into Marguerite Bay along the southern most tip
of Adelaide Island, arriving there around 1700 to start the IWC MM work.
Captain reported wind gusts to 60 kts, and the ship's wind sensor reported a
peak gust of 106 kts. Conditions much smoother east of Adelaide Island, but
winds continued to be 30 kts from the north.
Ship
steamed east through Bourqeois Fjord, around Pourquoi Pasque Island, reaching
the main channel about midnight. A pod of orcas was seen. Captain spoke with
the NBP (now located in the ice in the southern end of Marguerite Bay) about
the weather situation, and they think a strong low will hit us tomorrow
(Wednesday) and hopefully blow out by Thursday night. We need one good day to
deploy the C3 mooring, and if we can not drag at B1, we will do so next year.
Wednesday (2/20) (yd=51)
Continued
on a zigzag course within the northern Marguerite Bay to look for whales and
other marine life. Weather not ideal
for this, with winds 20-30 kts, white caps, and scattered rain, all of which
made looking for distant whale breaths very difficult. The SIO group deployed occasional sonobuoys.
Around
noon, weather still not great for MM operations. Ship doing a zigzag course
across the channel moving slowly north towards Tickle Pass, where we hope to
find calmer conditions and some whales to biopsy. Ship passing through the
Gullet around 1600, and Tickle Pass around 1700.
Scott
and crew have been downloading the WHOI instruments. First report is that all
VACMs wrote full tapes, an excellent sign.
The ice profiler that lost its flotation had many internal electrical
connectors disconnected within the pressure housing, indicative of a lot of
shaking (vibration).
After
exploring the bay north of Tickle Pass, and finding some large ice flows there
with a few whales, seals, and penguins, the Captain decided not to stay there
for the night, just in case the winds got strong and started to pack ice into
Tickle Pass and make it difficult for the LMG to move south again. So the LMG headed south and passed though
Tickle Pass and the Gullet around 2100. Spotted a pair of humpbacks and
launched the zodiac with Randy, Mark, Rebecca, and Sean around 2200.
Unfortunately, we lost sight of the whales from the bridge, and they were gone
by the time the zodiac reached their last known position. The zodiac was back onboard by 2300, and the
ship continued south.
Thursday (2/21) (yd=52)
Started
north from off Rothera conducting the MM survey. About 0910, launched the zodiac with the same crew to close to a
pair of humpbacks spotted by the bridge (this pair may have been the same pair
spotted last night in this area). The zodiac crew was able to close and look at
the whales just before the whales disappeared.
The zodiac returned to the LMG and we started heading south around 1030
towards B2. ETA = 1830.
Met
with Scott to modify the 450-m C3 mooring so it could be deployed at the old B2
site. By using the extra wire and the deepest VACM saved when the C2 mooring
was shortened from 1000 m to 850 m, the new C3 was lengthened to 815 m, with
the ADCP at 110 m, and VACMs at 250, 400,and 765 m (50 m above the bottom). We
do not have sufficient microcats to put one on the bottom VACM, and can not put
a SeaGauge at 810 m on the release, since the remaining units have a maximum
depth range shallower than 800 m. Therefore, the new array will have just the
VACM 50 m above the bottom, and a T-pod just above the release. This will
provide good temperature data near the bottom, and hopefully will be able to
use the deep TS relationship to infer salinity. Checked design with Dick after lunch, who thought it fine. Scott and crew will start winding wire on
the winch then. Once at B2, we will
assess whether conditions are suitable for deployment, and where to start
deploying. We will want to deploy going
into the wind. Also, we will aim for exactly the old B2 position, and depending
on how we approach the position, will add for some fallback.
Arrived
at C3 (B2) about 1815, with almost no winds (<5 kts), occasional periods of
light snow, limited visibility, and swell from oth W and NW, making the seas
confused. Depth at the old B2 site was close within a few meters of 811 m. With no wind, started deployment at 1.5 nm
to the SE from the drop site. Top
flotation sphere deployed at 2015. Ship
is about 220 ft long, roughly 70 m. Mast with the GPS antennas about mid-ship,
so distance from GPS to stern about 35 m. Due to SE approach, decided to
overshoot the drop point by releasing the anchor when the ship's stern was
about 100 m NW past the drop point, so fall back will put the anchor back on
the drop point. Anchor released at 2044, with water depth 815 m. CTD 9 was
completed by 2200, Scott disabled the C3 release, and we headed for B1.
Friday (2/22) (yd=53)
Arrived
at B1 about midnight. Made one last attempt to communicate with the B1 release
but no response. Decided to approach the
site from the NW, making a .2 nm half circle around the site and then steam
towards the NW before stopping and hauling back. Started the first drag at
0036, first weight on bottom at 0120, depressor with pinger 30 m above in water
by 0154. Started turn about 0400, and started hauling in at 0439. There was one
large tension event (>5000 lbs), but nothing on the hooks. The hooks were
placed at 300 m before the end (last weight) and 300 m behind the depressor
weight at 700 m.
Decided
to do second drag approaching the site from the SSW, then making a half circle
around the site, and steaming S and SSW before hauling back, plus increasing
the length of wire on the bottom from 700 to 1000 m behind the depressor
weight. Started deploying are 0637, had
wire on the bottom by 0650, started turn at 0745 with a total of 1900 m of wire
out. Then closed the circle by steaming SSW and stopping at the approach line,
and continued to haul back, with no success.
The last weight was on deck by 0952, got gear put away, and started
south for the ice edge and marine mammal work by 1000.
The
dragging operations took about 10 hrs, and involved Scott, Ryan, and Jim with
Randy and later Josh on the deck, Fernando on the winch and A-frame, the
Captain monitoring the work from the aft control room, and myself helping the
mate on watch steer the best course.
This work was added to the C3 mooring deployment done yesterday evening,
so every one was extremely tired by the end of the combined mooring/dragging
work. Everyone worked extremely well together and safely despite the long
hours, and I want to thank them all for their effort. Both drags were well executed, and should have worked if there
was any part of the B1 mooring left upright. This suggests that the mooring is
not there, that it must have been struck by an iceberg and pulled and smashed,
so that the release was broken or towed so far (>5-10 nm) covered in our
initial acoustic search. Randy said
that he saw many huge icebergs in this area during the LTER cruise this January.
Hopefully, the C1 mooring will be more protected by surrounding topography and
will survive this coming winter.
The
weather conditions for the dragging were quite good, weak winds (<5-10 kts),
old swell from the W and NW, and sufficient light to see if any buoys
surfaced. After the dragging was
completed, the LMG headed south to near the ice edge, and spotted several
groups of humpbacks, and launched the zodiac for sampling. The zodiac closed with the whales and
obtained one biopsy. Around 1530, the zodiac was recalled, and the ship headed
S and W for the ice edge. The conditions have improved, with weak winds, very
few whitecaps, more sunlight, making looking for whales on the bridge much
easier. Around 1630, the zodiac was launched again for biopsy work.
The
zodiac returned to the LMG about 1900.
They collected a total of 5 humpback biopsies from two groups. Except for large swell which made spotting
the whales more difficult in the zodiac, conditions were excellent. After Deb came aboard, John, Deb, Randy, and
myself met to decide on the schedule for the rest of the cruise. The options
were to leave here about 2000 tonight to get to Rothera Station for tomorrow's
visit, or stay here where the whales are and continue to work the ice-edge
region to the east into Marguerite Bay, and see if Rothera would allow a visit
on Sunday. After thinking about this, we concluded that we should cancel the
Rothera visit (to give us the most time flexibility) and continue to work the
ice edge where the whales are present.
Randy called Rothera and cancelled, explaining the need to do the
science when it can be done. Rothera understood, and all is fine. We will stop tonight when it is too late to
see whales, then start tomorrow at 0400 to work to the east.
Saturday (2/23) (yd=54)
Over
night, the winds have strengthen to 15-20 kts from the NW and W, with fog and
occasional snow, so visibility and sea state not good for the MM survey work.
Detoured north of the Kirkwood Islands and heading back SSE to the ice edge at
0900. Hopefully conditions will improve for the MM work.
Conditions
remained poor for MM survey work, with winds 20-30 kts from the N and NW,
occasionally from the W, with intermittent good visibility. Deb decided to
continue steaming about E then N back towards Rothera, and about 1300 directed
the ship to steam to the S9 site for the deployment of the SIO bio-acoustic
mooring in the center of the Rothera deep channel. Arrived at S9 about 1515,
deployed instrument at 1548, disabled it on bottom while Andy deployed a XBT.
John had some initial concern about the launch, in that the glass balls were
pulled under the stern rapidly.
However, the instrument sink rate was normal, and the release response
was normal, so the conclusion was
that the instrument was ok. Left site
about 1615.
Plan
for the rest of today is to head west and around the outside of Adelaide
Island, keeping as close to the coast as reasonable, deploy sonobuoys looking
for blue whale calls, conducting visual MM survey work if the conditions
improve, arriving at the northern end of Adelaide Island (Matha Strait) near
midnight.
Sunday (2/24) (yd=55)
Found
Matha Strait to have 10/10 ice, so decided to continue northeast along the
shelf and try to enter Pendleton Strait.
The weather has continued to worsen, with winds at 0800 reaching
sustained 30-40 kts, with very limited visibility, less than 0.25 nm in snow
and fog at times. Barometric pressure has started to drop since midnight.
At
1230, steaming SSE into Pendleton Strait, winds still 30+ kts from the NE. Visibility has improved, but conditions
still too rough for visual MM survey work.
Fire drill at 1240. Start into Mudge Passage, heading for Larrout
Island. This area is more sheltered,
winds have dropped to 15 kts, good visibility. Ran into too much ice at about
1500, Captain decided to reverse course and leave this area along the
reciprocal track. Saw some large groups of seals on different flows. One group appeared to exceed 50 animals,
others 10 and 20 animals. Small groups
(2 to 6) of Adelie penguins on flows, some near seals. Saw some humpbacks and one minke whale
earlier on the way north into Mudge Passage, but too windy to launch a zodiac.
Winds picked as the ship approached Pendleton Strait. Leaving the strait around 1830, ETA to S7 is 2300.
Wind
and seas too rough to do mooring work, so returned to Pendleton Strait to find
sheltered waters for the night. Winds
remained 30+ kts.
Monday (2/25) (yd=56)
The
winds were still 30+ kts during the morning, so stayed in Pendleton
Strait. Decision made to deploy S7 over
the stern. The zodiacs have already
been moved to the 01 deck, leaving the fantail clear for the mooring deployment. We plan to use the knuckle boom to lift the
instrument over the stern gates and lower it into the water off the stern as
the ship is making 0.5 kts forward speed, so the entire instrument streams
back, away from the stern. Plan is to
leave here about 1800, steam to the original S7 site and deploy there. If
conditions are too rough to deploy, steam to an alternative site near Palmer
Station and deploy there before docking at Palmer.
Arrived
at S7 about 2000, winds still 25+ kts from the NE and large whitecaps, but
conditions seem ok for a stern deployment. After getting the instrument ready,
it was deployed over the stern with the ship moving ahead at about 0.5 kts so
that the floats and instrument are carried away from the stern. The instrument was raised over the stern
gates, and lowered with two tag lines into the water, then released. This was the smoothest deployment yet during
the entire cruise. After Andy made his
XBT cast and John disabled the release, we headed for Palmer Station.
Tuesday (2/26) (yd=57)
Arrived
Palmer Station 0800. Drizzle, almost no wind, overcast. Day spent shifting WHOI
and SIO gear to make space for the containers and other equipment to be loaded
here for the northward trip to Punta Arenas. About 1500, ship was told that
some humpback whales were located near one of the Palmer Station water sampling
locations, so Josh took one zodiac out with Mark, Rebecca, Breck, Andy, Sara,
John to find them and take photos and biopsies if possible. They were
successful in getting biopsies from both animals. Shortly after this zodiac
left, a second zodiac left with Dave, Bob, Barb, Jennifer, and two others. We
also found a pair of humpbacks "rough-housing". They stayed with our zodiac as it drifted
for over one-half hour. Then Josh's boat arrived and continued to observe this
second pair. Our boat left, then Josh's
boast left after the whales were starting to display more aggressive behavior
towards the boat. Being so close to
these magnificent animals playing was increditable.
Palmer
Station had a pizzazz diner at 1730 for us, and we finished the night with a mellow
party at the lounge.
Wednesday (2/27) (yd=58)
Left
Palmer Station at 1000, headed northeast on inland route (Neumeyer Passage,
Dallman Bay). Conditions for a visual
marine mammal survey were excellent, good light, almost no wind. Rebecca and Deb logged over 20 humpbacks,
plus we saw seals and penguins in the water.
ETA for S1 is 0500 tomorrow morning. There will be no XBT/XCTD survey on
this northbound transit across the Drake Passage.
Thursday (2/28) (yd=59)
Arrived
at S1 around 0420, and released S1A over the stern at 0448. Andy made a deep XBT cast, and John
confirmed the instrument was on the bottom, then disabled the release. Deployed one sonobuoy at S1A, then started
steaming north at 0529 and dropped a second sonobuoy to listen for the blue
whale heard on the first sonobuoy but with no success. Weather today has been perfect, bright sun
with occasional clouds, gentle swell from the west, winds below 5 kts, frequent
birds.
Friday (3/1) (yd=60)
Back
to more typical Drake Passage weather: mostly cloudy, winds from the north at
20+ kts, warm and humid.
7.
Chief Scientist’s Daily Log
Wednesday – February 6, 2002 (All times local time, GMT-3)
1700 – Depart Punta Arenas steaming eastward out the Straits of Magellan.
1900 – Safety meeting with Chief Mate
2000 – Science meeting
Thursday – February 7
1000 – Mooring group meeting with Captain
1230 – Fire drill
1900 – XBT class with ET
2148 – Start XBT/XCDT/ADCP section across the Drake Passage
Friday – February 8
0000 – Continue XBT/XCDT/ADCP section across Drake Passage
Saturday – February 9
0000 – Continue XBT/XCDT/ADCP section across Drake Passage
0530 – Start IWC marine mammal survey, SO GLOBEC cruise event log
1745 – End marine mammal survey
1842 – Arrive at SIO mooring S1, make XCDT cast, recover S1
2045 – Continue XBT/XCDT/ADCP section towards Palmer Station
2319 – Finish XBT/XCDT/ADCP section, head for Palmer Station
Sunday – February 10
0500 – Start marine mammal survey, sonobuoy deployments
1530 – End marine mammal survey
1645 – Arrive at Palmer Station
Monday – February 11
1500 – Switch ADCP sampling to GLOBEC configuration
1516 – Change ship depth sounder from 1500 m/s to 1456 m/s
1600 – Depart Palmer Station, head for S7
Tuesday – February 12
0400 – Arrive S7, XBT, sonobuoy, start recovery
0600 – S7 recovery complete, steam for S8
1203 – Deploy WHOI drifter 25180
1205 – Deploy WHOI float 138
1600 – Arrive S8, sonobuoy, XBT, start recovery
2300 – Left S8 still on bottom, steam for WHOI mooring A1
2321 – Deployed drifter 24477
2322 – Deploy float 139
Wednesday – February 13
0400 – Arrive A1, make CTD cast 1
0500 – Start A1 recovery
0646 – A1 on deck, head slowly for A2 as deck is cleaned
0945 – Arrive A2, make CTD cast 2
1042 – Start A2 recovery
1206 – A2 on deck, head slowly for A3 as deck is cleaned
1515 – Arrive A3, make CTD cast 3
1616 – Start A3 recovery
1800 – A3 on deck, head slowly for B1 as decked is cleared
1049 – Deploy float 137
Thursday – February 14
0350 – Arrive B1, unable to talk to acoustic release, CTD cast 4
0700 – Depart B1, head for B2, start MM survey
0833 – Arrive B2, acoustic release responded, head for B3
1027 – Arrive B3, CDT cast 5
1130 – Start B3 recovery
1315 – B3 on deck, head for B2
1530 – Arrive B2, CTD cast 6
1635 – Start B2 recovery
1815 – B2 on deck, head for B1 to do acoustic search for B1 release
Friday – February 15
0200 – End acoustic search at B1, head for S6
1200 – Arrive at S6, send second release command 1235
1348 – Deploy S6A, XBT
1412 – S6 on deck
1500 – Confirm S6A on bottom, head for S5
2030 – Arrive S5, send second release command 2048
2139 – Deploy S5A, XBT
2236 – S5 on deck
2300 – Confirm S5A on bottom, head for S4
Saturday – February 16
0430 – Arrive at S4, send third release command 0534
0636 – Deploy S4A
0721 – S4 on deck
0800 – Confirm S4A on bottom, XBT, head for S3
1525 – Arrive at S3, sent third release command 1602
1728 – S3 on deck, XBT, head for S2
Sunday – February 17
0400 – Arrive S2, send second release command 0421
0542 – Deploy S2A
0616 – S2 on deck, XBT, sonobuoy
0653 – Confirm S2A on bottom, head for S8 and F4
2400 – Check S8
Monday – February 18
0707 – Deploy float 110
0929 – Deploy float 112
1150 – Deploy float 142
1400 – Arrive at C1, conduct
bathymetric survey
1658 – Start C1 mooring
deployment
1822 – C1 anchor deployed
1943 – CTD 7 at C1
2032 – Deploy float
2033 – Deploy drifter 25120, steam south towards C2
2137 – Deploy drifter 24476
2139 – Deploy float 124
2330 – Arrive at C2
Tuesday – February 19
0030 – Conduct bathymetric survey
0608 – Start C2 mooring deployment
0832 – C2 anchor deployed
0844 – Deploy drifter 25119
0931 – CTD 8 at C2, steam northeast towards C3 (B2)
1200 – Arrive C3, too rough for mooring work, steam towards Adelaide Island
1800 – Start inshore marine mammal survey east of Adelaide Island
Wednesday – February 20
0000 – Continue marine mammal (MM) survey east of Adelaide Island
2300 – Stop MM survey near Rothera
Thursday – February 21
0000 – Continue MM survey north of Rothera
1100 – Start steaming to C3 (B2)
1830 – Arrive C3, check depth
1850 – Start C3 deployment
2044 – C3 anchor released
2130 – CTD 9 at C3, steam for B1
2215 – Deploy Drifter
Friday – February 22
0000 – Arrive B1, begin dragging operations
1000 – Finish dragging operations, start steaming south
1000 – Start MM survey work
2300 – Finish MM survey work
Saturday – February 23
0400 – Start MM survey work
1548 – Deploy S9, XBT
1630 – Confirm S9 on bottom, start for Matha Strait
Sunday – February 24
0000 – Found Matha Strait blocked, start for Pendleton Strait
0600 – Enter Pendleton Strait, start MM survey work
1800 – Leave Pendleton Strait, stop MM survey work, head for S7
2000 – Return to Pendleton Strait
Monday – February 25
1800 – Leave Pendleton Strait, head for S7
2038 – Deploy S7A, XBT, head for Palmer Station
Tuesday – February 26
0800 – Arrive Palmer Station
1500 – MM survey work east of Palmer Station
Wednesday – February 27
1000 – Leave Palmer Station
1200 – MM survey work
Thursday – February 28
0448 – Deploy S1A, XBT, head for Punta Arenas
Friday – March 1
0000 – continue to Punta Arenas
8. Cruise Personnel
Science Party
Robert Beardsley Chief
Scientist
Richard Limeburner Scientist
Breck Owens Scientist
Scott E. Worrilow Electronics
Engineer
Ryan C. Schrawder Electronics
Engineer
James R. Ryder Mooring
Engineer
Mark A. McDonald Scientist
John Hildebrand
Scientist
Sean Wiggins
Electronics
Engineer
Ana Sirovic Graduate
Student
Deborah Thiele Scientist
Rebecca Pirzl Scientist
Southward Transit to Palmer Station
Maria Vernet Scientist
Eugene Burreson Scientist
John Booth Palmer
Station
Timothy Brox
Palmer Station
Northward Transit from Palmer Station
Maria Vernet Scientist
Dave Bresnahan NSF Representative
Steffi Suhr
Palmer Station
Gene Burreson Scientist
Sue Cowles Teacher
Orion Carlisle Palmer Station
Brett Pickering Palmer Station
Hugh MacMullan
Palmer Station
Raytheon Polar Services Staff
Randy Sliester Marine Project Coordinator
Joshua Spillane Marine Technician
Andrew F. Nunn Electronics
Technician
Sara Disick
Marine
Science Technician
Jordan Watson Marine Science Technician (Southward
Transit)
Ship Officers and Crew
Robert Verret II Master
Morris J Bouzigard Chief
Mate
Tracy Ruhl 2nd Mate
John Synder 3rd Mate
Michael L. Murphy
Chief Engineer
Gerald Tompsett 1st
Engineer
Noli Tamayo 2nd Engineer
Joseph A. Meneses Oiler
Donde Dasoy Oiler
Rodolfo S. Lucas 1st Cook
Luciano Albornoz 2nd
Cook
Rafael Sabino Galley
Hand
Fernando Naraga Deck-Crane
Efren Prado Deck-Crane
Donito M. Padasas Deck
Roy G. Ninon Deck
Acknowledgements
This
cruise report was prepared by Bob Beardsley, Richard Limeburner, Breck Owens,
Mark Macdonald, John Hildebrand, Ana Sirovic, Sean Wiggins, Deb Thiele, and Rebecca Pirzl.
We especially want to thank Captain Robert Verret II and the officers and crew of the R/V Laurence M. Gould for their superb assistance in the recovery and deployment of the WHOI and SIO moorings during LMG02-1A, and in the marine mammal survey work. Some of the mooring operations occurred during difficult conditions, including working in the ice, and the Captain and mates were able to maneuver the ship to make the stern deck a safe and efficient working area during these operations. It was especially helpful to have Captain Robert driving the ship from the aft control room with Fernando Naraga or Efren Prado controlling the A-frame during all mooring recoveries.
Special thanks to Randy Sliester of
Raytheon Polar Services (RPS) for coordinating the various activities during
the cruise and, in general, making the cruise run smoothly. The WHOI mooring
team was lead by Scott Worrilow with assistance from Ryan Schrawder and Jim
Ryder. They deserve great credit for
the successful mooring planning, design, recoveries, and deployments made on
this cruise. The SIO mooring team was
led by John Hildebrand, with assistance from Sean Wiggins, Ana Sirovic, and
Mark Mcdonald. They also deserve great
credit for the success of the bio-acoustics moorings. Randy Sliester and Josh Spillane (RPS) were on deck for all
mooring operations and provided excellent support running the mooring winch,
knuckle crane, A-frame, etc., while keeping an eye on safety. They also provided excellent zodiac support
during the whale sighting and sampling work.
In addition to his job as cruise ET, Andy Nunn (RPS) collected all the
CTD and XBT data during the cruise and provided processed data for our
analysis. Andy also oversaw the
collection of meteorological and underway data and jumped in to correct
problems when they arose. Sara Disick
(RPS) kept the shipboard scientific equipment working, and collected and
processed all the water samples collected with the CTD rosette sampler.
The WHOI and SIO work conducted on
this cruise is sponsored by the National Science Foundation, NSF research grant
OPP-98-XXXXX and OPP-98-XXXXX respectively.
The marine mammal survey work is supported by the International Whaling
Commission. All data and results in
this report are to be considered preliminary.
Appendix A. Bathymetric
Surveys of the WHOI Mooring Sites
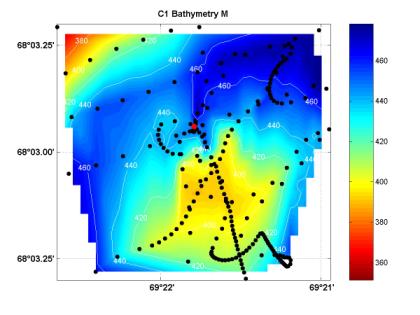
Figure A1. Bathymetry (m) at the C1 mooring site. The C1 anchor was released at the red dot located 69o 21.790’ W, 68o 02.940’ S, water depth 450 m. Fallback may make the actual anchor depth less.
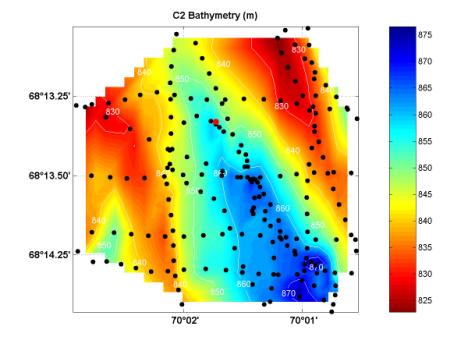
Figure A2. Bathymetry (m) at the C2 mooring site. The C2 anchor was released at the red dot located 70o 01.730’ W, 68o 13.331’ S, water depth 850 m. Fallback may make the actual anchor depth more.
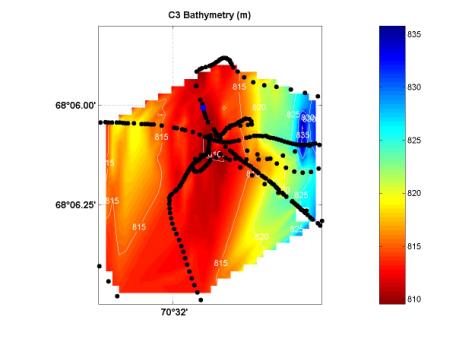
Figure A3. Bathymetry (m) at the C3 mooring site. The C3 anchor was released at the blue dot located 70o 31.799’ W, 68o 06.006’ S, water depth 815 m. Fallback may make the actual anchor depth more.
Appendix B. Surface Temperature, Salinity, and Fluorescence Maps
This appendix presents simple maps of the sea surface temperature (SST), salinity (SSS), and fluorescence (Fluor) collected with the ship’s underway instrumentation. Two maps are shown for each variable, the first map includes the color code used to bin the variable, and the second map is more focused on Marguerite Bay. The SST maps (B1, B2) show the coldest water (< -1 oC) was found near the B3 mooring site (in the ice) and also just south of Palmer Station. Water near the ice edge in southern Marguerite Bay and east of Adelaide Island was generally also cold (< 0 oC). Water in the northern Marguerite Bay and over the shelf to the west was generally warmer (0 oC < SST < 1 oC), with water off the shelf break and over the shelf north of 67o S exceeding 1 oC.
The freshest water (<32) was found just south of Palmer Station (B3, B4). In general, the water around Pourquoi Pasque Island was between 32 and 32.5, with the northeast Marguerite Bay more saline with salinities between 32.5 and 33. Surface salinities over the shelf away from the mouth of Marguerite Bay were typically above 33. The TS plot for the surface temperature and salinity during Leg 2 (B5) shows the general tendency for the water above 33 to get warmer with increasing salinity. At temperatures below about 0.5 oC, there appear to be two clusters of points, with the freshest waters having temperatures between roughly -0.5 oC and +0.5 oC, while the coldest waters (found near the ice edge) had salinities around 33.
The along-track fluorescence pattern (B6, B7) is also complex, but it is clear that the highest relative fluorescence values (given in volts) were found within Marguerite Bay, east of Adelaide Island, and along the transit from Matha Strait deep into Pendleton Strait, while the lowest values were found over the mid- and outer shelf and along the entire track north of 65.5o S. While the ship’s fluorometer provides a relative measure of fluorescence, the observed fluorescence pattern supports the idea that primary productivity is high in Marguerite Bay.
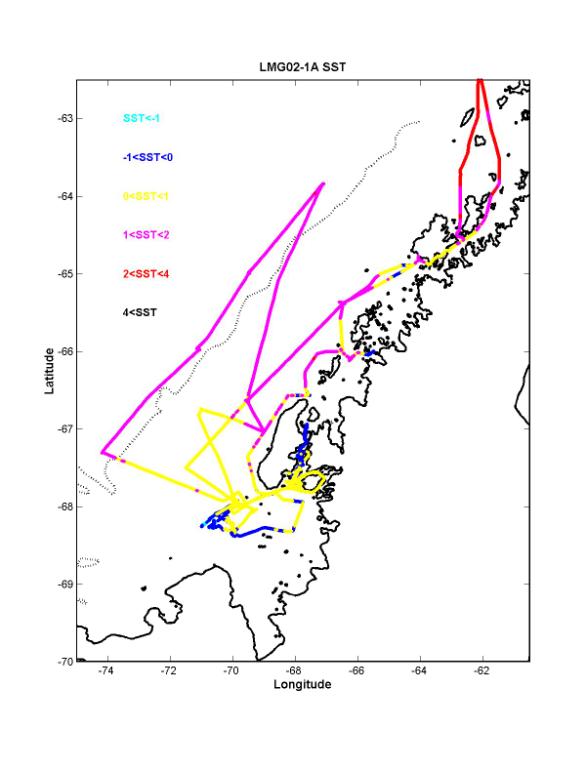
Figure B1. Large-scale map of SST. The temperature is separated into 1 oC bins and plotted using the color code in the upper left.
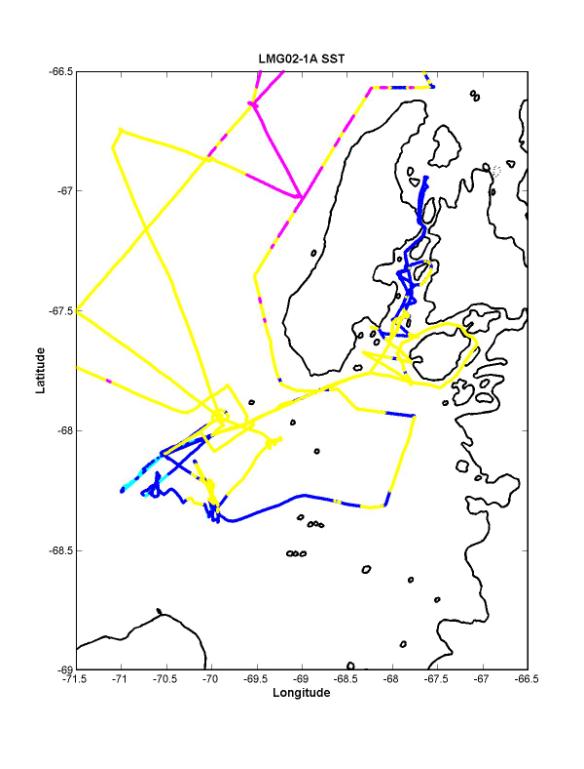
Figure B2. Small scale map of SST. Same color code as in B1.
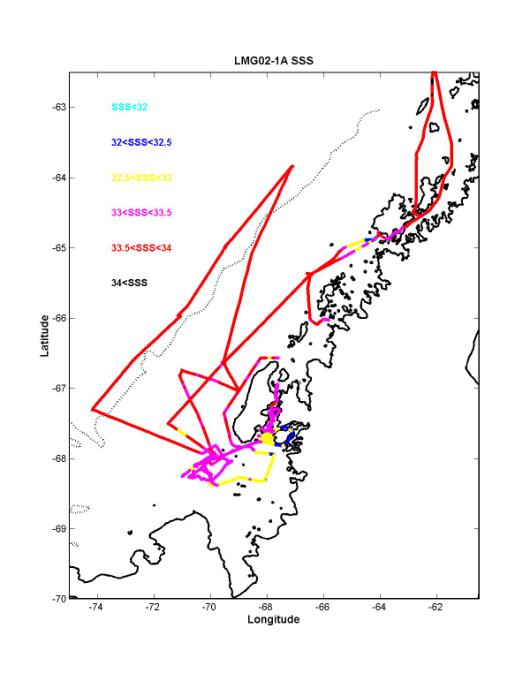
Figure B3. Large scale map of SSS. The surface salinity has been separated into 0.5 psu bins and plotted with the color code shown in the upper left.
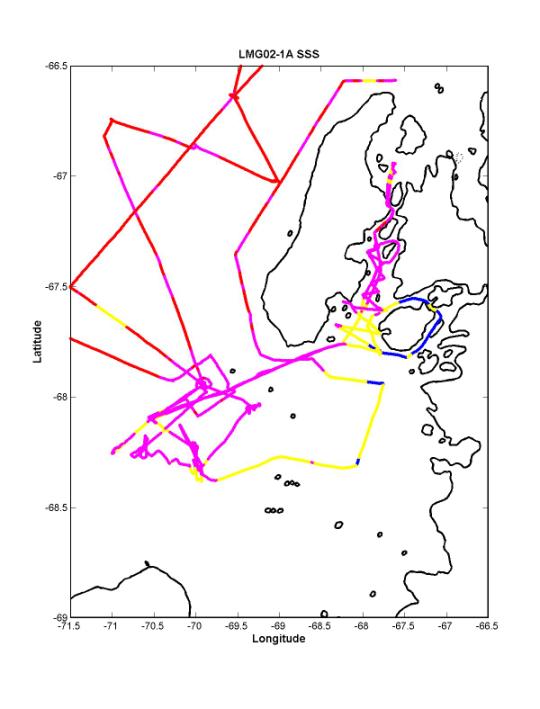
Figure B4. Small scale SSS map. Color code is same as in B3.
FF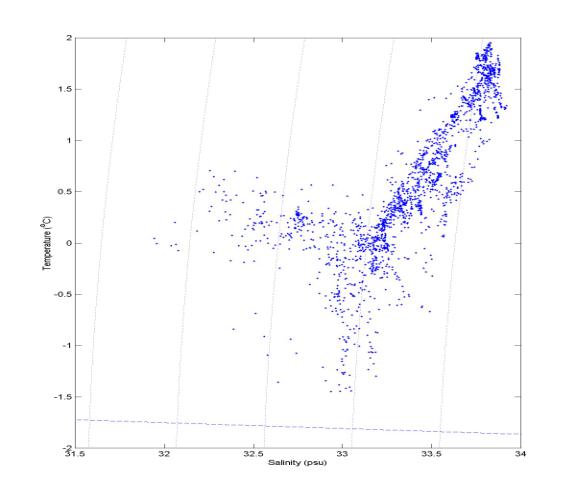
Figure B5. TS diagram for the surface waters during Leg 2 (Palmer Station to Palmer Station).
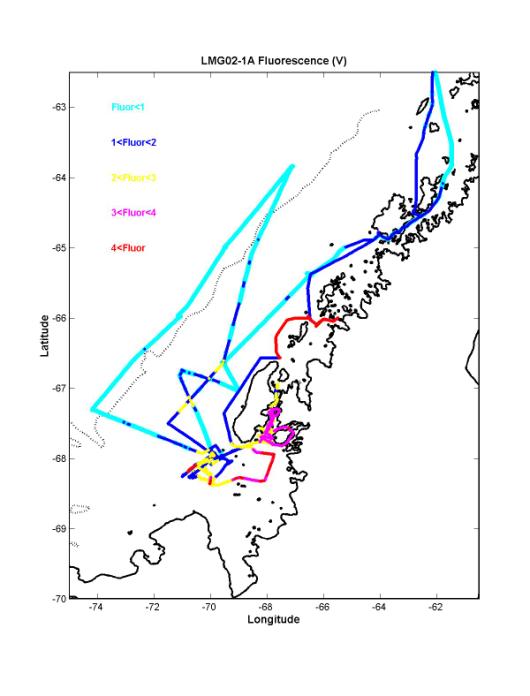
Figure B6. Large scale map of surface fluorescence (in volts). Fluorescence has been separated into 1 volt bins and plotted with the color code shown in the upper left.
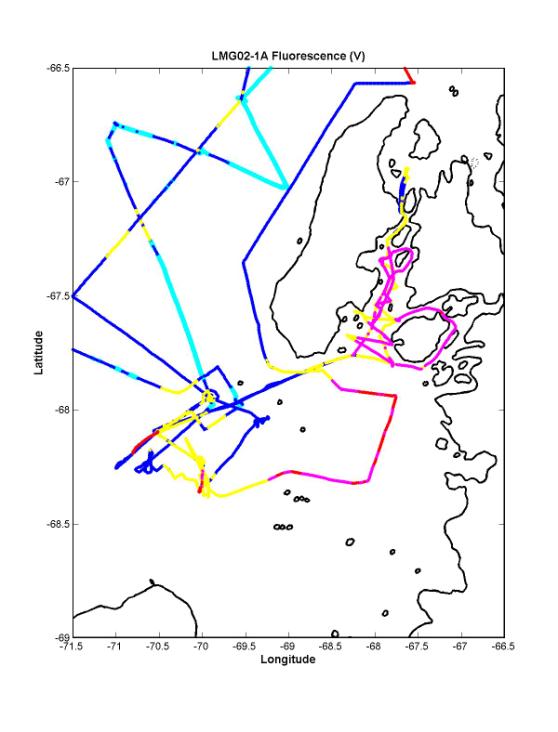
Figure B7. Small scale map of surface fluorescence. Same color code as B6.
Appendix C. Cruise Event Log
Appendix D. Draft WHOI Moored Data Report
MOORED DATA REPORT
R/V Gould – LMG02-1A
>
Punta Arenas
to Punta Arenas
Feb 5 – Mar 3,
2002
In
support of NSF program
WinDSSOcK: WINter
Distribution and Success of Southern OCean Krill: Moored Array, Drifter and
Float Measurements
Richard
Limeburner and Robert Beardsley
Department
of Physical Oceanography
Woods
Hole Oceanographic Institution
Woods
Hole, MA 02543
rlimeburner@whoi.edu
R/V Gould LMG02-1A
Punta Arenas
to Punta Arenas
February 6 –
March 3, 2002
1. Purpose
The primary purpose of R/V Laurence M. Gould cruise LMG02-1A was to recover a Woods Hole Oceanographic Institution (WHOI) array of six current meter moorings near Marguerite Bay, recover a Scripps Institute of Oceanography (SIO) moored array of eight whale acoustic recording packages (ARPS) along the Western Antarctic Peninsula, deploy 6 near-surface satellite-tracked drifters and 12 profiling floats, and to conduct a marine mammal survey of the Marguerite Bay region. This report summarizes the moored data from WHOI instruments recovered during cruise LMG02-1A on the R/V Gould.
A central hypothesis of the Southern Ocean GLOBEC collaborative research program is that a unique combination of physical and biological factors contribute to the enhanced growth, reproduction, recruitment and survivorship of Antarctic krill (Euphausia superba) on the central Western Antarctic Peninsula (WAP) shelf. In particular, this region provides the following conditions that are especially favorable to winter survival of larval and adult krill: a) a clockwise shelf circulation that retains the krill population in a favorable environment for extended periods of time; b) an early and long-lasting ice cover that provides dependable food and protection for larval krill to grow and survive over winter; and c) on-shelf intrusions of warm, salty, nutrient-rich Upper Circumpolar Deep Water which affects hydrographic and ice properties and enhance biological production. The moored array, drifter and float component of the Southern Ocean GLOBEC program is investigating shelf circulation processes and their spatial and temporal variability using long-term moorings and satellite-tracked Lagrangian drifters and isobaric floats. Supporting data on the surface forcing (wind stress and heat flux) will also be obtained and the combined data set used to describe the shelf circulation and water property variability on vertical scales of 10’s of meters and time scales from hourly to seasonal.
2. Moored Data Summary
The severe Antarctic weather was a potential limiting factor during cruise LMG02-1A. Winds were often greater than 20 k during the cruise and all science operations were halted when the winds were greater than 35 k. However, only 1 day was spent waiting for an improvement in weather conditions. During the cruise we successfully recovered 5 of 6 WHOI current meter and 7 of 8 SIO bio-acoustic moorings along the western Antarctic Peninsula, redeployed 3 WHOI current meter moorings and 7 SIO bio-acoustic moorings, deployed six near-surface drifters and 8 isobar floats, made marine mammal observations of the region, and made 9 CTD casts at the WHOI moorings. The LMG02-1A cruise track is shown in Figure 1 and mooring deployment locations are shown in Figure 2.
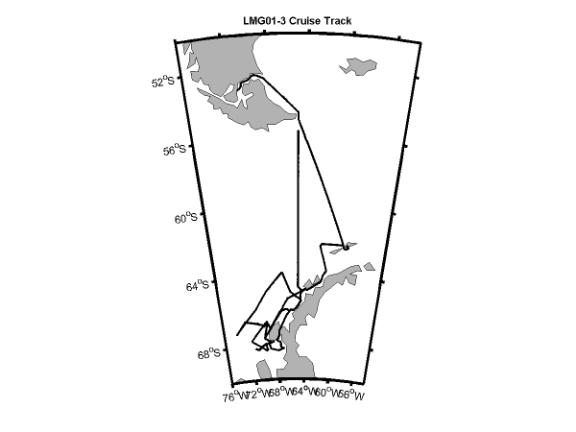
Figure 1. LMG02-1A cruise track
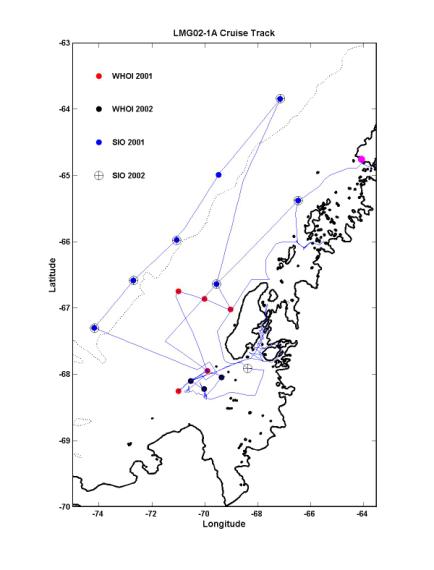
Figure 2. LMG02-1A cruise track showing the locations of the WHOI and SIO moorings.
.
3. Data Summary
The 6 WHOI current moorings were deployed during LMG01-3 along two transects, the A-line located west off Adelaide Island, and the B-line located towards the southwest of the southern tip of Adelaide Island. The 3 moorings along the A-line were called A1, A2, and A3, with A1 being closest to Adelaide Island. The 3 moorings in the B-line were called B1, B2, and B3, with B3 located closest to Alexander Island. The positions and depths of these 6 moorings are given in Table 1.
Station
|
Date
|
Time UTC
|
Latitude
|
Longitude |
Depth m
|
|
CTD 1 (A1) |
2/13/02 |
0742 |
67° 01.249’ S |
69° 00.959’ W |
455 |
|
Recover A1 Mooring |
2/13/02 |
0830* |
67° 01.134’ S |
69° 01.217’ W |
450 |
|
CTD 2 (A2) |
2/13/02 |
1321 |
66° 51.583’ S |
79° 00.250’ W |
562 |
|
Recover A2 Mooring |
2/13/02 |
1352 |
66° 51.883’ S |
70° 00.683’ W |
564 |
|
CTD 3 (A3) |
2/13/02 |
1859 |
66° 44.428’ S |
71° 00.720’ W |
490 |
|
Recover A3 Mooring |
2/13/02 |
1947 |
66° 45.002’ S |
70° 59.991’ W |
490 |
|
CTD 4 (B1) |
2/14/02 |
0737 |
67° 56.603’ S |
69° 54.586’ W |
522 |
|
CTD 5 (B3) |
2/14/02 |
1355 |
68° 15.145’ S |
70° 59.332’ W |
462 |
|
Recover B3 |
2/14/02 |
1503 |
68° 15.345’ S |
70° 59.853’ W |
450 |
|
CTD 6 (B2) |
2/14/02 |
1911 |
68° 05.573’ S |
70° 31.157’ W |
822 |
|
Recover B2 |
2/14/02 |
1944 |
68° 06.091’ S |
70° 31.675’ W |
811 |
Table 1. Mooring positions, time of recovery, and locations and time of CTD casts made
The A-line moorings were recovered with no apparent damage to any instrument or mooring equipment
The B1 mooring was never recovered. The B2 mooring was recovered with the flotation collar on the upper-most instrument (ice profiler) broken off. The B2sc050m900s Seacat 1497 record indicates that the B2 ice profiler lost its buoyancy at July 14, 2001 19: 29: 36 GMT - Bastille Day. Instruments on B2 above 100 m are affected.
The B3 mooring was recovered with the top flotation sphere flooded. The metal bracket for the ARGOS beacon was bent, which had apparently created a small leak which allowed water to fill the sphere. All instruments at the B3 mooring except the deep
SeaGauge sank to a different deeper depth on June 19, 2001 at 16:00 GMT.
Table 2. Moored Data Summary showing good data (blue), unprocessed data (gray), and lost data (red).
2001 Deployment
Station |
Date |
Time UTC |
Latitude |
Longitude |
Depth m |
|
Deploy S1 Mooring |
3/23/01 |
0706 |
62° 16.470’ S |
62° 10.000’ W |
1651 |
|
Deploy S7 Mooring |
3/25/01 |
2349 |
65° 22.620’ S |
66° 28.210’ W |
450 |
|
Deploy A1 Mooring |
3/26/01 |
1940 |
67° 01.134’ S |
69° 01.217’ W |
450 |
|
CTD 1 |
2/26/01 |
2121 |
67° 01.970’ S |
69° 02.260’ W |
306 |
|
Deploy Drifter 30460 |
2/26/01 |
2149 |
67° 02.400’ S |
69° 03.000’ W |
400 |
|
Deploy S8 Mooring |
2/27/01 |
0132 |
66° 38.241’ S |
69° 33.095’ W |
407 |
|
Deploy B3 Mooring |
3/29/01 |
1242 |
68° 15.345’ S |
70° 59.853’ W |
450 |
|
CTD 2 |
3/29/01 |
1340 |
68° 15.610’ S |
70° 59.890’ W |
440 |
|
CTD 3 |
3/29/01 |
1637 |
68° 06.120’ S |
70° 31.950 W |
616 |
|
Deploy B2 Mooring |
3/29/01 |
2018 |
68° 06.091’ S |
70° 31.675’ W |
811 |
|
CTD 4 |
3/29/01 |
2237 |
67° 56.920’ S |
69° 54.380 W |
467 |
|
Deploy B1 Mooring |
3/30/01 |
0212 |
67° 56.890’ S |
69° 54.398’ W |
444 |
|
Deploy Drifter 26373 |
3/30/01 |
0456 |
68° 19.920’ S |
69° 42.109’ W |
256 |
|
Deploy Drifter 24406 |
3/30/01 |
0722 |
68° 06.162’ S |
70° 31.797’ W |
809 |
|
Deploy Drifter 30461 |
3/30/01 |
1132 |
67° 45.216’ S |
71° 58.957’ W |
340 |
|
CTD 5 |
3/30/01 |
2015 |
66° 51.’ S |
70° 00.’ W |
567 |
|
Deploy A2 Mooring |
3/30/01 |
2015 |
66° 51.883’ S |
70° 00.683’ W |
564 |
|
Deploy Drifter 30458 |
3/31/01 |
0018 |
66° 52.331’ S |
70° 01.168’ W |
569 |
|
CTD 6 |
3/31/01 |
1112 |
66° 45.010’ S |
70° 59.900’ W |
782 |
|
Deploy A3 Mooring |
3/31/01 |
1439 |
66° 45.002’ S |
70° 59.991 W |
490 |
|
Deploy Drifter 30459 |
3/31/01 |
1500 |
66° 44.543’ S |
71° 00.012’ W |
491 |
|
Deploy S5 Mooring |
3/31/01 |
1940 |
66° 35.197’ S |
72° 42.311’ W |
3450 |
|
Deploy S6 Mooring |
4/1/01 |
0250 |
67° 17.900’ S |
74° 10.800’ W |
3059 |
|
Deploy S4 Mooring |
4/1/01 |
1403 |
65° 58.400’ S |
71° 04.100’ W |
2962 |
|
Deploy S3 Mooring |
4/1/01 |
2153 |
64° 59.406’ S |
69° 28.795’ W |
2521 |
|
Deploy S2 Mooring |
4/2/01 |
0658 |
63° 50.799’ S |
67° 08.829’ W |
3056 |
Table 3. LMG01-3 mooring and CTD station locations.
4.
Data
Summary Plots of
Unedited Raw Data
4.1 Moored Pressure, Temperature, and/or
Conductivity Data
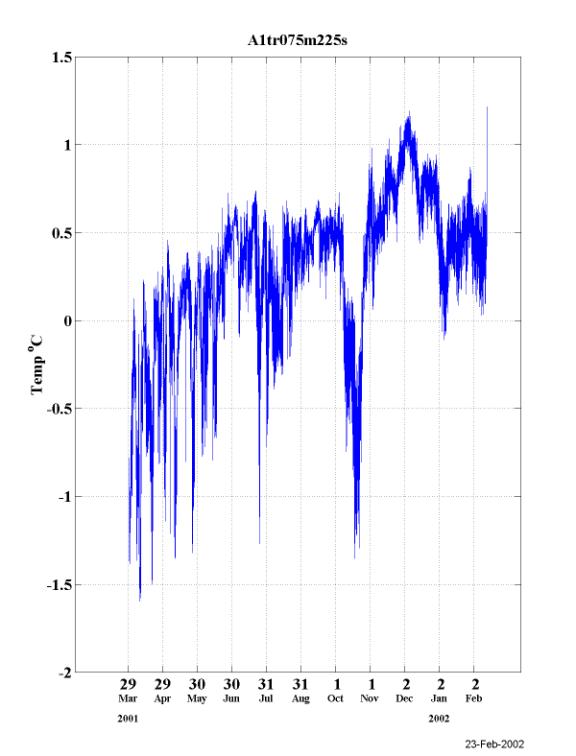
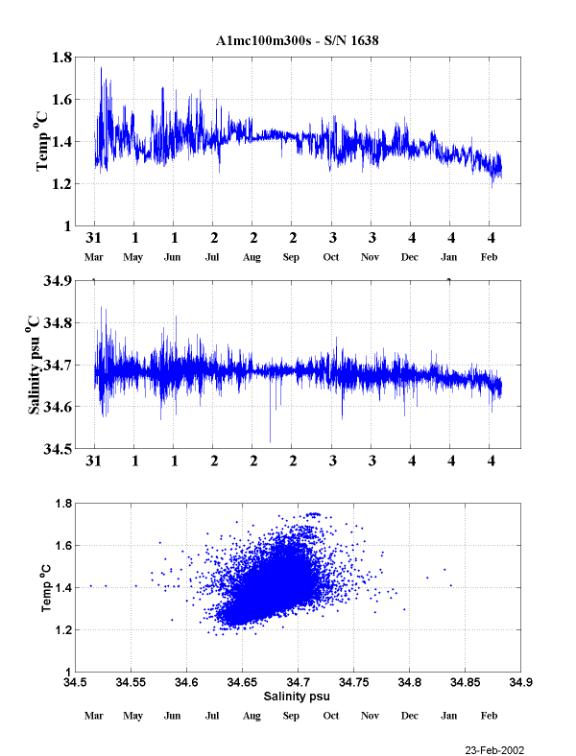
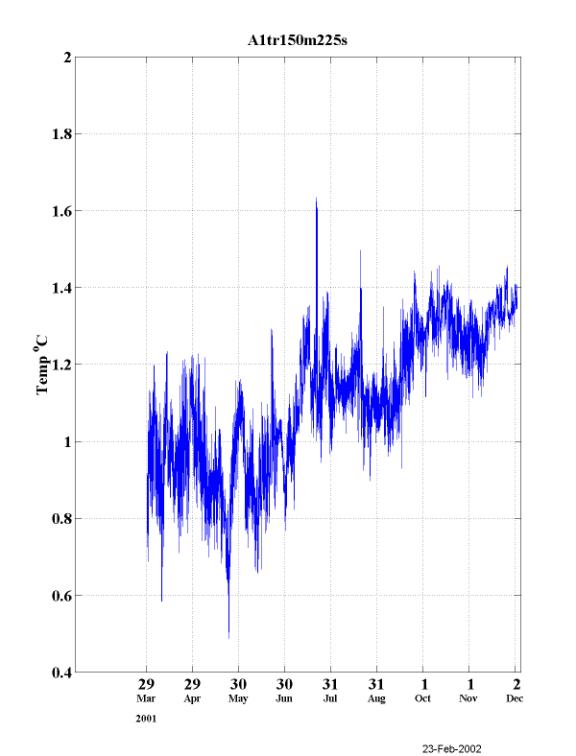
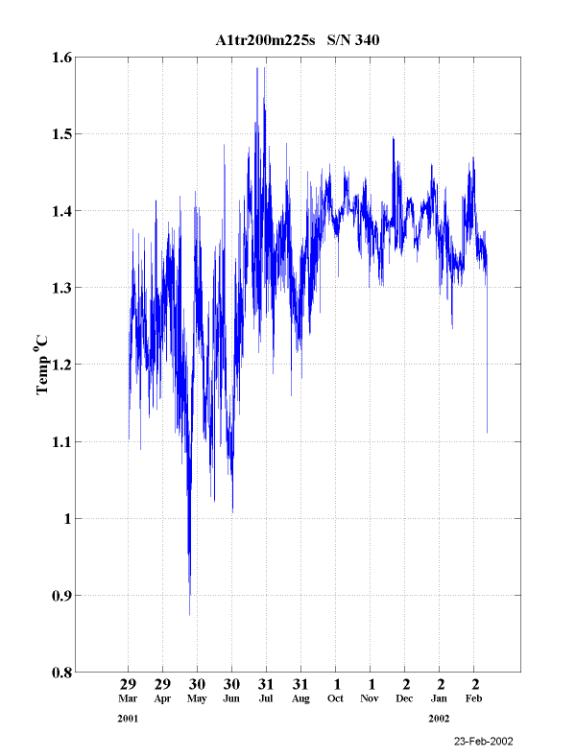
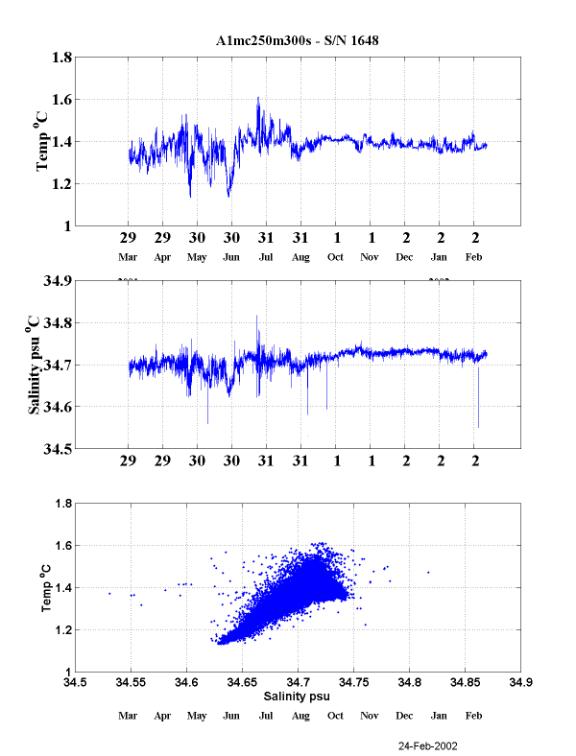
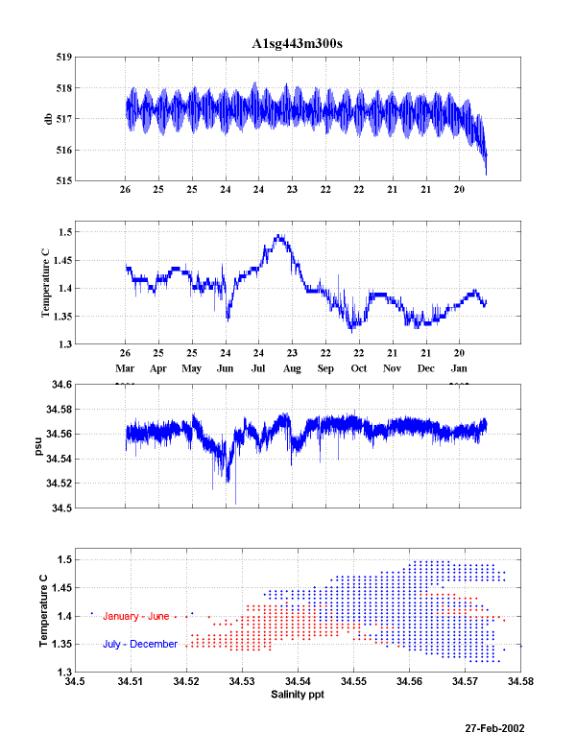
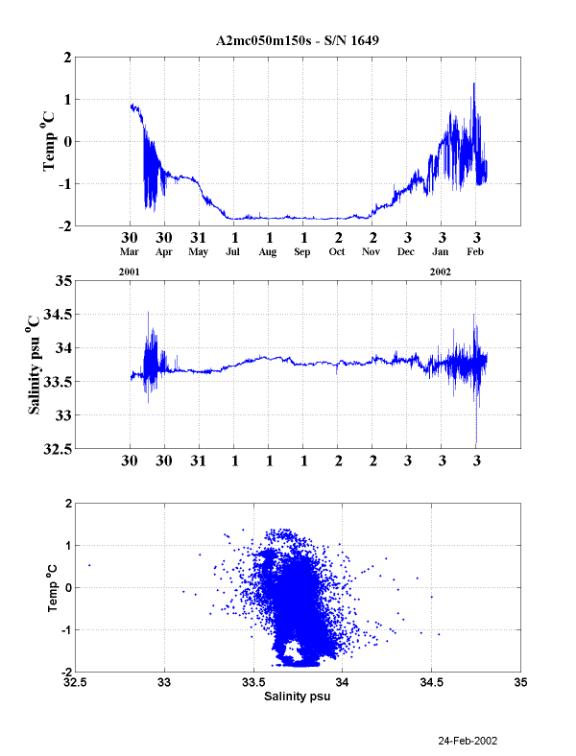
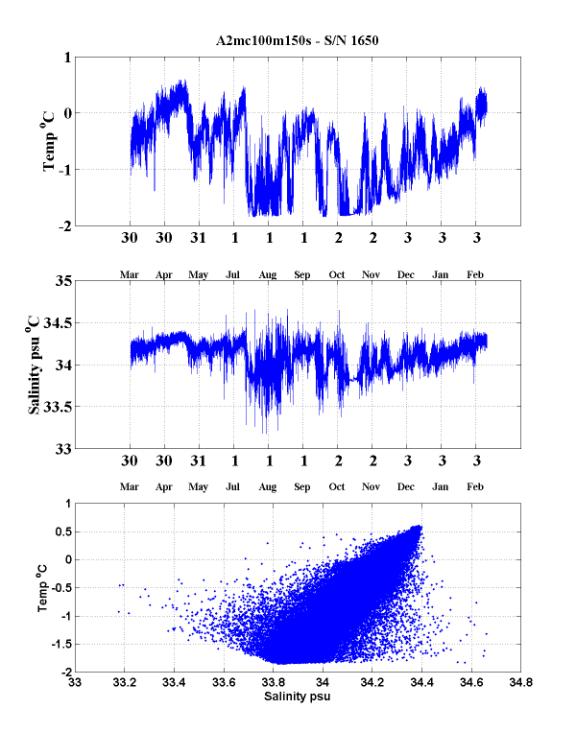
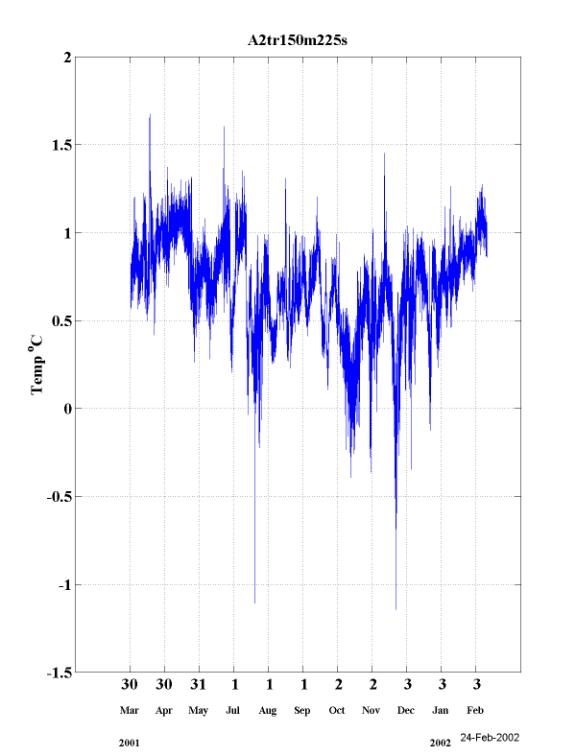
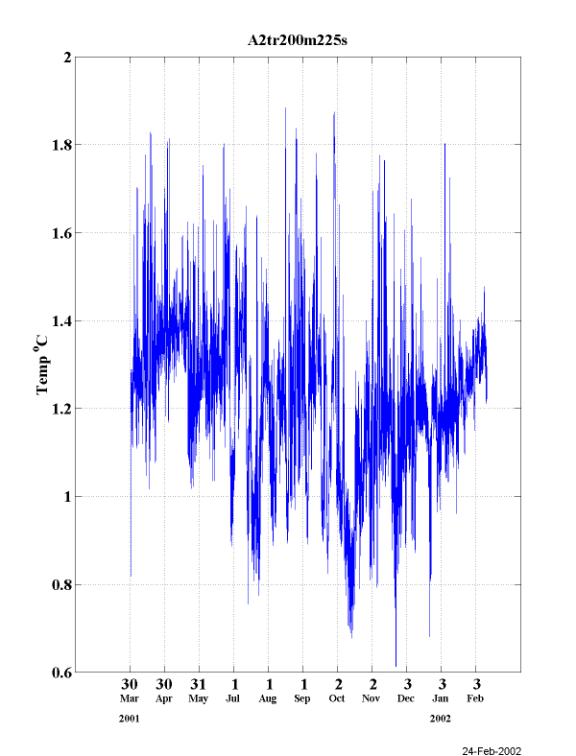
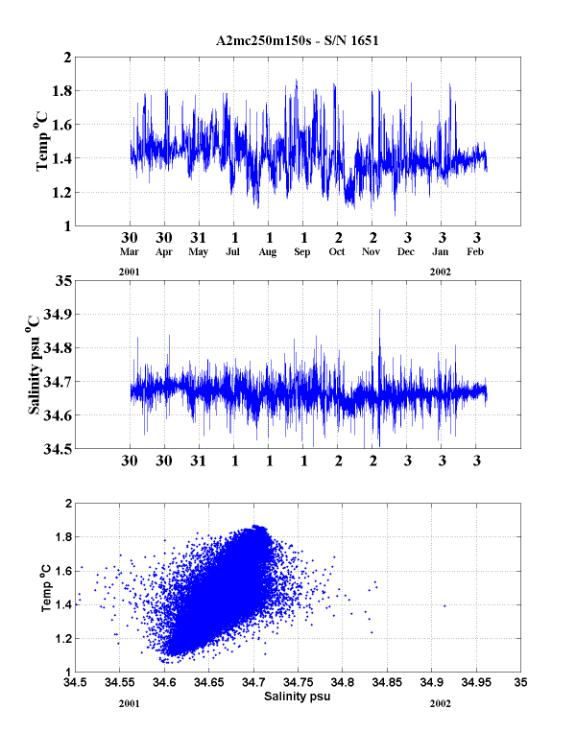
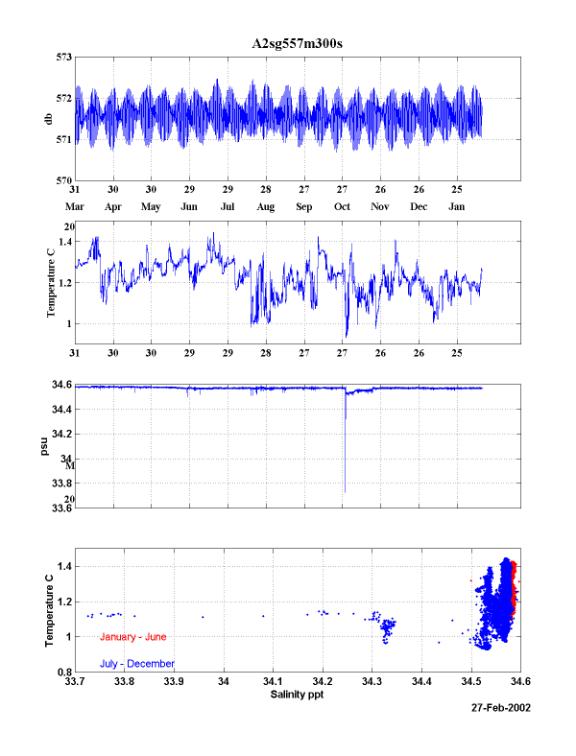
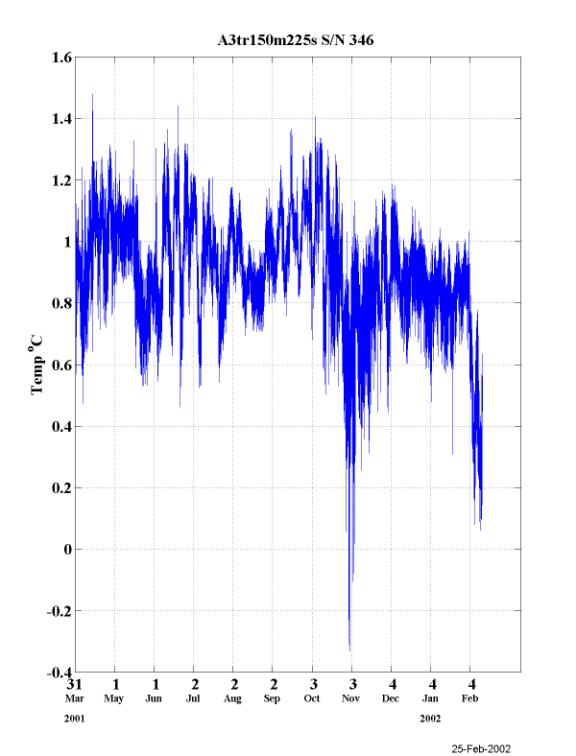
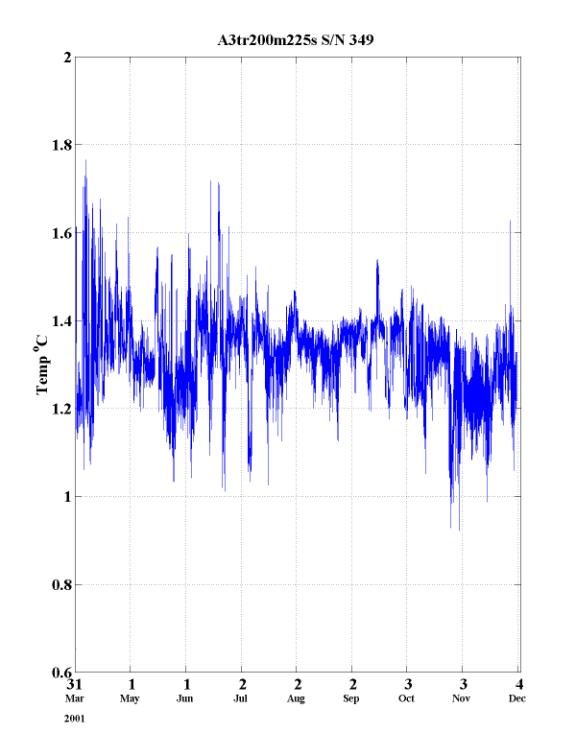
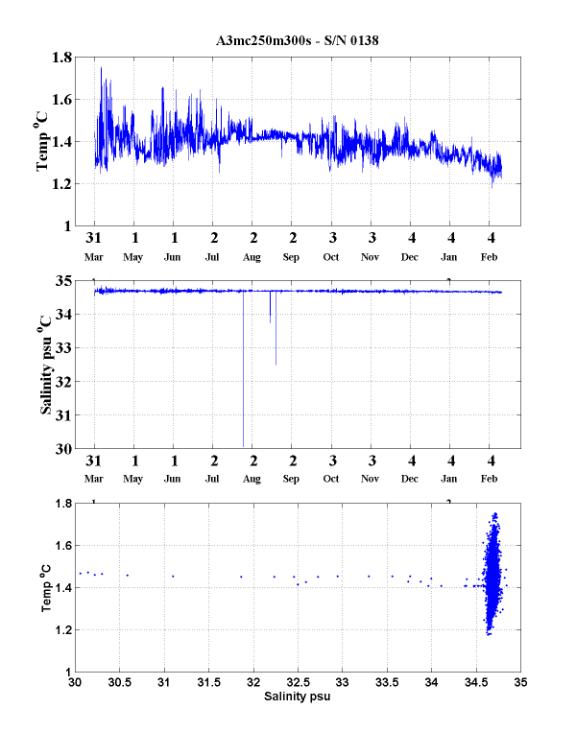
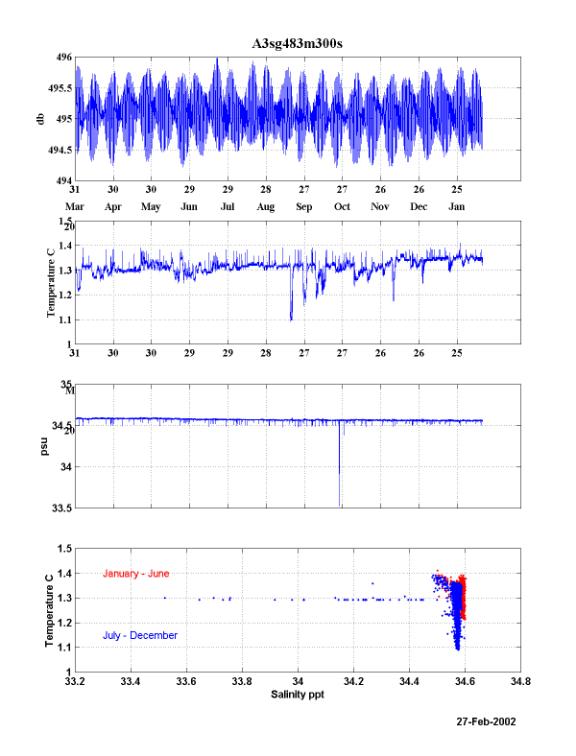
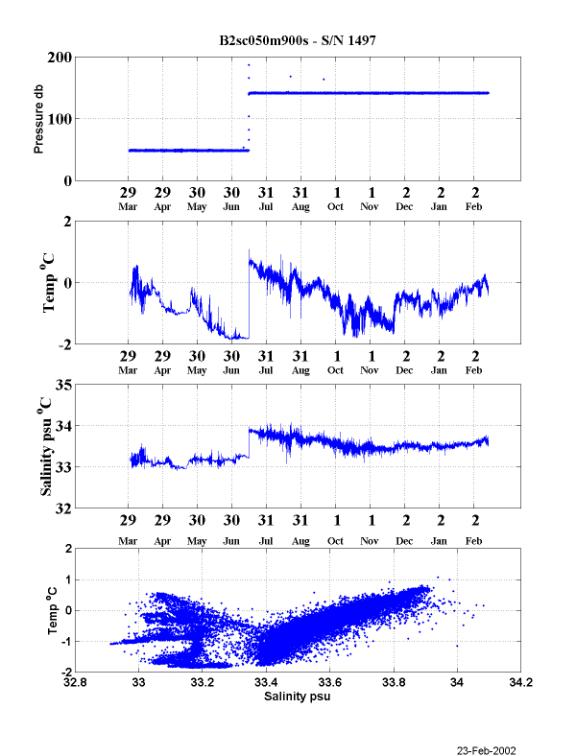
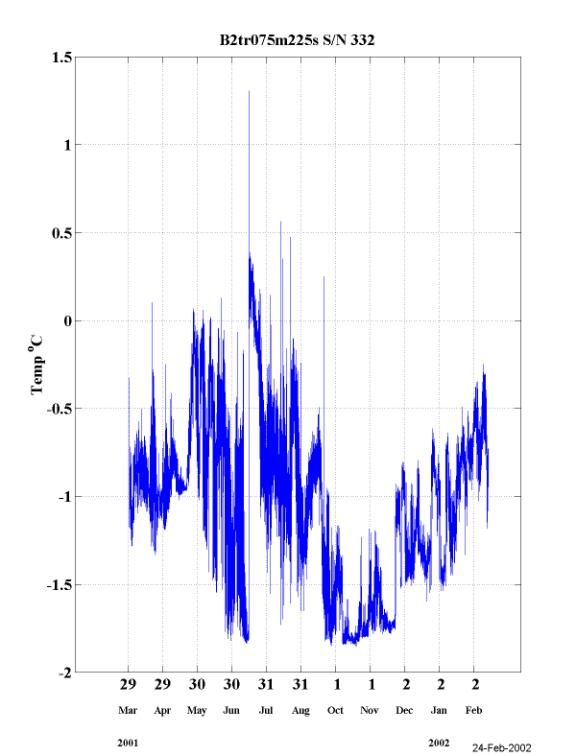
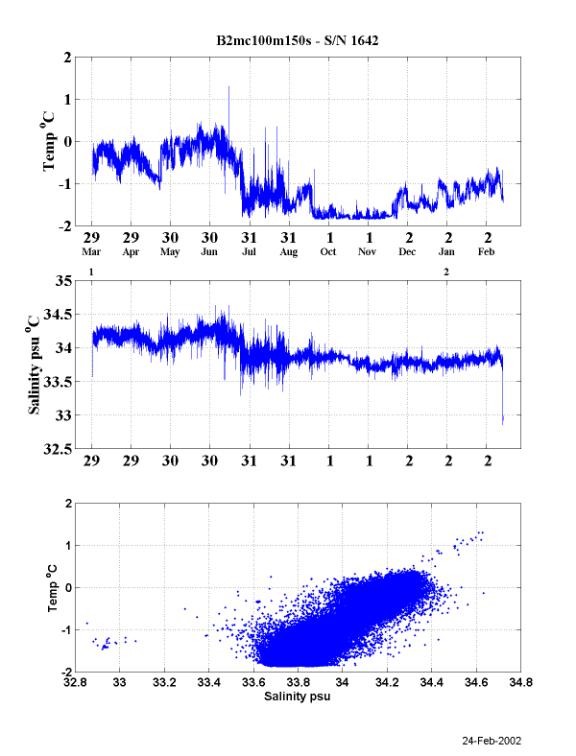
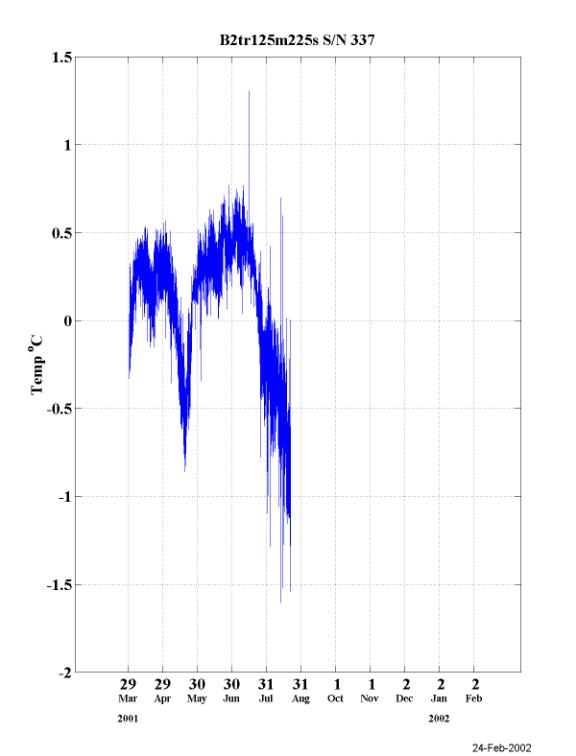
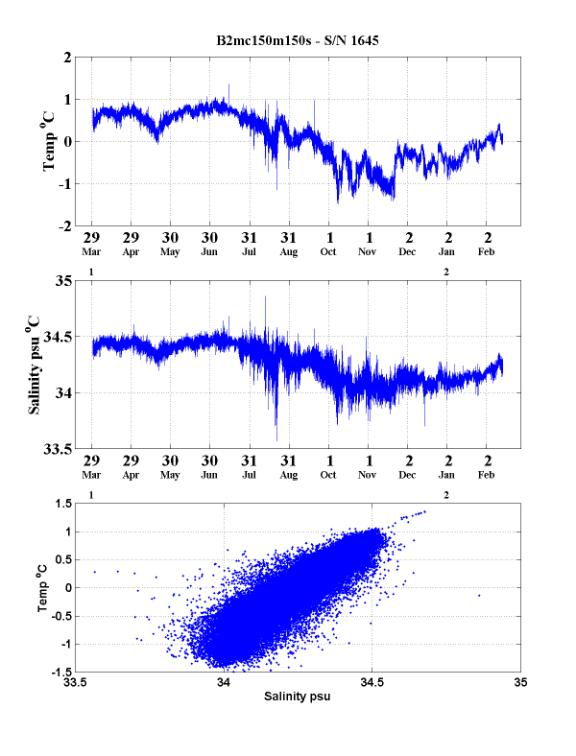
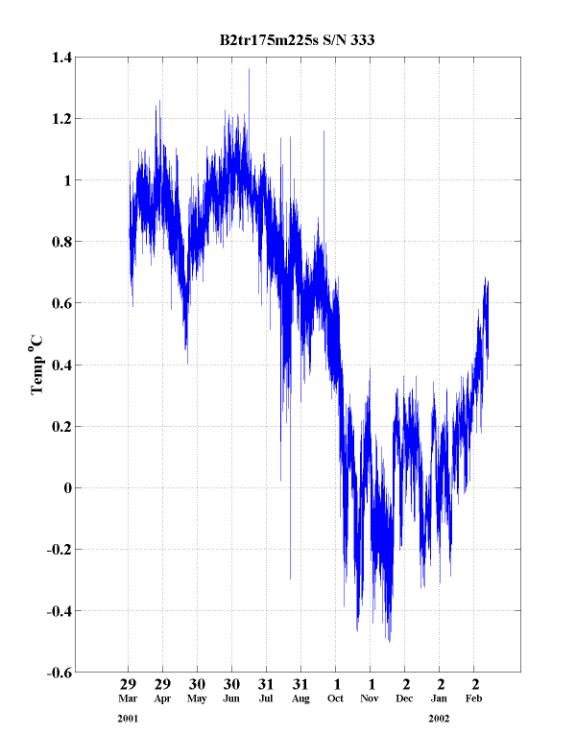
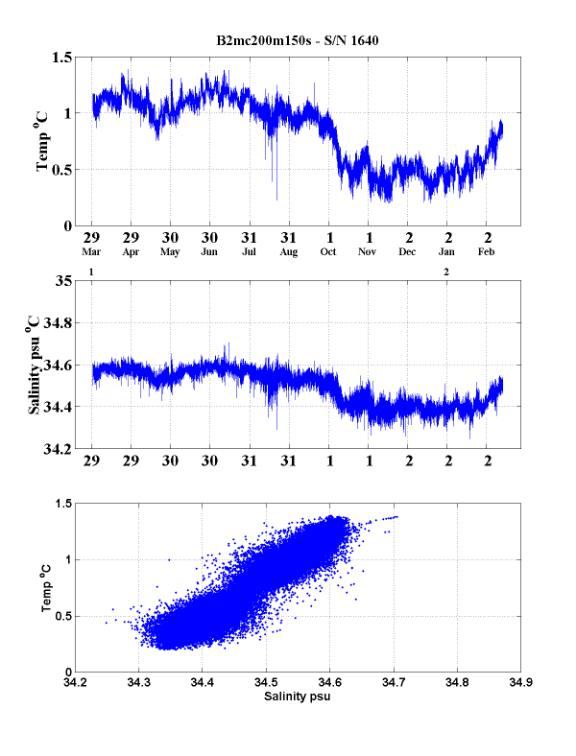
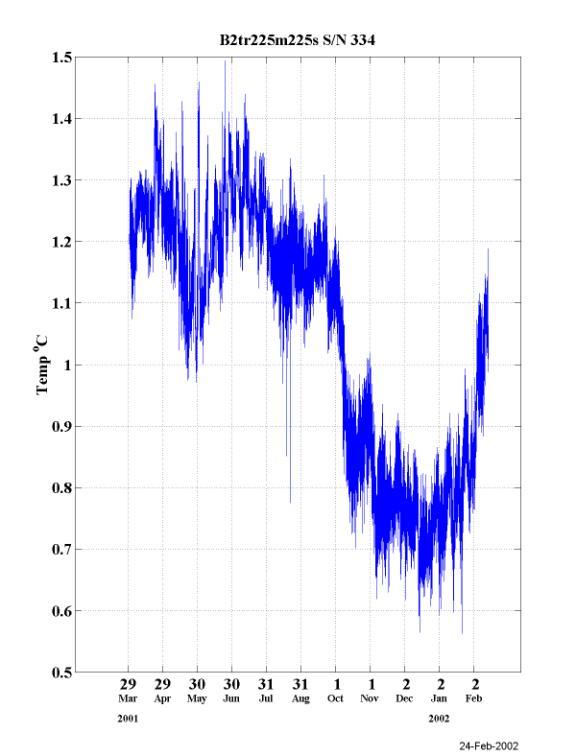
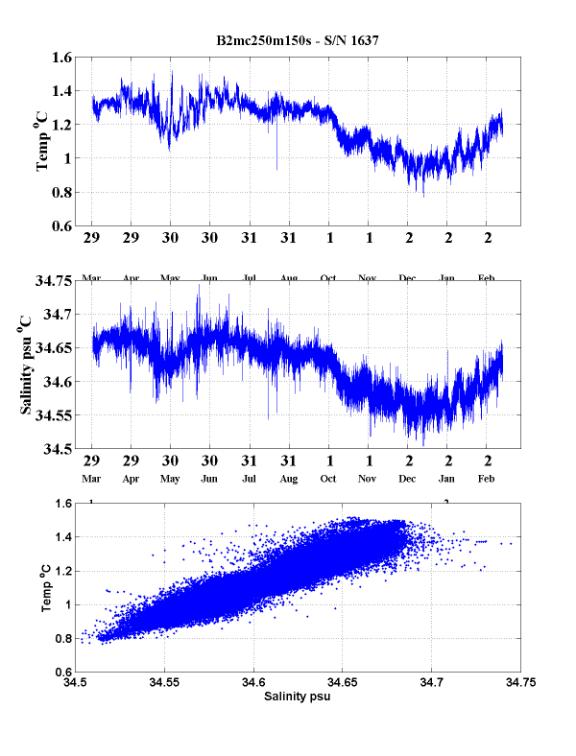
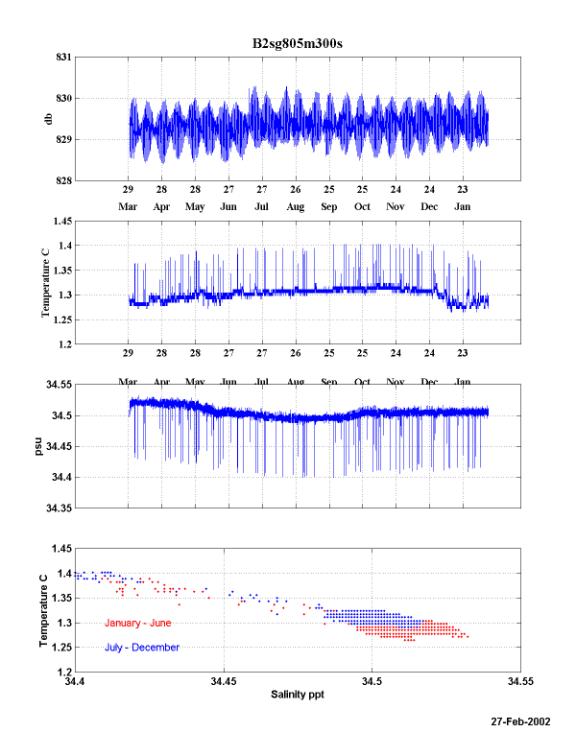
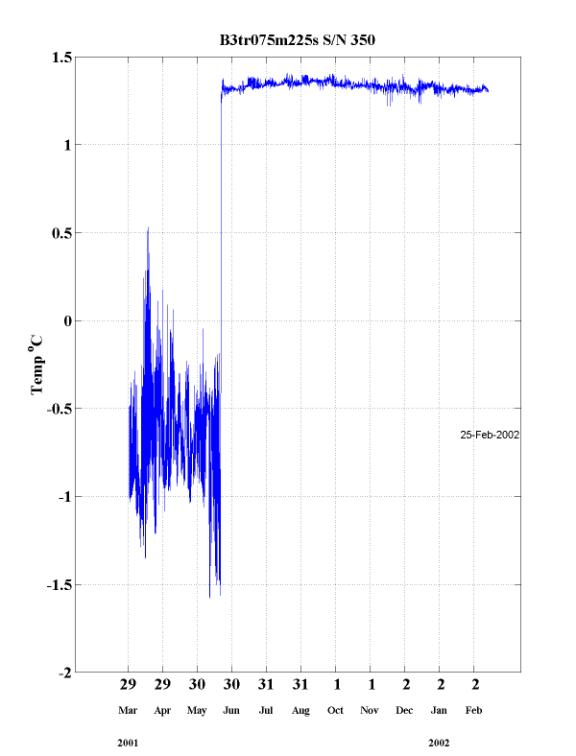
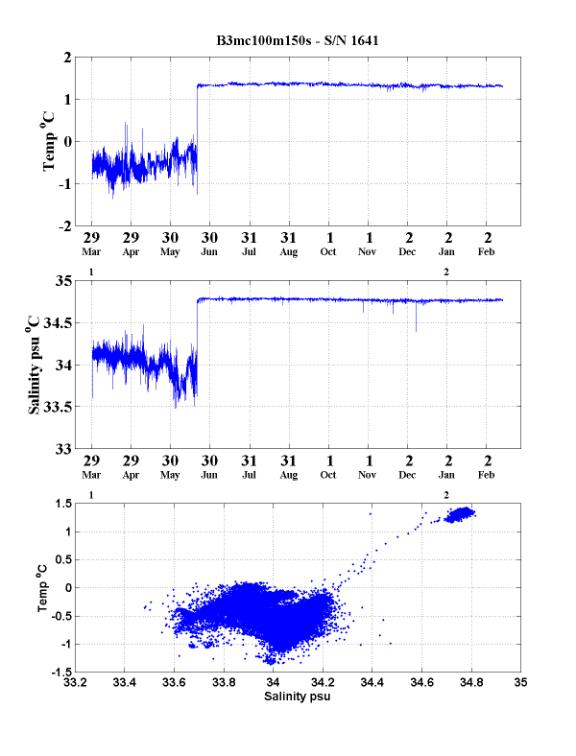
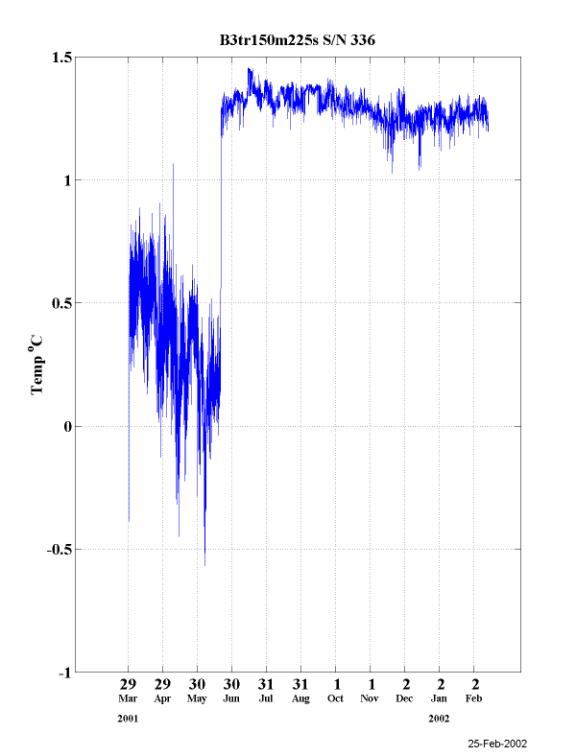
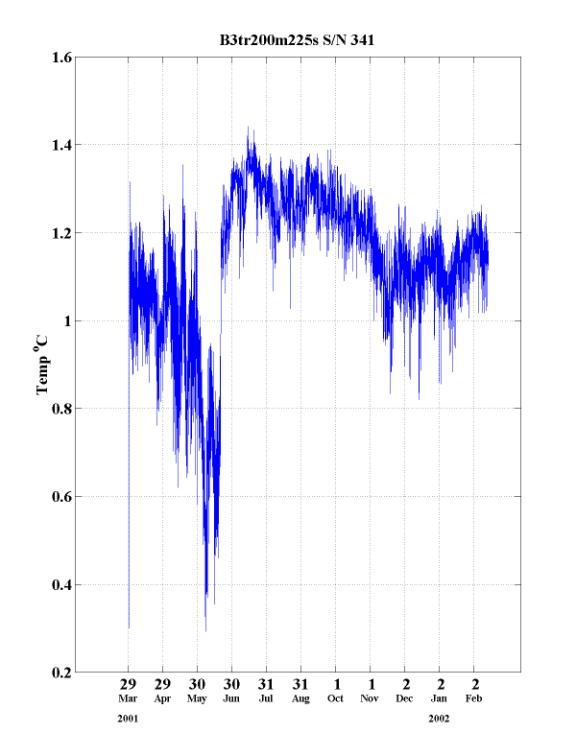

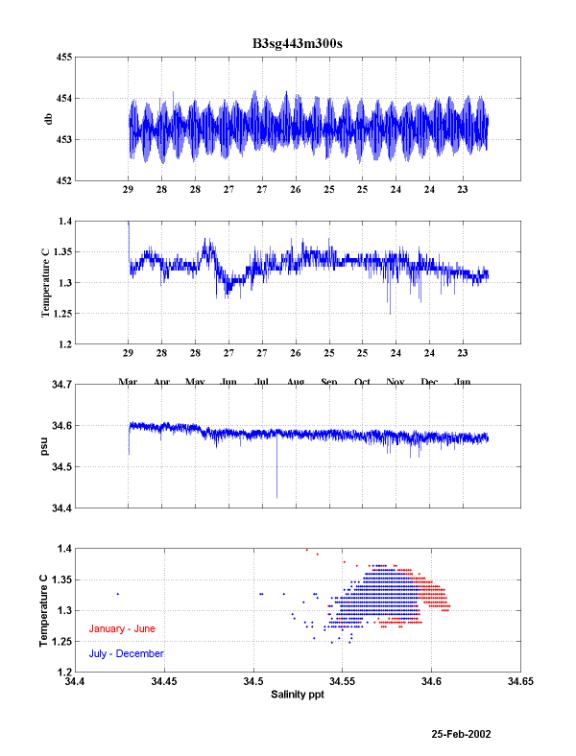
4.2
Moored
ADCP Data
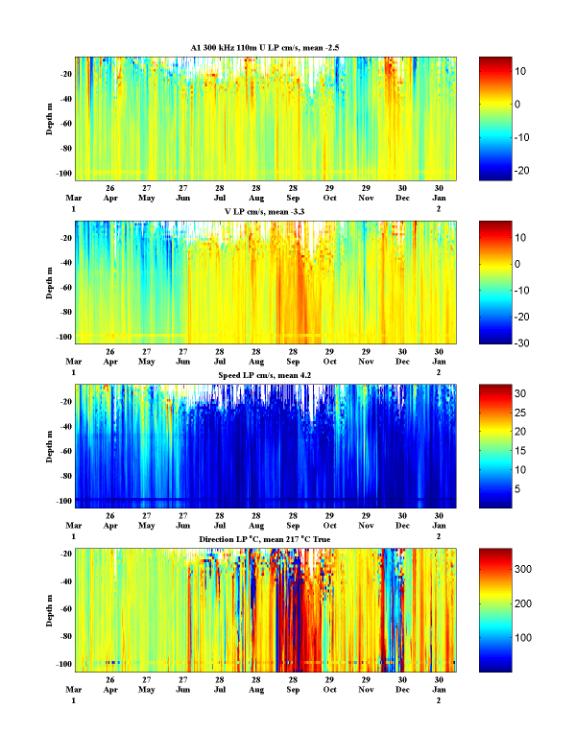
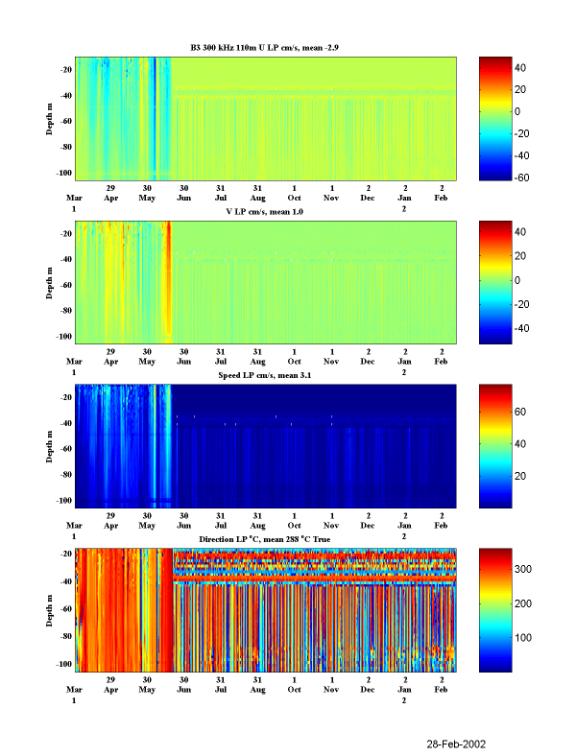
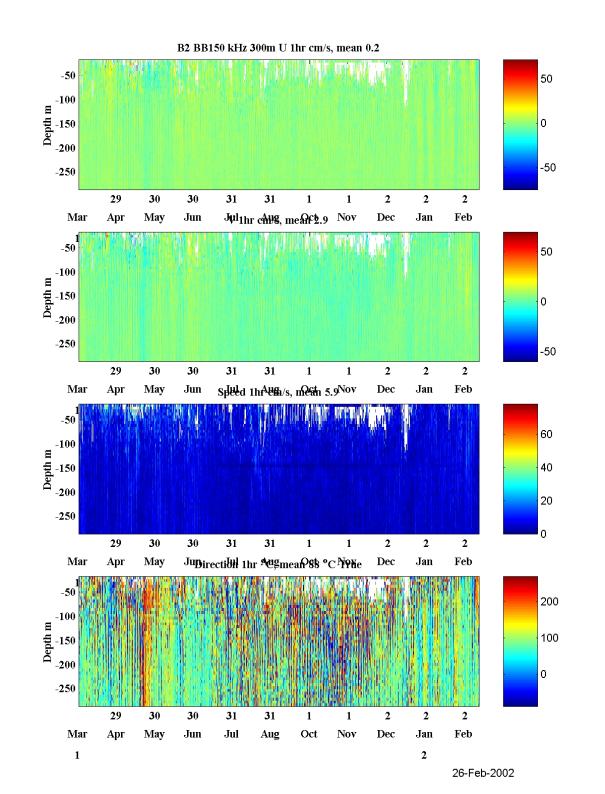
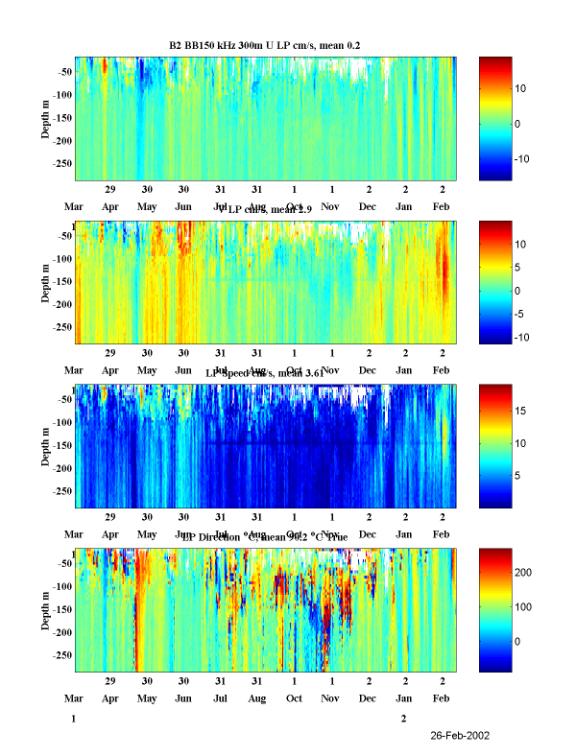
4.3
Acknowledgments
This data
report was prepared by Richard Limeburner and Bob Beardsley. We especially
thank Captain Robert Verret II and the officers and crew of the R/V Gould Cruise LMG02-1A for their
skill and superb assistance that allowed deployment of the moorings and
drifters under difficult weather conditions, observations of the marine
mammals, and completion of the hydrographic survey. Often the moorings were deployed
in heavy seas among icebergs and the ship’s officers were still able to
navigate the ship to specified mooring deployment sites.
Special thanks Randy Sliester of
Raytheon Polar Services (RPS) for coordinating the successful mooring
deployment/recovery operations. The successful mooring planning, design and
deployments were primarily due to the efforts of Scott Worrilow with assistance
from Ryan Schrawder and Jim Ryder. Thanks also to Andy Nunn, Josh Spilane, and Sarah Disick of RPS for helping on
deck and maintaining and operating the shipboard scientific equipment and
coordinating this instrumentation with the scientific party. Thanks to Andy
Nunn for helping with the CTD stations and mooring deployments. This research
effort is sponsored by the National Science Foundation, NSF research grant
OPP-99-10092. All data and results in this report are to be considered
preliminary.