Report of
R/V Laurence
M. Gould Cruise LMG03-02
to the
Western Antarctic Peninsula
12 February to 7 March 2003
United States Southern Ocean
Global Ocean Ecosystems Dynamics Program
Report Number 9
This cruise report was prepared by
Bob Beardsley, Richard Limeburner, Jason Hyatt, Irene Beardsley, John
Hildebrand, Mark MaDonald, Sean Wiggins, Sue Moore, Deb Thiele, and Deb
Glasgow.
Available from
U.S. Southern Ocean GLOBEC Planning Office
Center for Coastal Physical Oceanography
Crittenton Hall
Old Dominion University
Norfolk, VA 23529
Sponsored by Office of Polar Programs, National Science Foundation
 |
 |
Acknowledgments
We
especially want to thank Captain Robert Verret
II and the officers and crew of the R/V
Laurence M. Gould for their superb assistance in the recovery and
deployment of the Woods Hole Oceanographic Institution (WHOI) and Scripps
Institution of Oceanography (SIO) moorings during LMG03-02, and in the marine
mammal survey work. Some of the mooring
recoveries occurred in high wind and swell conditions, but the skill of the
Captain and mates to maneuver the ship to make the stern deck a safe and
efficient working area helped make these operations safe and quick.
Special
thanks to Skip Owen of Raytheon Polar Services (RPS) for coordinating the
various activities during the cruise and, in general, making the cruise run
smoothly. The WHOI mooring team was lead by Scott Worrilow with assistance from
Brian Hogue, Dick Limeburner, Jason Hyatt, and Zan Stine. Scott deserves great credit for the successful
recoveries made on this cruise. Irene Beardsley processed the JGOFS underway
data for the cruise and served as the official WHOI video recorder for the
cruise. The SIO mooring team was led by
John Hildebrand, with assistance from Sean Wiggins and Mark McDonald. Scott and Brian provided key help on deck
during the SIO recoveries and one deployment. They also deserve great credit
for the success of the bio-acoustics moorings. Skip, Jamee Johnson (RPS), and
Rick Lichtenham (RPS) were on deck for all mooring operations and provided
excellent support running the mooring winch, knuckle crane, A-frame, etc.,
while keeping an eye on safety. Deb Thiele and Deb Glasgow made up the International
Whaling Commission (IWC) marine mammal survey team. They got excellent support from the bridge during their surveys,
and Skip, Jamee, and Rick provided great Zodiac support during the whale
sighting and sampling work, and exploring Deception Island. In addition to his job as head cruise electronics
technician (ET), Andy Nunn (RPS) collected all the CTD and XBT data during the
cruise and provided processed data for our analysis. Andy and Todd Johnson (RPS) also oversaw the collection of
meteorological and underway data and jumped in to correct problems when they
arose. Last but not least, we greatly
appreciated the fine meals served on this cruise. The LMG is well known for its good cooks and excellent food, but
this cruise was the best yet.
During the
dragging operation for current meter mooring C1, the tension got high enough to
pull the Dush 6 winch off its stand.
Thanks to the deck lockdown maintained by Skip and his crew, no one was
hurt. Captain Robert, Skip, Jamee, Rick
and members of the ship's crew immediately got the tension off the winch and
worked hard and quickly to get the winch secured and deck ready so that we
could continue the cruise. Their
professionalism in this is greatly appreciated.
The WHOI
and SIO work conducted on this cruise is sponsored by the National Science
Foundation, NSF research grant OPP-99-10092 and OPP-99-10007, respectively. The marine mammal survey work is supported by
the IWC. All data and results in this
report are to be considered preliminary.
TABLEOF CONTENTS
1.0 Purpose
2.0 Accomplishment Summary
3.0 Mooring and Float Measurements
3.2 Moored Data Return
3.3 Hydrographic Data
3.3.2 CTD Data
4.2 Instrumentation
4.3 Data Acquisition and Processing
4.4 Description of Cruise Weather
4.5 Description of Surface Forcing
5.2 International Whaling Commission Cetacean Sighting and Biopsy Summary
7.0 Chief Scientist's Log of Daily Events
8.0 Cruise Personnel
Appendix A. Cruise Event Log
1.0 Purpose
The primary purpose of R/V Laurence M. Gould (LMG) cruise
LMG03-02 was to: (a) recover the Woods Hole Oceanographic Institution (WHOI)
array of three current meter moorings deployed in the mouth of Marguerite Bay in
February 2002; (b) recover the Scripps Institution of Oceanography (SIO) moored
array of seven whale acoustic recording packages (ARPs) deployed along the west
Antarctic Peninsula (WAP) in February 2002; (c) deploy four satellite-tracked
WHOI isobaric floats; and (d) conduct marine mammal surveys in the WAP study
area. A secondary purpose was to visit the two University of Wisconsin
Automated Weather Stations (AWSs) deployed on Dismal and Kirkwood Islands in
Marguerite Bay in 2001. This report summarizes the events that occurred during
cruise LMG03-02.
A
central hypothesis of the U.S. Southern Ocean GLOBEC (SO GLOBEC) collaborative
research program is that a unique combination of physical and biological
factors contributes to the enhanced growth, reproduction, recruitment and
survivorship of Antarctic krill (Euphausia
superba) on the central WAP shelf. In particular, it was thought that the
region in and near Marguerite Bay provides the following conditions that are
especially favorable to winter survival of larval and adult krill: (a) a
clockwise shelf circulation that retains the krill population in a favorable
environment for extended periods of time; (b) an early and long-lasting sea
ice cover that provides dependable food and protection for larval krill to grow
and survive over winter; and (c) on-shelf intrusions of warm, salty,
nutrient-rich Upper Circumpolar Deep Water which affects hydrographic and sea ice
properties and enhances biological production.
As part of the U.S. SO GLOBEC
program, a team of WHOI investigators deployed an array of six moorings (A1-3,
B1-3) in 2001 on LMG01-03 (see U.S. SO GLOBEC Report Number 1), recovered five
of these six moorings and set a new array of three moorings (C1-3) in the mouth
of Marguerite Bay in 2002 on LMG02-01A (see U.S. SO GLOBEC Report Number 4). The primary objective of these arrays is to
make direct measurements of the currents and water properties on vertical
scales of 10s of meters and time scales from a few minutes to seasonal. These subsurface moorings were designed to
record data continuously for one year, thus collecting data during the austral
winter when Marguerite Bay and much of WAP is ice covered. We plan to recover the C array on this final
SO GLOBEC mooring cruise. In addition
to these moored measurements, the WHOI team also deployed satellite-tracked
surface drifters in 2001 and 2002 and satellite-track isobaric floats in 2002
and on this cruise to investigate the near-surface and 250-m Lagrangian
currents. Supporting data on the
surface forcing (wind stress and heat flux) have also been obtained from the
AWSs in Marguerite Bay and surface data collected by the LMG and RVIB Nathaniel B. Palmer (NBP) on U.S. SO
GLOBEC cruises in the study area. This
combined physical data set will be used to describe the temporal and spatial
variability in shelf circulation and water properties and investigate the key
physical processes that make this region so highly productive and rich in
krill.
Other components of the U.S. SO
GLOBEC program have been designed to investigate the relationships between
krill and their predators, including marine mammals. The SIO team deployed an
array of eight acoustic recording packages (ARPs) in 2001 on LMG01-03 and
recovered seven of them and reset the seven in 2002 on LMG02-01A. The ARPs sit
on the bottom with a hydrophone suspended about 10 m above it and continuously
record sounds made by whales and other marine mammals within listening range
(many 10s of km). These data will be
used to identify the existence of different types of whales in the WAP area,
their spatial and temporal distribution, and some sense of their population
density. The SIO team plans to recover
their array on this cruise, and reset one ARP at the edge of the WAP shelf to
continue the measurements for a third year. The SIO moored array effort has
been augmented by a visual marine mammal survey conducted during the cruise by
two International Whaling Commission (IWC) observers and the deployment of
sonobuoys to identify the presence of whales during the IWC survey and
hopefully collect simultaneous acoustic and visual data on the same whale. The
IWC observers also plan to collect tissue samples (skin and blubber) from
whales for studies of whale genetics and environmental pollution.
2.0 Accomplishment Summary
After
conducting an Acoustic Doppler Current Profiler (ADCP) transect across Drake
Passage and deploying NOAA surface drifters at 59ﺍ and 60ﺍS, the LMG arrived at the first SIO mooring S1A on 16
February 2003. Conditions were too
rough to attempt recovering S1A and the LMG continued to Palmer Station,
arriving 17 February. After a quick 8-hour
turnaround, the LMG headed northwest to pick up S2A, however, it was again too
rough to work, so the LMG steamed back across the shelf to S7A. Here conditions had improved and S7A was
quickly recovered. The LMG then
returned to S2A, found conditions had improved and recovered this ARP. The LMG then steamed southwest along the shelf
break, recovering S4A, S5A and S6A along the track. The LMG then turned into the mouth of Marguerite Bay and quickly
recovered the WHOI C3 and C2 moorings, deploying an isobaric float at C2. The C1 mooring acoustic release would not
release, so a drag line was set and pulled around the mooring, cutting the
mooring line near the bottom on the first pass. A second drag was attempted for the C1 bottom segment with no
success. With good conditions, the LMG
headed south for the sea ice edge off Alexander Island and spent a day
observing groups of whales in the mouth of George VI Sound. The LMG then
steamed north, making a conductivity-temperature-depth (CTD) cast in the
deepest point of George VI Sound, and deployed the three remaining WHOI
isobaric floats before returning to C1 to continue dragging for the C1 bottom
segment. The Dush 6 (Markey) winch was pulled from its stand on the second
drag, halting all dragging and leaving the bottom of C1 still in place. Once
the winch was secured and decked cleaned, the LMG headed north through the
inner passage east of Adelaide Island watching for whales and other marine
animals. The ship found solid sea ice with very few leads in Tickle Channel
with more than 100 seals and many penguins hauled out on the ice. When the ship
reached open water off Weertman Island in Hanusse Bay, many humpback whales
were found. Both Zodiacs were deployed and we spent several wonderful hours
observing a wide variety of whale behavior and collecting tissue samples. After returning the winch to its stand and
making it fast in Port Lockroy, the LMG steamed north to S1A. Conditions were
workable, and S1A was recovered and S1B deployed. The LMG then headed for
Deception Island, where Zodiacs were deployed to explore the inner bay and
visit the Spanish base, Gabriel de Castilla, and an old whaling station. The LMG returned to Palmer Station on 2
March. Due to the need to recover and
reset S1 before returning to Palmer Station, we cut short our stay in
Marguerite Bay and did not attempt to visit the AWSs.
With the exception of the C1
bottom part, all the SIO and WHOI moorings were successfully recovered, and a
new SIO mooring S1B was deployed at the S1 site to continue recording whale
calls for a third consecutive year. Preliminary analysis suggests that almost
all of the WHOI and SIO instrumentation worked successfully, recording data for
the 2002-2003 deployment period.
Marine mammal surveys were conducted during daylight hours on much of the
cruise, with concentrated periods spent at the head of George VI Sound off
Alexander Island and in Hanusse Bay just north of Tickle Channel. Many humpback and some minke, sei, and
killer whales were seen and photographed. A total of 180 sightings were made,
corresponding to a total of 520 individual cetaceans.
The cruise track for LMG03-02 is shown in Figure 1, and the mooring recovery and deployment and drifter and float launch positions are listed in Table 1.
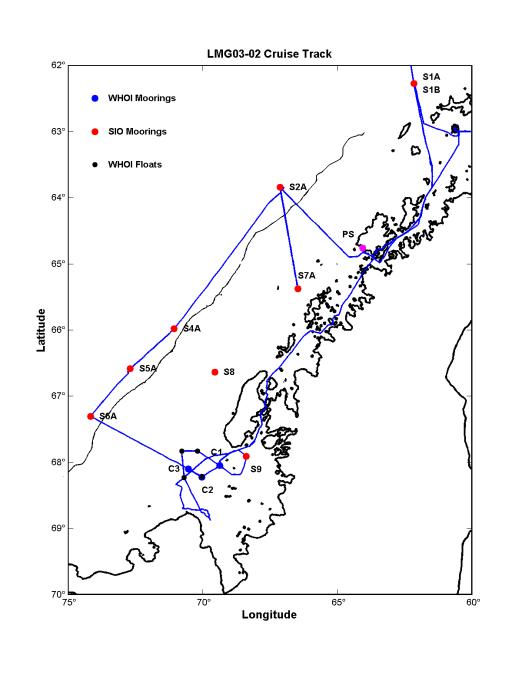
Figure 1. Cruise track for LMG03-02 from Palmer Station (17 February) to Palmer Station (2 March). The blue dots show the positions of the three WHOI C moorings recovered on this cruise, the red dots the seven SIO moorings recovered on this cruise, and the black dots the four WHOI isobaric floats deployed on this cruise. A new SIO mooring S1B was deployed where S1A was recovered.
| Station | Date | Time UTC | Latitude | Longitude | Depth |
|---|---|---|---|---|---|
|
Deploy Drifter 39653 |
2/15/03 |
1048 |
59ﺍ 00.70' S |
63ﺍ 29.72' W |
-- |
|
Deploy Drifter 39654 |
2/15/03 |
1643 |
59ﺍ 59.99' S |
63ﺍ 06.34' W |
-- |
|
Recover S7A |
2/18/03 |
1957 |
65ﺍ 22.620' S |
66ﺍ 28.150' W |
470 |
|
Recover S2A |
2/19/03 |
0730 |
63ﺍ 50.460' S |
67ﺍ 07.840' W |
3047 |
|
Recover S4A |
2/20/03 |
0941 |
65ﺍ 58.730' S |
71ﺍ 03.640' W |
2944 |
|
Recover S5A |
2/20/03 |
2037 |
66ﺍ 34.990' S |
72ﺍ 41.430' W |
3421 |
|
Recover S6A |
2/21/03 |
0717 |
67ﺍ 18.250' S |
74ﺍ 10.150' W |
3099 |
|
CTD 1 (C3) |
2/21/03 |
2036 |
68ﺍ 06.149' S |
70ﺍ 31.242' W |
820 |
|
Recover C3 |
2/21/03 |
2144 |
68ﺍ 06.006' S |
70ﺍ 31.799' W |
815 |
|
Recover C2 |
2/22/03 |
0934 |
68ﺍ 13.331' S |
70ﺍ 01.730' W |
850 |
|
CTD 2 (C2) |
2/22/03 |
1233 |
68ﺍ 13.130' S |
70ﺍ 01.188' W |
826 |
|
Deploy Float 193 |
2/22/03 |
1306 |
68ﺍ 13.210' S |
70ﺍ 01.620' W |
826 |
|
CTD 3 (C1) |
2/22/03 |
1631 |
68ﺍ 03.274' S |
69ﺍ 21.166' W |
463 |
|
Recover S9 |
2/22/03 |
2220 |
67ﺍ 54.499' S |
68ﺍ 23.003' W |
687 |
|
Recover C1 (top) |
2/23/03 |
1314 |
68ﺍ 02.940' S |
69ﺍ 21.790' W |
430 |
|
CTD 4 (GS) |
2/24/03 |
2227 |
68ﺍ 45.072' S |
70ﺍ 03.203' W |
1587 |
|
Deploy Float 183 |
2/25/03 |
0300 |
68ﺍ 13.69' S |
70ﺍ 41.33' W |
765 |
|
Deploy Float 182 |
2/25/03 |
0548 |
67ﺍ 49.88' S |
70ﺍ 46.81' W |
560 |
|
Deploy Float 181 |
2/25/03 |
0723 |
67ﺍ 49.79' S |
70ﺍ 11.45' W |
670 |
|
Recover S1A |
2/28/03 |
1730 |
62ﺍ 16.420' S |
62ﺍ 10.040' W |
1658 |
|
Deploy S1B |
2/28/03 |
1920 |
62ﺍ 16.420' S |
62ﺍ 10.040' W |
1658 |
Table 1. LMG03-02
mooring, float, drifter, and CTD station locations. Notes: (1) Time for mooring recovery is when the
first release command was sent. (2)
Time and position for CTD is time and position when the sensor package reaches
the bottom of the cast. Depth is the reading when the sensor package is at
bottom. (3) Float time and position
when float was released. (4) Time for S1B mooring deployment is when the
instrument was launched.
3.0 Mooring and Float Measurements
3.1 Mooring Operations
A primary objective of LMG03-02 was to recover the 3
WHOI current meter moorings and the 7 SIO ARP moorings deployed last year on
LMG02-01A and to redeploy 1 ARP at S1.
To do this, the cruise track was designed with the following sequence of
mooring operations: 1) recover S1A on the southward transit to Palmer Station; 2)
steam northwest from Palmer Station to recover S2A, then back across the shelf
to get S7A, then steam south along the shelf break and recover S4A, S5A, and
S6A; 3) steam into Marguerite Bay and recover WHOI C3, C2, and C1 and SIO S9,
completing all SIO and WHOI mooring recoveries. We would then spend the rest of the cruise doing marine mammal
work in Marguerite Bay before returning to Palmer Station. One of the recovered SIO ARPs would be
refurbished and deployed at the S1 site on the northbound transit to Punta
Arenas.
Overall,
we followed this sequence during the cruise with several modifications. It was too rough to recover S1A on our
southbound transit to Palmer Station.
It was also too rough to recover S2A just after leaving Palmer
Station. As the weather and seas
improved on the run from S2A to S7A, S7A was quickly recovered. We then returned to S2A where conditions
were also much improved and recovered it before steaming south to pick up S4A,
S5A, and S6A. Conditions continued to
be good in Marguerite Bay and the C3, C2, and S9 moorings were quickly
recovered. The C1 release would
communicate but not activate the release, so dragging was done and most of the
mooring was safely recovered on the first drag. A second drag that day was unsuccessful. After spending the next day doing marine
mammal work in the head of George VI Sound, we spent most of the next day
dragging for the bottom of C1. During
the second drag, the Dush 6 winch was pulled off its stand at a maximum tension
of 14,283 pounds. To release tension on
the winch, the drag wire was cut, and the winch secured in place with chain.
The C1 bottom part (with a VACM, SeaGuage and EdgeTech acoustic release) was
left standing with the release disabled.
The SIO and IWC group decided that recovering S1A before returning to
Palmer Station (so they would not be totally dependent on having good working
conditions on the final northbound transit from Palmer to Punta Arena) was
their highest priority, so we headed north through the inner passage, got the
winch repositioned and better secured, then steamed north to S1A for the
recovery and deployment of its replacement S1B. This completed all the mooring work for the cruise. A more detailed description of the mooring
operations is given in the Chief Scientist's Cruise Narrative (Section 6). The positions, time and water depth of all
mooring recoveries and deployment are listed in Table 1.
The success of the mooring operations on LMG03-02 was
again due to the combination of the RPS mooring winch, knuckle crane, and stern
A-frame with highly skilled personnel on deck and excellent ship handling by
Captain Robert. The bridge watch helped
significantly with the mooring approaches and spotting the moorings once they
had surfaced.
3.2 Moored Data Return
The three WHOI current moorings were deployed during
LMG02-1A in a L-shaped array in the mouth of Marguerite Bay. The C1 mooring was set to the east of the B1
mooring site, where the B1 mooring was lost presumably due to ice bergs. The C3
mooring was set at the B2 mooring site, thinking that since B2 survived its
one-year deployment, the new C3 might also and thus provide a two-year record
at this location. The C2 mooring was
deployed to the southeast of C3, near the axis of George VI Sound trench that
cuts northwest across the shelf. Except
for the C1 bottom VACM, SeaGauge and release, the rest of C1 and all of C2 and
C3 were safely recovered. The top floats on C2 and C3 looked clean and undamaged. The C1 top float had a shallow dent near its
top and the ARGOS beacon was flooded.
This suggests that the C1 mooring may have been hit by an iceberg.
A preliminary summary of the
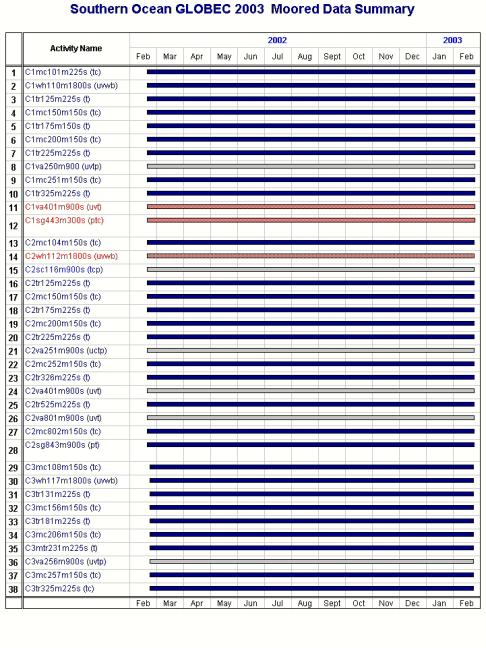
data return from the different instruments is given in Table 2. All VACMs wrote
full data tapes. With the exception of
the C2 ADCP (which was flooded), the other ADCPs and Sea-Bird instruments
returned good data. The C2 ADCP memory
chip has been extracted and cleaned, and an attempt will be made to read it
after we return to WHOI.
3.3 Hydrographic Data
Hydrographic data were collected during LMG03-02 using two approaches. Expendable Bathythermographs (XBTs) were dropped at most of the SIO mooring sites just after the ARP was recovered. These data will provide an accurate sound speed profile to be used to check the performance of the ARP and help in processing the acoustic data. A total of four CTD casts were made, one at each of the three WHOI moorings and one in the deep trench (George VI Sound) in Marguerite Bay. A brief description of the CTD, its operation, and the processed data will be given next. The XBT and CTD data are included in the cruise data CD.
Table 2. Moored data summary showing good data (blue), unprocessed data (gray), and lost data (red).
The ship's CTD system consisted of a Sea-Bird Electronics Model 9+ CTD sampling at 24 Hz with a DigiQuartz quartz crystal pressure transducer (serial number 53952), a primary pair of Sea-Bird temperature (1542) and conductivity (1223) sensors, a secondary pair of Sea-Bird temperature (2205) and conductivity (1200), a Chelsea Mk III Aquatracka fluorimeter (088015), and a WET Labs light transmissometer (CST-248DR). A Sea-Bird model 43 dissolved oxygen sensor (0200) was added to the primary temperature/conductivity system for the last cast.
The CTD sensor package
was lowered at between 20-40 m min-1 and the data logged using a Sea-Bird 11Plus
deck unit and Sea-bird Win32 SeaSave software. The CTD data was averaged into
1-m bins and the averaged downcast data are presented in this report. Andy Nunn collected and processed all the
CTD data, Jason Hyatt did final processing and plotting, and Jason collected
water samples at each cast. Irene
Beardsley, Jason, and Zan Stine determined the sample salinities using the
ship's Guildline AutoSal salinometer.
3.3.1 Calibration
Water samples were taken with Niskin bottles on the upcast to help check the performance of the CTD conductivity sensors. Two separate bottles were fired at each measurement depth to provide additional samples to test both the CTD and AutoSal precision. For each water sample, the bottle conductivities were computed using the AutoSal-measured salinity and the CTD pressure and primary and secondary conductivities and temperatures recorded when the bottle was closed. A total of 44 water samples were taken and processed, seven were discarded as bad AutoSal readings or clear outliers, and the remaining 37 bottle conductivities used to compare with the CTD values.
Figure 3 shows a comparison of the primary and secondary temperatures (top panel), conductivities (second panel), and salinities (third panel) for all 44 bottle samples, followed by comparisons of the bottle and primary conductivities (forth panel) and bottle and secondary conductivities (bottom panel). The primary (T0) and secondary (T1) temperatures exhibit a consistent and very small (-0.0013 ﺎ 0.0002ﺍC) offset, with T1 reading higher. The difference in primary (C0) and secondary (C1) conductivities shows a small shift after the first CTD cast (samples 1-8). The C0-C1 difference was about 0.0007 mS cm-1 for CTD cast 1, then increased to 0.0039 ﺎ 0.0005 mS cm-1 for the rest of the CTD casts. This shift in conductivity mirrors the shift in the primary (S0) and secondary (S1) salinity difference, which increased from 0.0029 psu to 0.0067 ﺎ 0.0008 psu for the last three CTD casts. The bottle-CTD conductivity comparisons show a consistent pattern with a very small mean difference (0.0001 mS cm-1) between bottle and primary sensor and a larger mean difference of -0.0044 ﺎ 0.0010 mS cm-1 between bottle and secondary conductivity sensor. Taken together, these comparisons indicate that the secondary conductivity sensor shifted to lower values relative to the primary sensor after the first CTD cast. Averaged over all four CTD casts, the secondary sensor read -0.0044 ﺎ 0.0010 mS cm-1 less than the bottle conductivity. What caused this relatively small shift is not clear. For detailed scientific analysis, the primary sensor data set should be used. After this cruise, the primary and secondary sensor sets will be returned to Sea Bird to check their calibrations.
3.3.2 CTD Data
Plots of temperature, salinity, density, buoyancy
frequency, fluorescence, and temperature-salinity (TS) correlation are shown
next in Figures 4-7 for the four CTD casts made during LMG03-02. Dissolved oxygen and sound speed are also
plotted for the last station. The units
used are oC, psu, kg m-3, l s-1, volts, %, ml l-1,
m s-1, and potential temperature oC versus psu. A
composite TS diagram for all four stations is shown in Figure 8.
A total of four CTD casts were taken, three corresponding to one at each WHOI mooring site, and one in the deep George VI Sound just off Alexander Island. The stations are numbered in the order taken, and match (in order 1-4) C3, C2, C1 and the deep trench. For the first three casts, the CTD sensor package measured primary and secondary temperature and conductivity, fluorescence, transmittance and pressure. For the final cast to deep water, the Seabird SBE43 oxygen sensor was added in order to assess the age of the water in the deep trench and possible isolation from off-shelf waters. The deep cast went to a pressure of 1609 db, within about 10 meters of the bottom. This location was chosen as the deepest position in George VI Sound based on T. Bolmer's 15-second composite digital bathymetry for this region.
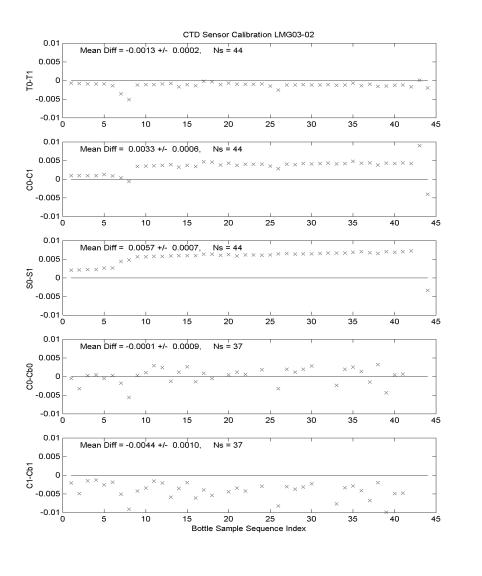
Figure
3.
Differences between CTD primary and secondary temperatures (top panel),
conductivities (second panel), derived salinities (third panel), and in-situ
water sample conductivities and CTD primary (forth panel), and CTD secondary
(bottom panel) conductivities versus
bottle sample sequence number.
The CTD profiles at C1, C2 and C3 are similar, showing a warm and fresh surface layer above a remnant of cold winter water (T less than -1ﺍC) centered at a depth of about 100 m. Beneath this cold layer, the water warms and becomes more salty in the main thermocline and halocline down to about 300 m, with little change in temperature and salinity deeper to the bottom. The surface layer is warmer at C2 and C1 than at C3, but cooler in the Winter Water in comparison to C3. The bottom water at C1 (depth 461 db) is not as dense as at the two deeper C2 (826 db) and C3 (822 db) stations. The winter water at these three stations is roughly 0.5ﺍC warmer than the freezing line, evidence of significant warming since the end of winter.
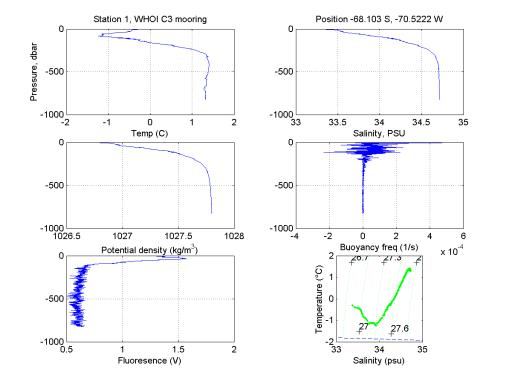
Figure 4. CTD 1 profile data at WHOI mooring site C3.
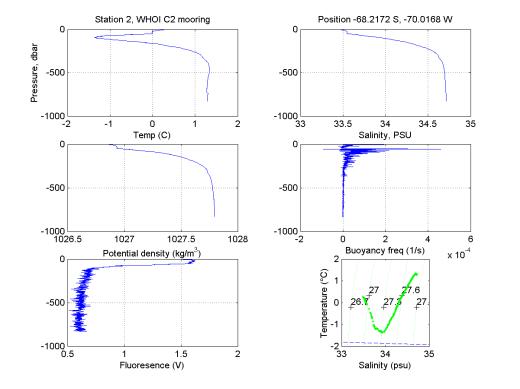
Figure 5. CTD 2 profile data at WHOI mooring site C2.
The CTD profiles in George VI Sound are quite different from those at CTD stations 1-3. This station was taken near and in sea ice so that CTD 4 has a very cold fresh surface layer that warms and becomes more saline monotonically with increasing depth to the base of the main thermocline/halocline near 300-400 m. The deeper water continues to warm and become saline very slowly with depth to nearly the bottom (1609 db). The densest bottom water is found at C1 and C2, slightly denser that at the bottom (some 760 m deeper in the water column) in George VI Sound. The TS curve in George VI Sound is straight in the main thermocline to very close to the bottom, suggesting that significant mixing has occurred since water left the mid-shelf near the C moorings to enter George VI Sound. The dissolved oxygen profile shows an oxygen minimum near 400 m, with a slight increase with increasing depth. The Sea Bird dissolved oxygen sensor does not work well in such cold waters, but used here for just a qualitative comparison, it should provide good data. The profile does not show any decrease in dissolved oxygen in the bottom 600 m in George VI Sound, suggesting that the bottom waters are not stagnant, and must be replaced frequently enough to provide a drawdown in dissolved oxygen.
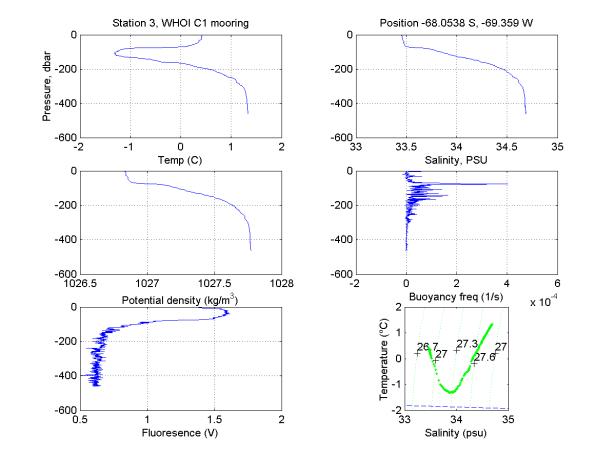
Figure 6. CTD 3 profile data at WHOI mooring site C1.
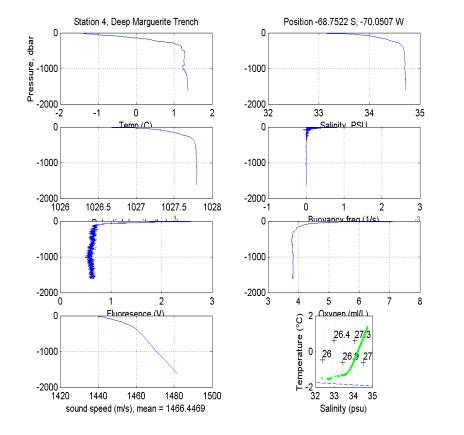
Figure 7. CTD 4 profile data at the deep part of Marguerite Trough.
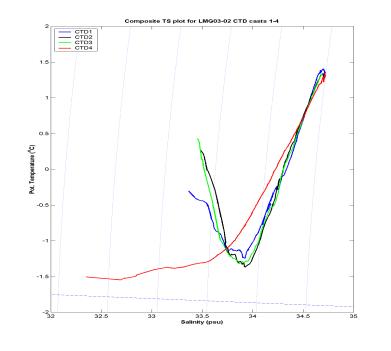
Figure 8. Potential temperature-salinity relationship for CTD stations 1-4. The dashed line along the bottom of the figure is the freezing temperature of sea water as a function of salinity.
3.4 Float Deployments
Four WHOI isobaric Solo floats were deployed on
LMG03-02. These floats are designed to repeat the following cycle: (a) sink to
a specified depth D; (b) drift with the current at that level for T days,
collecting temperature, conductivity, and pressure data; (c) sink to a greater
depth Dm and immediately begin an ascent to the surface, rapidly collecting
temperature, conductivity and pressure data; (d) drift at the surface
transmitting the environmental data and GPS position data using ARGOS. After
completing this cycle, the float sinks to D to start the next cycle. Each float
is equipped with a pumped Sea Bird temperature and conductivity sensor set and
precision pressure sensor.
The
four Solo floats deployed on this cruise were programmed with D = 250 m, T = 5
days, and Dm = 300 m. The floats were
deployed in a rough rectangular array centered over the deep trench running
northwest from George VI Sound towards the shelf edge, with the hope that they
might show if the currents at 250 m were guided by the trench. The float deployment positions are shown
with bathymetry in Figure 9 and listed in Table 1.
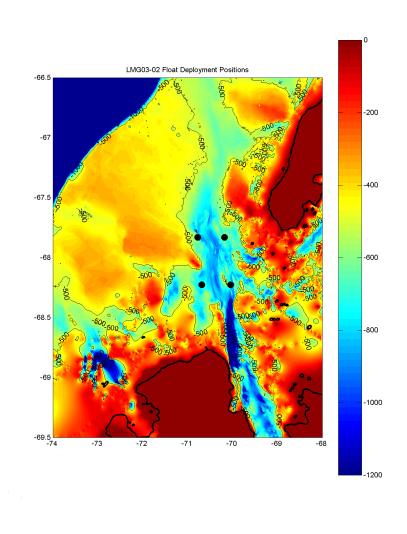
Figure 9. WHOI Solo float launch positions (black dots) plotted
over the 15-second digital bathymetry produced by T. Bolmer (WHOI). The 500-m and 1000-m isobaths are shown. To
simplify the contour plot, all depths greater than 1200 m have been set
equal to 1200 m.
4.0 Meteorological Measurements
4.1 Introduction
A good knowledge of the surface meteorological conditions during the U.S. SO GLOBEC program is essential to understand the role of surface wind stress and heat flux forcing on the regional circulation and upper ocean properties. The surface meteorological data are also useful in interpreting other physical and biological data collected during the program. The primary sources of surface meteorological data during U.S. SO GLOBEC include the data collected aboard the LMG and NBP during cruises in the study area, and two AWSs that were deployed on small islands in the mouth of Marguerite Bay in May 2001 during NBP01-03. This section provides a preliminary description of the meteorological data collected on LMG03-02.
The L.M.
Gould left Punta Arenas on 12 February and arrived at Palmer Station on 17
February (Leg 1). She left Palmer Station later that day and returned to Palmer
Station from the SO GLOBEC study area on 2 March (Leg 2). The L.M. Gould left Palmer Station the next
day for Punta Arenas and arrived there on 7 March (Leg 3).
A full suite of meteorological and underway data was collected during the cruise with several short periods when some variables were not measured. These gaps were quite short and filled by linear interpolation. The ship uses GMT year day (yd) as given by GPS for time. Leg 2 corresponds to yd = 48.8 to 61.45. Our description here will focus on the surface forcing during Leg 2, when the LMG was working in the study area.
4.2 Instrumentation
The meteorological sensors are mounted on the ship's main mast (Figure 10). The sensors include a pair of wind monitors and other sensors to measure air temperature (AT), relative humidity (RH), barometric pressure (BP), incident shortwave (SW) and long-wave (LW) radiation, and photosynthetically active radiation (PAR). Sea surface temperature (SST) was measured using a remote sensor in the intake manifold, and sea surface salinity (SSS), fluorescence (Fluor), and light transmission (Trans) were measured using a thermosalinograph, fluorometer, and transmissometer placed in the wet lab. The different sensors and their calibration history and installation dates if known are given in Table 3.
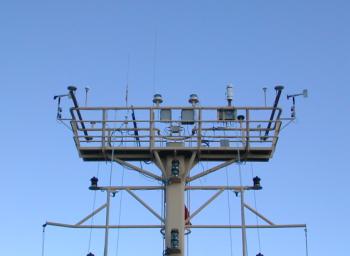
Figure 10. Meteorological sensors mounted on a platform railing on top of mast.
Table 3. LMG03-02 meteorological and underway sensors, their calibration history, and time of installation if known.
|
Variable |
Sensor |
Serial Num. |
Last Cal. |
Next Cal. |
Installed |
|
Star. Wind |
RM Young 5106 |
28392 |
7/28/02 |
7/28/03 |
|
|
Port Wind |
RM Young 5106 |
35061 |
2/28/02 |
2/28/03 |
|
|
AT, RH |
RM Young 41372LC |
6133 |
9/13/02 |
9/13/03 |
11/20/02 |
|
BP |
RM Young 61201 |
BP 00873 |
8/15/01 |
8/15/03 |
10/25/02 |
|
PAR |
Biosp. Inst. QSR-240P |
6394 |
6/5/01 |
6/5/03 |
7/19/01 |
|
SW |
Eppley PSP |
31701F3 |
9/18/02 |
9/18/03 |
10/25/02 |
|
LW |
Eppley PIR |
32031F3 |
9/18/02 |
9/18/03 |
10/25/02 |
|
SST |
Sea-Bird 3-01/S |
031619 |
9/13/02 |
9/13/03 |
|
|
SSS |
Sea-Bird 21 |
2110410-1769 |
8/2/02 |
8/2/03 |
10/25/02 |
|
Trans |
WET Labs C-Star 25cm |
CST-424PR |
7/31/02 |
7/31/03 |
|
|
Fluor |
Turner 10AU-005-CE |
6046 RTD |
|
|
|
4.3 Data Acquisition and Processing
The raw L.M. Gould shipboard meteorological and underway data were collected using the ship's DAS. A 1-minute processed subset of the raw data was saved at the end of each day in a flat ASCII text file on the ship's data drive Q:\.geopdata\JGOF\. This 1-minute time series was produced using a Joint Global Ocean Flux Study (JGOFS) code that merged the met data with navigation and other data and combined the ship's motion and the measured (relative to the ship) wind speed and direction data to make true wind speed and direction relative to the ground. The code has been updated to use the upwind wind sensor to compute true wind. The light transmission data is not included in the JGOFS subset.
The daily 1-minute data were obtained from drive Q, converted into standard variables, using the MATLAB m-file read_lmg_met1m, and after simple editing, stored as MATLAB mat-files (e.g., the file for yd 50 is jg050a.mat). These files were then merged into a composite file lmg_met1m.mat for the entire cruise using merge_lmg_met1m. This 1-minute data were then low-pass filtered and subsampled using make_lmg_met5m to create a 5-minute best basic meteorological data set (lmg_met5m.mat). The 5-minute data were then used with compute_lmg_wshf5m to estimate the surface wind stress and heat flux components, which were added to the lmg_met5m.mat. Copies of these MATLAB mat-files, the m-files used to construct them, the edited daily JGOFS mat-files, summary figures, and document are included in the cruise data CD.
Overall, the data quality of the meteorological and underway data looks good with three exceptions. The short-wave (SW) radiation time series exhibits a negative bias during the night that is both large and variable in time. The PAR record exhibits clear day/night transitions which were used to isolate the night-time SW periods and successfully remove the night-time bias. The sea surface temperature (SST) record exhibited frequent (mostly negative) spikes. Most of these were removed through editing, so that the 5-minute data are relatively clean. Lastly, the incident long-wave (LW) radiation time series exhibits several negative spikes to values below 100 W m-2 which seem unphysical. After removing the largest spikes, the 5-minute LW time series was below 100 W m-2 a total of 6.9 hours during Leg 2. The remaining spikes should have little effect on the long-wave heat flux component.
4.4 Description of Cruise Weather
Time series of the 5-minute surface meteorological data during Leg 2 are shown in Figure 11. A slowly moving low pressure system caused strong winds from the northeast at the beginning of Leg 2. Fortunately, the winds dropped to below 10 kts for the SIO S7A and S2A recoveries before strengthened to over 40 kts on late yd 50. The winds then dropped over the next day to generally less than 25 kts, which allowed us to continue to work our way south and recover the SIO outer moorings. The winds continued to be moderate (less than 25 kts) from the northwest to northeast as the LMG entered and worked in Marguerite Bay. The air and SST both got colder as we moved southward, until the coldest air and SST were measured near and in the ice edge in the mouth of George VI Sound off Alexander Island. Most days were overcast or cloudy, and the relative humidity was generally high, greater than 80%. On yd 56, the LMG headed north through the inner passage east of Adelaide Island and continued through the island passages until the afternoon of yd 59, when the ship headed north across the shelf to recover the S1A mooring. During this inner-passage period the winds were quite variable in speed and direction, and the air temperature got warmer while the SST remained cool, near 0ﺍC, before warming on yd 58. The barometric pressure was relatively steady during this period, however, the relative humidity dropped to values near 50%, perhaps indicative of dry air coming from the Antarctic Peninsula and being channeled through the various passages. The relative humidity remained below 80% to the end of Leg 2.
4.5 Description of Surface Fluxes
The surface wind stress and heat flux components are shown in Figure 12 for Leg 2. The strongest stresses occurred during the beginning of Leg 2, with a peak stress of 1 N m-2 towards the south and southwest on late yd 50. The wind stress was generally less than 0.2 N m-2 when the ship was working in Marguerite Bay, allowing the mooring operations and marine mammal surveys to continue without interruption. The wind stress was more variable when the ship was moving north through the inner passages, and did increase as the ship crossed the shelf to reach S1, however, the wind stress was weak during the S1 mooring operations. The dominate components in the surface heat flux are the two radiation components. The sensible and latent fluxes are relatively small before starting north in the inner passage on yd 58. Larger sensible and latent fluxes occur during this northward steam, in part because of the increased wind and air temperature and lower relative humidity in the passages.
Wind stress and heat flux statistics are listed in Table 4 for the initial period of Leg 2 (yd = 48.8 to yd = 56.1) when the LMG left Palmer Station to the time when she started her steam northward through the inner passage. During this initial period, the ship was in open waters over the shelf and in Marguerite Bay, so the mean wind stress and heat flux are representative of the SO GLOBEC working area during this period. The mean wind stress was 0.153 N m-2 directed towards the south-southwest (102ﺍ true with respect to 0ﺍ directed towards east). During this initial period, the mean net heat flux is weak and cooling (-37 W m-2) with the net long-wave cooling (-144 W m-2) overbalancing the net short-wave warming (94 W m-2). The net sensible and latent fluxes are quite weak in comparison.
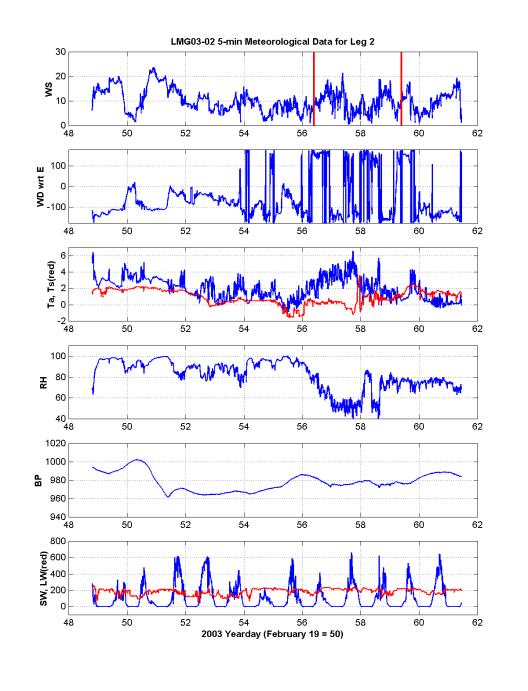
Figure 11. Surface meteorological measurements during Leg 2 of LMG03-02. The two vertical red lines in the top panel bracket the period when the LMG was steaming north through the inner passage. The wind direction plotted is the direction the wind vector is pointing with respect to east (e.g., a wind blowing towards the south is -90o, an eastward wind is 0o). Units: wind speed, m s-1; temperature, oC; relative humidity, %; barometric pressure, mb; short- and long wave radiation, W m-2.
Table 4. Wind stress and heat flux statistics for LMG03-02 yd = 48.8 to 56.1 during Leg 2. Units: wind stress, N m-2; heat flux, W m-2.
| Variable | Mean | Standard Deviation | Minimum | Maximum |
|---|---|---|---|---|
| Tx | -0.032 | 0.143 | -0.459 | 0.525 |
| Ty | -0.149 | 0.193 | -0.934 | 0.058 |
| Qnet | -37.1 | 138.8 | -258.5 | 475.9 |
| Qsw | 94.3 | 135.2 | 0 | 579.3 |
| Qlw | -144.0 | 40.5 | -264.3 | -67.5 |
| Qsen | 12.1 | 9.7 | -10.9 | 55.4 |
| Qlat | 0.6 | 9.8 | -32.4 | 27.3 |
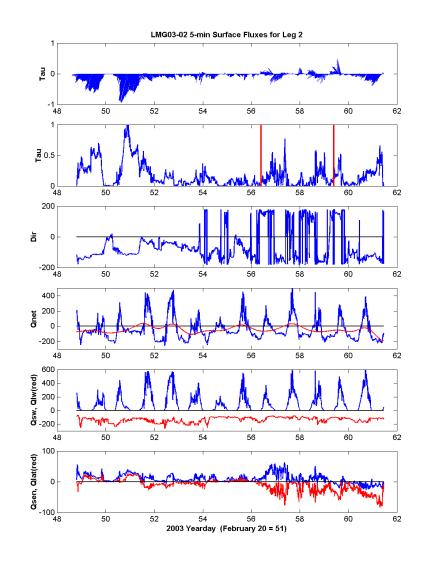
Figure 12. Surface wind stress and heat flux during Leg 2 of LMG03-02. Units of wind stress are N m-2 and heat flux W m-2. The two vertical red lines in the second panel bracket the period when the LMG was steaming north through the inner passage.
5.0 Marine Mammal Observations
5.1 Acoustic Census of Mysticete Whales
The primary goal of this project is to determine the
minimum population estimates, distribution and seasonality of mysticete whales
within the West Antarctic Peninsula region.
These data will be integrated with the SO GLOBEC environmental data sets
to improve understanding of baleen whale distribution and seasonal abundance in
the area. The species of interest are:
blue (Balaenoptera musculus), fin (B. physalus), humpback (Megaptera novaeangliae) and minke (B. bonaerensis) whales, southern right whale (Eubalaena australis), sperm whale (Physeter macrocephalus), killer whale (Orcinus orca), as well as Southern Ocean seals, such as crabeater (Lobodon carcinophaga), Weddell seal (Leptonychotes weddellii) and leopard
seal (Hydrurga leptonyx).
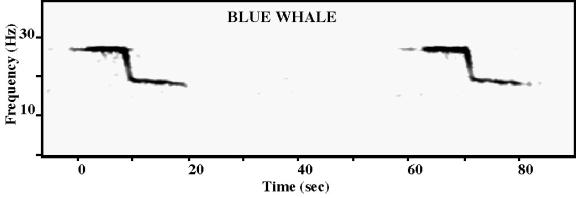
Figure 13. Antarctic blue whale calls recorded on the ARPs. The call is a 28 Hz tone of 10-second duration, followed by a 1-second down-sweep (28-19 Hz) and a 10-second slightly down-swept tone (19-18 Hz).
A key task for the LMG03-02 cruise was to recover 7 bottom-mounted acoustic recording packages (ARPs) and to redeploy one ARP at site 1, co-located with a Long-Term Ecological Research (LTER) station. The ARPs consist of a data logging system with two 18-gigabyte hard disks, an acoustic release, and a hydrophone component floating 10 m above the mooring. They sample acoustic data continuously at 500 samples s-1 over the 12 months of the deployment. Also during this cruise, sonobuoys were deployed opportunistically to supplement the information obtained from the visual observations, as well as the ARP data. Sonobuoys are expendable underwater listening devices. Sonobuoys detect underwater sounds, which get transmitted to the underway ship using radio waves. These sounds can be reviewed for whale calls in real-time and simultaneously recorded onto a digital audio tape (DAT). We deployed two types of sonobuoys: 57B omni-directional sonobuoys that record broadband (20Hz20 KHz) acoustic data, and 53B DiFAR (Directional Fixing And Ranging) sonobuoys that can be used to determine the exact bearing of the sound.
All seven ARPs deployed last year were successfully recovered during this cruise, and all instruments came back in good condition (see Figure 1 for ARP locations). There was evidence of slight corrosion on the shallow water instruments (S7 and S9). Six instruments (S1A, S2A, S5A, S6A, S7A, and S9) yielded complete, high-quality acoustic data sets. One instrument (S4A) had low gain on its hydrophone, resulting in only partial data return. One instrument was serviced, batteries and disks were replaced, and then deployed at site 1B, co-located with an LTER station.
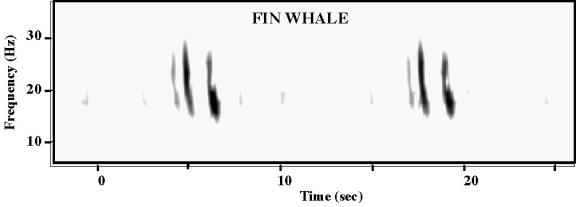
Figure 14. Antarctic
fin whale calls recorded on the ARPs.
The call produced by the whale is a single down-swept pulse (30-15 Hz).
Multipath propagation produced two additional pulses.
Preliminary analysis of the
ARP data show high numbers of calls on all instruments. Blue whale calls are
present in large numbers, and there is evidence of calling blue whales year
round. Blue whale calls are more
frequently detected along the shelf break (S1A, S2A, S5A, S6A) than on the
shallow water instruments (S7A, S9).
Fin whales are present seasonally, with stronger fin whale calls heard
on the instruments from the shelf break.
Minke whale calls are seen most frequently in the shallow water
instruments, as were seal calls, mostly likely crabeater seals. An unidentified
call (Figure 15) was heard frequently again this year on all instruments,
showing higher call presence during the sea ice-covered periods. The source of these sounds is still not
known, but they are suggestive of minke whale song. During winter time these calls are so abundant that they create a
band of high ambient noise near 150 Hz.
Figure 15. Unidentified
calls recorded on the ARP S-6, day 247, 1813 GMT. A quadruplet pulse near 150 Hz repeats on a 3-second
interval. High ambient noise at
150 Hz is from the production of many of these songs in the nearby
region.
Sonobuoys were deployed both when marine mammals were
visually detected and randomly throughout the cruise (Figure 16). A total of 33 sonobuoys were deployed26
omnidirectionals (type 57B) and 7 DiFARs (type 53B). The locations of all the
deployments are shown in Figure 16 and given in the cruise event log (Appendix 1). Whale species heard and the number of
sonobuoys which detected them are: blue (3), fin (5), humpback (5), minke (2),
sei (2), right (1) and sperm (1) (Figure 17). The detection of sei whales by
the sonobuoys was a significant event.
This is the first time that low-frequency acoustic signals have been
recorded from sei whales anywhere. The
characteristics of these signals will be useful to help located sei whales in
the ARPs, and therefore determine sei whale seasonality in the West Antarctic
Peninsular region. In recognition of
this we will devote attention to these data in the present cruise report. See also the visual sighting description of
this event in the next section of the cruise report.
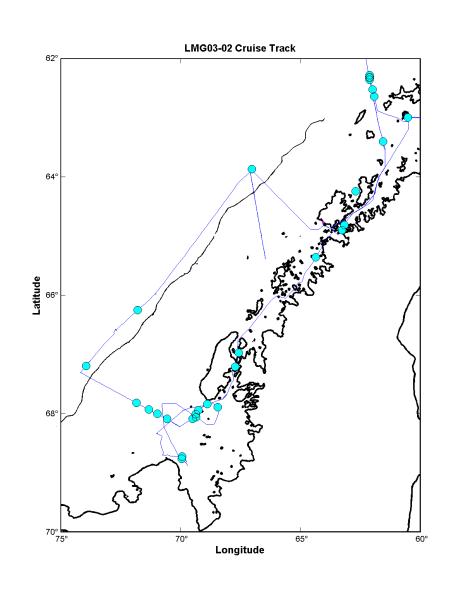
Figure 16. Locations of sonobuoys deployed during LMG03-02
south of 62ﺍS.
Sonobuoys were also deployed north of 62ﺍS but not shown here.
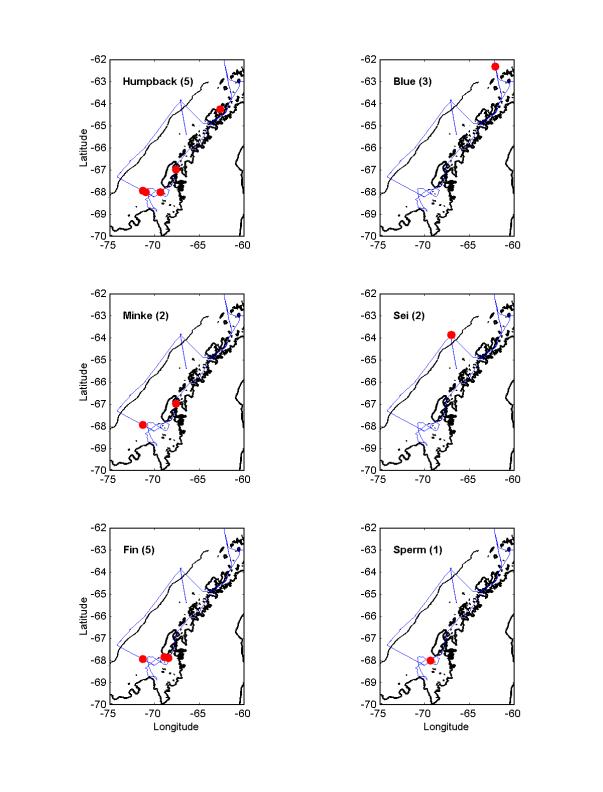
Figure 17. Locations of whales captured by sonobuoys deployed during LMG03-02 south of 62ﺍS.
On
19 February 2003, at about 1310 GMT, blows were sighted which were later
recognized as sei whales near ARP S2, which was floating on the surface while
the ship searched for it. Upon
realizing sei whales were present, a type 53D sonobuoy was deployed at 1400 and
a type 57B at 1405. At 1413 the ship's
3.5 kHz sonar was secured and we began to receive clear whale calls on both
sonobuoys. The ship stopped at 1421 to maintain good radio contact with the
sonobuoys and yet keep ship noise distant from the sonobuoys while the whales remained
near the sonobuoys. At 1555 the ship continued on its way and sonobuoy contact
was lost about 1700.
During the nearly three hours
of recordings from the two sonobuoys, whale calls were observed at a rate of
about one per minute for a total of nearly 200 whale calls from this group of
about 15 sei whales. Using the directional information from the DIFAR buoy and
time differences between the two buoys many of the calls can be located
geographically and source levels can be computed. Sei whales have only rarely
been recorded and never so well as in this instance, none of the previous
reports having been published in any detail. The few reported recordings of sei
whales sound nothing like the calls recorded in this instance. These recordings
will result in a technically complete and detailed publication on the sounds of
sei whales in the Antarctic. The sounds were a series of tones and sweeps
generally in the 200 to 600-Hz range with durations of one to three seconds.
There were also a number of sounds which can be described as whooshes or
growls, which are more difficult to quantify. The unique quality of the sei
whale sounds which distinguishes these recordings from those of any other whale
is the manner in which the tones and sweeps suddenly step up or step down in
frequency during the call. Often but
not always these steps occur at harmonic frequencies.
Figure 18. A spectrogram
of one call from a sei whale. The distinctive and unique character of the sei
whale calls recorded in this encounter is the frequency stepping in the tonal
and swept frequency calls which often occur at harmonic frequencies.
5.2
International Whaling Commission Cetacean Sighting and
Biopsy Summary
Visual surveys were
conducted in daylight hours throughout the cruise, when visibility and weather
conditions permitted. Over 200 hours of visual survey effort was conducted.
Humpback whales made up the majority of sightings (Table 5). The main
objectives of the cruise were to recover SIO and WHOI moorings and redeploy one
SIO mooring on the northern LTER transect line. In addition, ship time was
allocated to the visual survey, photographic identification and biopsy program.
The objectives of this program were to: conduct visual survey throughout the SO
GLOBEC study area in the WAP; focus ship time effort on geographical areas
and/or at physically defined features (i.e., the ice edge, Matha Strait,
southern Adelaide Island, waters over deep troughs, northeast end of Alexander
Island) where whales had been found in concentrations and/or feeding during
the previous spring, autumn and winter SO GLOBEC cruises; to obtain
photographic identification records and tissue biopsies from whales in these
areas.
Table 5. Cetacean sightings and number of animals observed during LMG03-02
| Species - Common Name | Sightings | Animals |
|---|---|---|
| Fin whale, like fin whale | 23 | 65 |
| Sei whale | 5 | 22 |
| Minke, like minke | 17 | 36 |
| Killer whale | 3 | 38 |
| Unidentified cetaceans | 13 | 26 |
| Hourglass dolphin | 3 | 13 |
| Humpback, like humpback | 116 | 320 |
| TOTAL | 180 | 520 |
Humpbacks were numerous, as
usual in the Bransfield and Gerlache Straits, and around Palmer Station (see
Figures 19-21). After leaving Palmer Station the ship worked offshore, just
over the shelf break to recover moorings. Sighting conditions were not good
throughout this part of the cruise due to sea and wind conditions, and hardly any
sightings were made. One notable exception occurred during the recovery of the
SIO ARP S2A. More than 20 sei whales in five groups were observed in the area,
very active at the surface and feeding (side lunging observed). Sonobuoys were
deployed, and the ship remained stationary and declutched to reduce
interference. A wide range of calls were recorded over the next two hours (see
section 5.1). These high quality recordings are exceptional because
acoustic detections from this species have rarely been made, and this species
is generally believed to be infrequent callers.
The next part of the cruise
was conducted within Marguerite Bay (northern end). The WHOI and SIO moorings
were retrieved, detected or dragged for over a number of days. During transits
around the Faure Shallows (22 February), many humpbacks and minkes were
detected visually (see maps). Most humpbacks sighted here were in the region of
the shallows that abuts the eastern end of the deep trough that runs in to the Bay
around the southern end of Adelaide Island. Feeding behavior was frequently
observed here.
On 24 February, we surveyed
what was left of the sea ice by following the outer "ice edge" from well
northeast of the tip of Alexander Island in a southwest direction, crossing the
major trough which bisects Marguerite Bay and George VI Sound. Killer whales,
humpbacks and minke whales were recorded here, with humpbacks dominating.
Individual photographic identification records and tissue biopsy samples were
collected from humpback and minke whales along the sea ice edge during the day.
The ship then transited back to the northern end of Marguerite Bay for drifter
and mooring work.
Ship time was again made
available to the marine mammal survey program on 26 February. We chose to head
for Matha Strait -- an area of consistently high whale and krill concentrations
throughout the 2001-2002 SO GLOBEC surveys. As the ship broke through ridge and
rafted sea ice into the southern end of Laird Island, humpbacks were again
found in abundance. The ice edge here provided a rich feeding area for over 50
humpbacks and a small number of minke and killer whales. Zodiac work (photographic
identification, biopsy, feeding behavior observations and photographic records)
was carried out throughout the afternoon.
Humpback groups were also concentrated outside Deception Island on 1 March, and on the transit from the Island to Palmer Station through the Straits that afternoon and evening. This species were also abundant as we crossed Dallmann Bay, headed for Drake Passage on 3 March. At the northern end of the Bay we observed three humpbacks (including a calf) surrounded by a very large, but also widely spaced, group of killer whales. A few of the killer whales were closely shadowing the humpbacks, but did not appear to be seriously intending to attack. Some of the killer whale group were observed tail slapping in unison for some time. This group appeared to be the small 'fish-eating' type rather than the mammal-eating type of killer whale. Excellent survey condition were experienced on the first day of transit back across Drake Passage and an entire afternoon of constant fin whale sightings kept everyone busy as we sailed across uncharted shoals and ridges. Many fin and a couple of blue whales were recorded on sonobuoys here.
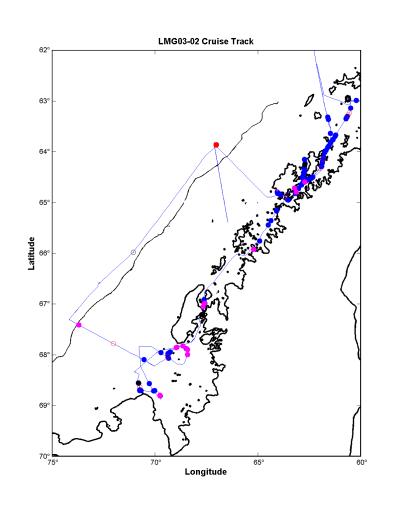
Figure 19. Map with cruise track showing positions of marine mammal sightings. Each symbol denotes where an individual animal or group of similar animals were observed. Color code: red dot = sei whale; blue dot = humpback whale; cyan dot = fin whale; black dot = killer whale; magenta dot = minke whale; black circle = dolphins; red circle = unidentified whales.
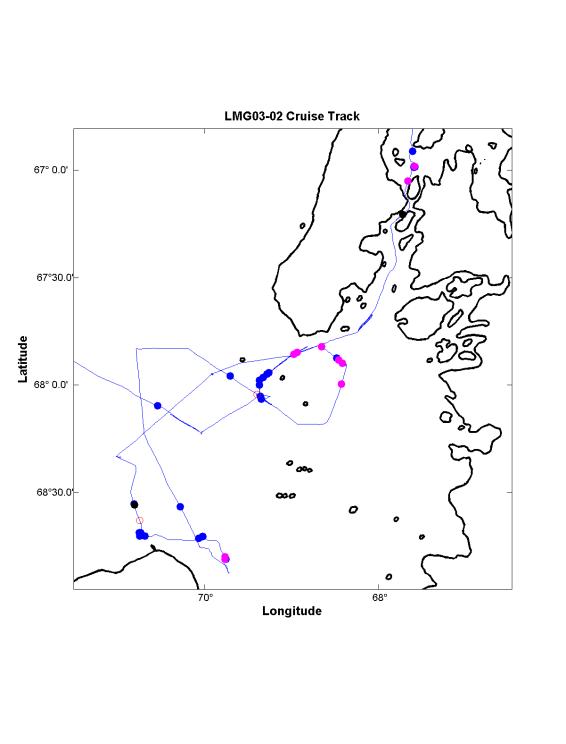
Figure 20. Enlargement
of previous figure for Marguerite Bay region, using same color code.
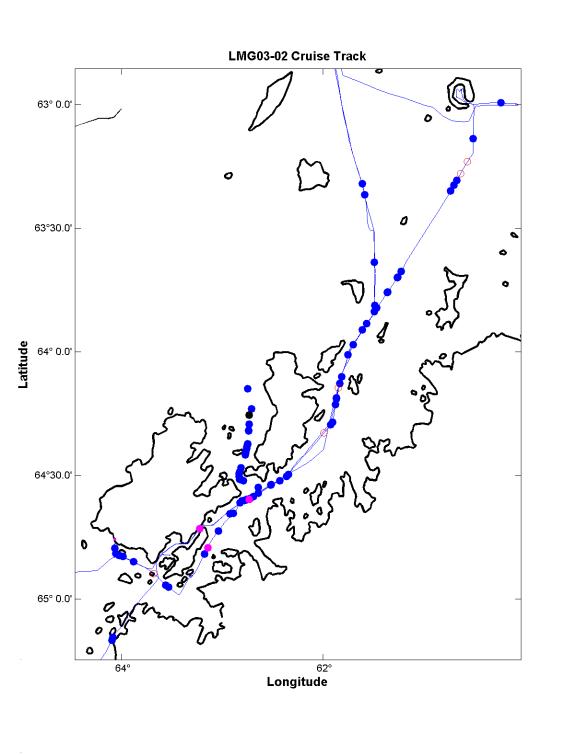
Figure 21. Enlargement of Figure 19 for the Anvers Island and
northern region, using same color code.
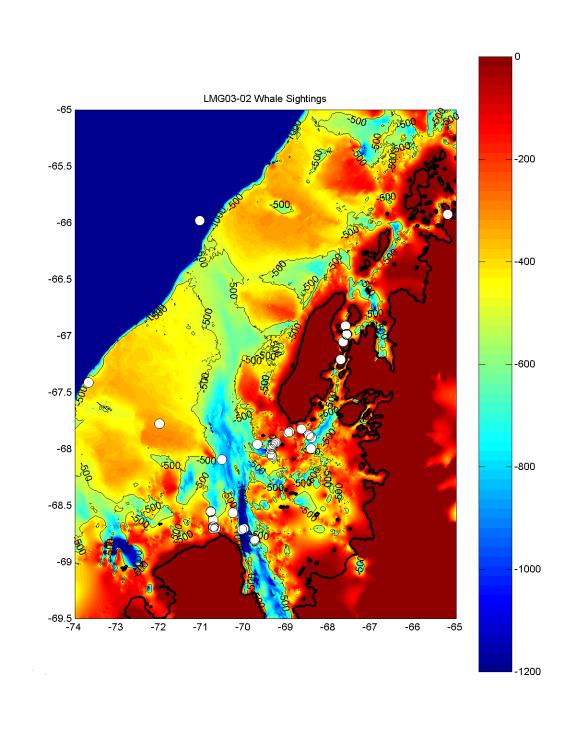
Figure 22. Map of all cetacean sightings superimposed
on the Bolmer 15-second digital bathymetry for the SO GLOBEC region.
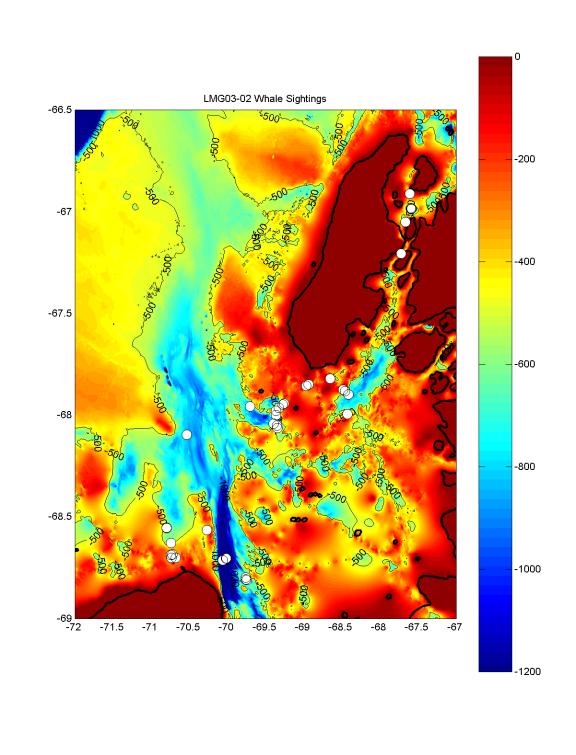
Figure 23. Enlargement
of Figure 22 for the Marguerite Bay region.
6.0 Chief Scientist's Cruise Narrative (all times are local)
Monday (10 February) (yd=41)
Most of the day spent loading fuel on the LMG. In late afternoon, Skip Owen and crew positioned TSK mooring winch and other RPS equipment on deck.
Tuesday (11 February) (yd=42)
Morning winds very strong (steady 30-45 kts, with frequent gusts to 50 kts and occasional ones to 60 kts). Winds stayed strong through about 1600, then slowly dropped to weak winds by night. Dock was closed by Navy for entire day, and we could not make arrangements in time to work after 1500. Asked Andy Nunn to check with Kathleen about status of the LMG script to compute true wind (did it need correction like that made during NBP02-04). (Kathleen reported that she had corrected the LMG script.)
Wednesday (12 February) (yd=43)
Morning winds again strong (25-35 kts), but we were able to load between 0830 and 1000 using just the knuckle crane before winds increased to 30-45 kts and the Navy again closed the dock. At noon, the estimated time of departure (ETD) slipped to 2400, with the hope that the winds would decrease in the afternoon like the previous day. They didn't, but about 1830, the Navy opened the dock (so that an important Chilean Navy transport ship could dock without delay) and we hustled to load the rest of our equipment plus supplies for the ship and Palmer Station (PS). With many helping, we first worked with the knuckle crane to transfer equipment from the dock to the main deck, then an army of helpers carried the boxes, etc., to their places, while another army carried all the fresh food supplies by hand over the gangplank to the storage room on the main deck. Finally the main crane was used to load a 20-foot container and fuel for PS, plus move some of our equipment up to the 01 deck. We completed the job about 2300, and left the dock with pilot abroad at 2400.
Thursday (13 February) (yd=44)
At 0900, the Chief Mate gave us a safety briefing, and we all donned our survival suits, and entered the rescue boat. Then we held a brief science meeting with all the science crew and Raytheon staff. Rough ETA to S1 is 0200 Sunday. Decided not to run mast UV during cruise, to eliminate interference with the SIO directional radio antenna used to listen to sonobuoy transmissions.
Friday (14 February) (yd=45)
Sky was mostly clear all day, with winds 10-20 kts and moderate swell from the southwest. Deb Thiele started the IWC marine mammal surveys this morning, and the cruise event log was started.
Saturday (15 February) (yd=46)
Continued the marine mammal surveys to about 1400, when intermittent rain and high seas making viewing impossible. The two NOAA barometric surface drifters were deployed at 59ﺍS and 60ﺍS. One sonobuoy was deployed near a whale sighting to test the sonobuoy telemetry system. The winds and seas built during the day, reaching 30+ kts from the northwest. We should reach the S1A mooring near 0330 tomorrow, but will need better conditions to attempt to retrieve the mooring. In our haste to leave Punta Arenas, Chile, we did not run a line through the block on the main A-frame, so we can not use the A-frame to recover the mooring unless the weather improves enough for someone to go up and run a line through the block. We will wait at S1A until first light before making a decision to attempt to recover the mooring.
Sunday (16 February) (yd=47)
On approach to S1A, John Hildebrand deployed 5 fluoresce light bulbs with weights, so that they would sink and implode, making a known sound source to calibrate the S1A acoustics. Arrived at S1A at 0400 and decided not to attempt a recovery. Conditions were rough: winds 25-30 kts from the west-northwest, high swell. John talked with the S1A acoustic release, so we know it is there. Captain and John decided to wait and plan to pick up S1A on northward leg back to Punta Arenas.
Conditions slightly better at 0900. As we get into more protected waters on way to Palmer Station, Deb and company will continue the marine mammal survey. If they see whales and the conditions much improved, they will use the Zodiac to observe and sample the whales.
Entered Gerlache Strait about 1700. Conditions became good for whale watching in mid-afternoon. Continued marine mammal survey (MMS) as LMG steamed to southwest end of Gerlache Strait before stopping for the night. Sonobuoys deployed to listen for whales.
Monday (17 February) (yd=48)
The LMG moved to off Palmer Station by 0600. Skip, Deb and crew launched a Zodiac at 0700 after seeing two groups of whales, one with calves. Zodiac recovered just before LMG docked at 0800. After station safety meeting, Skip and crew began cargo transfer, and some visited Palmer Station. Andy discovered that my computer was causing the ship's system to stop when I logged on, so until this is corrected, I will use my computer offline. Skip, Scott and crew did a great job getting the ship ready, and the LMG departed Palmer Station at 1600 to head for S2A. Deb and crew started MMS at 1630. At 1830, Andy changed the sound speed on LMG depth sounder to 1456 m s-1 to be consistent with the 2002 LMG02-01A mooring cruise.
Tuesday (18 February) (yd=49)
Arrived at S2A about 0530, having dropped five light bulbs during approach. Sean woke up the acoustic release and verified S2A was there. Conditions were too rough to attempt recovery. Winds were a steady 30-35 kts from the northeast, the barometric pressure had slowed its descent through the night, and the seas and swell were large. The latest isobar chart showed a strong low moving eastward off the WAP. The Captain decided it was too windy (> 30 kts) to have people work safely on the back deck. In these winds and sea-state, the LMG has trouble holding its heading, thus exposing the back deck to waves coming over the side. After discussion with the Captain, John, and Dick, the decision was made to disable the S2A release and head for S7A with the hope that conditions there may be better. ETA S7A 1630. Deb and crew conducted MMS observations for part of the transit to S7A.
Arrived at S7A about 1630. Talked to the acoustic release to confirm the ARP was present. Captain had ship turned into the wind to see how the ship would ride. Winds steady at 25-30 kts from the northeast. The barometric pressure was slowly rising, and the sea state down a bit from early morning at S2A. At 1657, Captain gave the okay to start the recovery. One XBT cast was made while waiting for the APR to surface. After sending four sets of release commands, the ARP was spotted on the surface close off the starboard bow at 1818. At 1820, the ship started to manuver for the recovery, and at 1832, the ARP was safely onboard. Scott was deck boss, and the recovery operation went smoothly. While waiting for the ARP to surface, the sun came out, the winds died to 15-20 kts from the north, and the seas also down. After the deck was cleared, John, Dick and I decided to try to take advantage of the improving weather and head back to S2A, and hope to recover it early tomorrow morning (ETA 0600).
Wednesday (19 February) (yd=50)
Arrived back at S2A about 0420, conditions much better (winds 10-15 kts from the north, barometric pressure continuing to rise, and the seas lower than at S7). Started sending release commands at 0430, and got confirmation that the ARP had started up. ETA on the surface was 0630. After not spotting the yellow floatation balls on the mooring, started a search pattern using the acoustic range from the ship to the release to determine in which direction to look. An XBT was taken during this search. At some point during the initial phase of the search, the SIO deckbox stopped hearing sounds, especially the release. Assuming that the SIO deckbox may have failed, Scott set up the WHOI deckbox, which did not improve the return signal. Then Scott used the WHOI over-the-side transducer, so that the WHOI deckbox/transductor was completely independent of the ship's system. This approach worked very well, providing clear return signals from the release. After 11 stops to measure the ship-to-release range, we spotted the ARP at 1030 and started the recovery operation. S2A was safely on deck by 1045. During the last part of the search and the recovery operation, several groups of sei whales were seen from the bridge. After the main deck was secured, John and crew deployed several sonobuoys and the ship de-clutched the main drive in order to minimize noise from the ship. The sonobuoys started returning sei whale calls which were being taped on board. These are the first high-quality recordings of sei whales made in combination with visual identification of the whales when they surface. By 1300, the whale sounds from the sonobuoys became very weak or missing, so John and crew decided to stop. At 1300, the LMG headed for S4A with an 0400 ETA. A MMS was conducted along the transit.
The S2A recovery operation started with sending the release commands at 0430 and the instrument lifted onto the ship at 1045. During the 4+ hours that the ARP drifted on the surface before recovery, the ARP moved about 7 km towards the east over 4 hours, a speed of about 50 cm s-1. The wind was from the north, suggesting that the ARP was carried towards the northeast by a strong current with speed greater than 50 cm s-1. Since S2A was located well off the shelf, it seems likely that the ARP surfaced into the Antarctic Circumpolar Current (ACC) or a branch of the ACC.
Thursday (20 February) (yd=51)
Arrived S4A at 0630 and talked with release. Winds had dropped to 20-30 kts from the north, swell from the northeast, and few whitecaps; however, the barometric pressure continuing its rapid drop. At 0641, Captain gave the okay to start the recovery operation. After two release cycles, the ARP started its ascent around 0716, with an ETA at the surface of 0845 (rise speed = 40 m min-1). The initial ranges suggested a faster rise rate of 50 m min-1, which would have put the ARP on the surface at 0815. At 0815, winds had increased to 30-35 kts from the west, with more frequent white caps (sea state 7/8), with 10-15 ft swell from the north. Started maneuvering the ship and ranging with the ship's transducer. At 0830, stopped the ship and started using the WHOI over-the-side transducer. This gave a range of 1300 m, suggesting that the ARP was still rising. At 0845, ship moved westward back towards the deployment site, and at 0900, Rick spotted the ARP on the surface perhaps 500 m to the south of the ship. S4A safely on deck by 0915, and an XBT taken. By 0930, the LMG headed for S5A, with an ETA 1500. Conditions as the LMG left S4A: winds 35 kts from the WNW, swell 10-15 ft from the NE, and the barometric pressure starting an abrupt climb.
Note: The LMG hull transducer is actually an array, having a limited beam directed vertically down towards the bottom. It seems that the ARP may drift out of the beam during its ascent (due primarily to the drift of the ship), thus causing the return signal to fade and be lost, possibly being replaced by the first bottom reflection. The WHOI transducer is omnidirectional, which makes it especially useful to talk with the release when it is on the surface. We would not be able to make these ARP recoveries in these conditions without the WHOI transducer.
At 1230, ride rough on transit to S5A. Winds 30-40 kts from the west-northwest, barometer rising slowly, sun out. Arrived at S5A at 1623 and talked with release. Winds had dropped to 25-30 kts, barometer steady at 971 mb, but still large swell from several directions. Captain said to wait until 1730, when we will reassess if conditions have improved enough to start recovery. This is the deepest instrument (over 3300 m), so it will take 1.5 to 2 hours to surface. At 1730, the winds had dropped to 15-25 kts from the northwest, swell still large, and the Captain said proceed, and the first release command sent at 1737. At about 1810, ARP started its ascent. At 1931, ARP spotted on surface near ship. S5A safely on deck at 1947. A XBT cast was made while the deck was being secured, and at 2000, the ship headed for S6A. ETA 0200.
Friday (21 February) (yd=52)
Arrived S6A at 0415 after dropping light bulbs for ARP calibration, conditions excellent (winds 10-15 kts, barometer 966 mb and dropping very slowly, swell less, bright moon, good visibility). John talked to release, and Mike said start the recovery. First release command sent at 0419, ARP started its ascent on the second release command. ARP spotted on surface at 0615, and safely on deck at 0633. After XBT, ship headed for C3. After lunch, met with Scott to determine deck personnel for recovery: Scott, Brian, Skip, Jamee, Rick, Zan, Dick, and Jason as recorder.
Arrived at C3 at 1610 and stopped about 500 m downwind (southeast) of the drop site. At 1622, Scott talked with the release and got about the right range, given the ship's position. At 1650, Andy and Todd put the CTD in the water at 10 m for 10 minutes to obtain comparison data with the thermosalinograph. Started primary C3 cast at 1704, with an initial lowering speed of 20 m min-1, which was increased to 30 m min-1 at 100 db. About 1712, the hydro winch stopped, with the CTD at about 137 db. After Andy restarted the hydro winch, the cast was continued with a lowering and raising speed of 40 m min-1, and by 1810, the CTD was back onboard. Four pairs of bottles were closed to collect water samples to check the CTD conductivity calibrations. Jason drew the water samples.
LMG03-02 CTD sensor serial numbers:
Primary: T=1542; C=1223; P=53952.
Secondary: T=2205; C=1200.
Once the CTD was onboard, Scott conducted a sonar survey with the ship's 12-KHz system, having the ship cross over the drop site to see if the ship's sonar could detect the C3 mooring. On two passes, a clear return at about 100 m and 250 m were observed, consistent with the main C3 mooring floats at those depths. The two best set of returns were: (1) 68ﺍ 6.087'S, 70ﺍ 31.692'W at 21:26:56Z, and (2) 68ﺍ 6.075'S, 70ﺍ 31.680'W at 21:32:30Z. Todd printed a copy of the sonar screen showing the best returns.
At 1844, Scott and crew started setting up for the recovery. Conditions excellent: winds 10-15 kts from the northwest, barometer steady at 965 mb, few clouds. The mooring surfaced quickly and by 1918, the glass balls were hooked. The entire mooring was safely on deck by 2033. As the smaller instruments (SeaCat, MicroCat, Sea Gauge, TR) were brought onboard and disconnected from the mooring line, Dick placed them in the large sea water tank in the Aquarium room. This tank has sea water pumped in and the overflow drained from the top. The flow rate seems high enough for all the instruments to have the same temperature and conductivity. These instruments will be kept in the tank to obtain simultaneous readings to help check their temperature and conductivity calibrations. The sensor end of the VACMs are placed in a separate deep barrel which is also kept overflowing with sea water. Dick has started downloading the ADCP data.
Saturday (22 February) (yd=53)
Arrived at C2 at 0613, and found a large iceberg roughly 0.9 nm upwind of the mooring site. Scott talked with the release. As we tried to decide if we should do the CTD first as planned and run the risk of having the iceberg drift down on the mooring, it appeared (on radar) that the iceberg was moving towards the mooring site, plus the ADCP showed flow towards the site. Given this, we decided to start the recovery now before the iceberg might move over the mooring. At 0634, Scott fired the release, and the mooring surfaced (top float: 06:34:50; second float: 06:35:30; and glass balls: 06:41:10). Conditions excellent: 10-15 kts from the north, barometer steady at 967 mb. The glass balls were hooked at 0708, and the top float on deck at 0840. At 0910, CTD cast started, and was finished by 1000. WHOI Solo float 193 was safely deployed at 1006. Then the ship headed slowly for C1 as Scott and crew organized the back deck.
Arrived at C1 at 1240 and stopped about 0.25 nm south (downwind) of mooring site. The bathymetry at this site is very irregular. The bridge had to reposition the ship to the west in order to talk with release. Using Scott's deck box, Scott made connect with release. We then set to do a CTD south of the mooring site. Dick and Skip had clamped several MicroCats and other instruments to the CTD rosette frame, so that these could be intercompared with themselves and with the CTD. The CTD cast started at 1315 and finished at 1351. Then Scott conducted a sonar survey for C1, again hoping to paint the mooring with the sonar to confirm that the mooring is there and upright. Twice the sonar showed reflections at the right depths to be the mooring: (1) 68ﺍ 2.99'S, 69ﺍ 21.708'W at 16:57:32 Z, and (2) 68ﺍ 2.975'S, 69ﺍ 21.738'W at 17:06:55 Z. Scott's best guess at the water depth at these two positions is 430 m, which is consistent with the mooring being set a little southeast of the original site. About 1430, Scott started maneuvering the ship so he could talk with the release. For the next hour, Scott tried to make the release open, but with no success. The release acknowledged that it was being send the fire command, but then did not release. At 1534, decision made to disable the C1 release and steam for S9, with an ETA of 1900.
Several groups of humpbacks and minke whales seen during transit to S9. The two Debs got excellent photos of these whales breaching and other behavior as the whales moved quite close to the ship. Sonobuoys were deployed but no clear if any whale calls heard.
Arrived at S9 about 1918, having dropped light bulbs during the approach. Conditions good: 20-25 kts from the northeast, few whitecaps, good visibility. Started first release command at 1920, and after two command signals sent, the ARP came up and surfaced just off the starboard bow of the ship at 2017. The pickup was very quick, and by 2025, S9 was safely on deck. After securing the deck, the marine mammal group continued their survey work as the ship steamed south to the east of the island chain back towards C1.
Sunday (23 February) (yd=54)
Arrived at C1 about 0610. Like yesterday, Scott could get the release to communicate and hear the release command, but the release did not acknowledge that it had released. Conditions good: 15-25 kts from the north, barometer steady at 966 mb. At 0630, started setting up for dragging. At 0810, start deploying drag at about 0.5 nm southeast of mooring site. Drag consisted of weight at end, hook at 300 m, hook at 600 m, depressor weight at 900 m, pinger at 975 m. Ship steamed slowly northwest and did half circle around mooring site and as the ship continued back towards the southeast, the drag sawed the mooring wire, and both yellow and orange floats surfaced at 1014 (ﺎ 30 sec). At 1030, conditions continue to be good: 10-20 kts from the north, barometer rising very slowly to 968 mb. The glass balls did not surface, so 400 m VACM with glass balls still on bottom. Drag line back on deck by about 1115, Scott and crew get lunch before starting C1 recovery. At 1212, start to move to the floats for recovery. At 1217, Scott got a hook into the top float, and by 1302, C1 was on deck. The mooring wire was cut just under the 325 m temperature recorder. The 400 m VACM, glass balls and release are still on bottom.
At 1400, the ship was in position for the next drag, and Scott started paying out the drag wire. The ship moved northwest and made a half circle clockwise around the C1 drop site before heading southeast. Several high tension events during the drag. At 1637, Scott started hauling back the drag and had the last drag weight on deck by 1740. At 1817, the ship had steamed back to the mooring site, and Scott talked with the release. It was still there, and giving the signal that it was still vertical (and not horizontal). This meant that the drag had missed the mooring and the glass balls and VACM were still there holding the release vertical. Scott left the release enabled. We decided to stop the dragging and head back to a more sheltered location for the ship to use its main crane to transfer the Zodiacs from the 01 deck to the main deck. With this quickly accomplished, the ship headed to B1 arriving about 2330 when Scott and I spent an hour making a sonar sweep of the B1 site. We saw no evidence of B1. At 0030, the ship headed south to the head of Alexander Island to look for the ice edge and whales.
Monday (24 February) (yd=55)
Arrived off Alexander Island, finding humpbacks in the ice. Conditions good for Zodiac work, winds 5-15 kts from the north, minimal swell, good visibility with the sun mostly out, barometer rising slowly at 981 mb. The Zodiac was out from about 1000 to 1130, getting one biopsy. About 1215, found two humpbacks resting at the surface in a large patch of brash ice. Zodiac was quickly deployed to sample these whales. Overall, they were able to collect four humpback and one minke biopsies.
During afternoon, Irene and I ran the salinity samples collected at C1, C2, and C3. About 1800, the marine mammal group decided that they wanted to leave sufficient time so that they could attempt to recover S1A before going to Palmer Station. This means that they are ready to leave the George VI Sound area and go north to east of Adelaide Island. As we steamed north, we made a CTD cast over the deepest point (1600 m) in George VI Sound. I used Bolmer's 15' bathymetry to locate the deepest position. One objective of this cast is to determine if the water in the bottom of George VI Sound originated near the bottom in Marguerite Trough (500-800 m) over the mid-shelf. While we had not used the dissolved oxygen (DO) sensor on the three CTD casts made at the mooring sites, Jason argued that we should look at DO in this deep cast, so we asked Andy to add one of the new DO sensors to the primary TC system. Andy quickly made the change and then made the deep cast, and collected duplicate water samples at multiple depths up to 400 m. There appeared to be little change in salinity and DO beneath about 600 m. Temperature showed a layer near 1100 m, that was repeatable on the upcast. Otherwise, the deeper temperature appeared to change very little. After the station was completed, the ship headed north to start deploying the remaining three WHOI Solo floats during the night on our track to C1.
Tuesday (25 February) (yd=56)
Arrived at C1 about 0645, conditions okay for dragging. Scott tried again to release C1 with no luck. We did a range test and confirmed that C1 was still upright and had not been moved. Started our first drag about 0800, had to switch directions of approach to southeast due to the winds from the southeast. About halfway through the drag, the pinger died, so the end of the drag was made without depth information. Started haulback at 1048, and drag back on deck by 1230. Dick and Captain have a new plan for the drag, starting with a hook at 0, another hook at 450 m, the depressor at 900 m, and a pinger at 950 m. After lunch, we spent an hour ranging on C1 to check to see if the last drag had moved the anchor. These fixes gave a new position, still close to the original deployment and two earlier sonar positions (68ﺍ02.953'S, 69ﺍ21.694'W). Most likely the mooring is still where it was deployed (these positions are all within ﺎ 50 m). About 1340, started setting up for drag 4. The winds had shifted from southeast to east, so we approached from west of the site. With 1704 m wire out, as the first hook should have been at the mooring, the winch tension started climbing, until at 1600, the tension reached 14,283 pounds and with a great shudder, the Dush 6 winch pulled lose from its ring stand and came to a stop about 20 feet back on the O1 deck, pressed against one of the Zodiacs. The tension remained very high, above 10,000 pounds for a few minutes as Mike backed the ship down. The winch hydraulic connections were sheared off, and leaked some oil on the deck until all the hydraulic pressure went to 0. After tension was reduced to less than 1000 pounds, the chief engineer had the wire cut with a torch, and crews went to work cleaning up the oil on the deck and securing the winch to the deck. The Zodiac was deflated to prevent any further damage, and moved away from the winch for storage. Once the O1 deck was secured and cleaned, we headed back to the C1 mooring site, and at 1754, found that the C1 release was still in place and upright. Scott disabled the release, we said goodbye to C1 and headed to Tickle Pass.
The trawl wire on the Dush 6 (Markey) winch is rated for 20,000 pounds. We had seen tensions as high at 12,000, 13,000 pounds during our dragging on Sunday, so 14,283 pounds did not seem overly high. Skip found that only one of the three clips that held the rear side of the winch to its ring stand was the right design. All three clips had pulled its bolt out of the winch. This suggests that there may have already been some looseness prior to today's dragging operation, and that this would have happened sooner than later. During the dragging operations, Skip and coworkers had the main and O1 decks completely secured, with no one allowed on deck. This safety precaution helped prevent injury. Fortunately, no one was hurt. The Captain and crew responded immediately and we were ready to resume science within an hour. Afterwards, the Captain and Skip both talked with their supervisors by satellite phone, and NSF will get notification tomorrow. The ship will need to get the winch back on line for the next cruise (LMG03-03). The ship also lost the pinger attached to the drag wire when it was cut. This pinger had been borrowed off the CTD, so another working pinger will need to be found before the CTD can be used.
Wednesday (26 February) (yd=57)
We spent the night off Rothera, and started north in the morning. The winds were very strong (maximum gust = 50 kts) until about 0710, when they dropped to below 10 kts. At 0800, the winds were still low, and the ship used the main crane to transfer the two Zodiacs from the 01 to the main deck. Skip, Jamee, and Rick started working on the deflated Zodiac (the one pushed in by the Dush 6 winch). Two working small boats are required for safe small boat work off the LMG in Antarctic waters, so it is necessary for us to get the second Zodiac ready. If it can not be used, then Skip might consider using one of the ship's lifeboats as the second small boat.
During the morning, the ship steamed north through the inner passage. A group of four Orcas were spotted, one clearly a large male and one a calf. After following them for a short time, the ship hove to and the second Zodiac was fixed and inflated, ready to serve as the backup boat. The first Zodiac was launched around 1230 and proceeded to follow the ship as we continued north through the Gullet. About 1350, we encountered sufficient sea ice in Tickle Channel to recall the Zodiac. We then made our way slowly north through ice-filled Tickle Channel and finally reached open water about 1630. Captain Robert did an excellent job driving the ship through the sea ice. Many of us did not think we would make it, given all the sea ice, the thickness of snow, and many icebergs. There were many seals (over a hundred) and frequent penguins on the sea ice in Tickle Channel and north. The Captain spotted a minke whale in one small opening (no more than 10 m in diameter) in the sea ice.
When we left the ice just off Weertman Island in Hanusse Bay, several whale blows were sighted in the open water ahead, and Zodiac 1 was launched at about 1730, with the ship moving slowly along behind. When Zodiac 1 reached the nearest group of humpbacks, John asked them to deploy a sonobuoy, and the ship stopped and declutched to minimize ship noise in the sonobuoy signal. From the bridge, we spotted at least 14 humpbacks, three minke, and three orcas. Mark and Sue on Zodiac 1 thought there was more, as they were naming them based on their flukes. Zodiac 2 was launched about 1830 and was soon among the whales. The humpbacks were lunge feeding, eye glassing, and logging at the surface. Zodiac 1 was able to collect only two biopsies but many identification photographs. Two humpbacks swam around the ship, coming up to within 2-3 m of the starboard side, surfacing, and then sinking to swim beneath the ship. Jason and I were both trying to photograph these whales, and were running from one side to the other to keep up with the whales. I switched to my standard lens and think I got great pictures of the two whales both on the surface and just below beside the ship. At 2000, the ship recalled both Zodiacs and we started north again. The Captain estimates that we have only about 100 m of sea ice to break through before we are in open water, and he wants to complete this next passage before dark. This was a wonderful day for observing whales, seals, and penguins (Deb Glasgow said it was her best whaling day ever). The humpbacks displayed a wide range of behaviors which the Zodiac crews could see and record in close to the whales.
Thursday (27 February) (yd=58)
Continued north along the inner passage, conducting the marine mammal survey. Our track took us through Lemaire Passage during mid-day, a beautiful narrow channel between a mountainous island to the port and equally mountainous Grahamland to starboard. The winds were funneled into the passage and increased to above 40 kts (the bridge's anemometer recorded a peak gust of 95 kts). Some whales were observed in the passage, and penguins were seen up on the rocks and snow on Grahamland where the sea and cliffs met. Jason and Zan completed running the water samples from CTD 4 through the AutoSal. Scott reported all 7 VACMs wrote full tapes.
Arrived at Port Lockroy around 1430, and started work on repositioning the winch back onto its circular stand. Skip and crew first removed the drum and secured it on the O1 deck. Then they lifted the winch and inspected the underneath, finding it to be simply a flat plate. One bolt had been sheared off, and needed to be removed with the torch. After lifting the winch back on the stand, eyes were welded to the deck, and chain and chain binders used to secure the winch to the deck. This work was completed by 2000, when we left Port Lockroy and headed north in the Neumeyer Channel towards S1A. ETA about noon tomorrow.
Skip reported that the winch is supposed to be secured with eight clips bolted up into the flat bottom of the winch. Only seven clips were there, and at least two on the back side were not the correct design. The bottom plate is relatively thin, so the bolts only had about 1 inch or less of thread in the bottom. Given the tension on the wire, it is not surprising that the back bolts striped the threads. This was an accident waiting to happen, and we were very fortunate that no one was hurt. Again, Skip and crew made sure that the decks were empty during all the dragging operations, so these safety procedures worked!
Friday (28 February) (yd=59)
Deb started MMS at 0500 enroute to S1A. Arrived at S1A about 1430, deployed two sonobuoys on approach, and began to send release commands. The ARP surfaced just ahead of the ship, and by 1549, S1A was safely on deck. After making an XBT, Sean and group finished getting S1B ready for deployment. The winds were 10-20 kts, but 10-ft plus swell and the fresh seas made deploying over the side too risky, so Scott deployed S1B over the stern doors using the knuckle crane and quick release. The deployment went very smoothly and Scott was able to time the release just as the ARP met the crest of one of the large waves passing by the stern. We remained on site to monitor S1B's descent to the bottom and then disabled the release.
The two sonobuoys deployed approaching S1A failed quickly but one did record a blue whale call. John and Mark deployed several directional sonobuoys as we headed back south, hoping to hear a strong blue whale call and guide the ship to it to get both visual and acoustic data simultaneously on the same animal. This has apparently been done only once before, so it will be very exciting if successful. Unfortunately, they did not hear any calls strong enough to track, and we steamed towards Deception Island.
Saturday (1 March) (yd=60)
At 0700, the LMG entered Deception Island under excellent conditions, weak winds and mostly sunny skies. This island is of great scientific interest, in part because of its volcanic activity (last major eruption was in 1970) and history as a Norwegian whaling station (roughly 1909-1931). The island is hollow in the middle (the volcano's cone) and the entrance is a narrow passage between rock cliffs. A cruise ship had entered just before us, and chose to anchor in Whaler's Bay, just inside the entrance. We continued into the Island and stopped off Pendulum Cove, launching Jamee and Rick and full crews in the Zodiacs to visit the abandoned Chilean station Pedro Aguirre Cerda, which had been destroyed in one of the recent eruptions. The water flowing into the ocean from several streams on the beach was quite warm, causing steam to form. The Zodiacs then motored along the coast, entering Telefon Bay and rounding the new island created during the 1967 eruption. The Zodiacs continued along the coast and then beached at the Spanish station Gabriel de Castilla. They had seen the LMG enter and invited the ship to visit. We made a short (40-minute) visit, presenting them with WHOI and LMG patches while they served us food and drink. Many of our group spoke some Spanish, so there were lots of individual conversions going, which was especially nice for all of us. At 1230, we left the base and headed to the LMG, where Jamee took on air. The LMG then steamed back to Whaler's Bay while the two Zodiacs ran there and landed at the old abandoned whaling station. One Zodiac brought another group to the beach, where we had an hour to walk around and see the base, penguins, seals, and gulls up close. All enjoyed this visit the most. About 1430, the Zodiacs returned to the ship and we left to head for Palmer Station. Several humpbacks were spotted in and near the mouth of Deception Island.
Sunday (2 March) (yd=61)
Docked at Palmer Station at 0800. Scientific crew had a base orientation meeting at 0815 before some left to explore the base, climb the glacier, etc. The morning was spent transferring cargo and the afternoon refueling the base from the ship. The base made a wonderful dinner for all, and afterwards, we presented three talks that drew a large group and were well-received. I presented the results of the 2001 drifter study and a brief overview of this cruise, then Deb showed slides from their whale work, and then Irene showed slides from her climb up Annapurna. Scott presented Captain Robert and the base manager with plaques to thank both the ship and Palmer Station for their great help and hospitality over the last two years. This was followed by a great party with lots of dancing.
Monday (3 March) (yd=61)
As the ship was getting ready to sail at 1000, we could not find Zan, who had decided to spend the night ashore in his sleeping bag. Fortunately, someone spotted him asleep and Zan returned to the ship just as all the Palmer Station folks said their goodbyes and came aboard. The lines were then cast off, and the LMG got underway a few minutes after 1000. We had excellent weather as the LMG steamed through Neumeyer Channel into Gerlache Strait and then turned at the Waifs to head north through Schollaert Channel. Saw the British research vessel, James C. Ross, and two cruise ships in Gerlache Straits.
The Ross was conducting trials with their autonomous autosub. Encountered many whales in Dallmann Bay, mostly humpbacks and some minkes and some orcas. Approaching the Astrolable Needle, Deb spotted two groups of orcas near three or four humpbacks. One of the humpbacks appeared to be a calf. The humpbacks were showing their fins, making occasional tail splashes. They may have been keeping the orcas away from the calf. John launched a sonobuoy, and the ship stopped and declutched for 10 minutes. They recorded three orca calls and more humpbacks before the LMG continued north.
Tuesday (4 March) (yd=62)
Wednesday (5 March) (yd=63)
Thursday (6 March) (yd=64)
Steaming
north across Drake Passage. Conducted MMS when conditions are good.
7.0 Chief Scientist's Daily Log
Wednesday - 12 February 2003 (All times local time, GMT-3)
0000 Depart Punta Arenas steaming eastward out the Straits of Magellan.
Thursday - 13 February
0900 - Safety Meeting with Chief Mate
1030 Science Meeting <
Friday 14 February
0000 Continue ADCP section acrosss
Drake Passage
0530 - Start IWC Marine Mammal Survey
(MMS), U.S. SO GLOBEC cruise event log
1500 End MMS
Saturday 15 February
0545
Start MMS
0748
Deploy AMOL surface drifter 1 at 59ﺍS
1017 Deploy sonobuoy 1
1343 Deploy AMOL surface drifter 2
at 60ﺍS
1354
End MMS
Sunday 16 February
0330
Arrive S1A, decide not to attempt recovery in these conditions
0530
Start MMS, sonobuoy deployments
2153
End MMS
Monday 17 February
0500 Start MMS
0630 Launch Zodiac for MMS
0745
Recover Zodiac, end MMS
0800 Arrive at Palmer Station
1600
Depart Palmer Station, head for S2A, start MMS
1830
Change ship depth sounder from 1500 m/s to 1456 m/s
1835
End MMS
Tuesday 18 February
0530 Arrive S2A, too rough
for recovery
0630 Depart S2A, head for S7A
1007 Start MMS
1457 End MMS
1630 Arrive S7A
1657
Start S7A recovery
1716
XBT
1832
S7A on deck, head for S2A
1851
Start MMS
2145
End MMS
Wednesday 19 February
0420 Arrived S2A
0430 Start S2A recovery
0700 XBT
1045 S2A on deck
1057 Start MMS
1100 Deploy 2 sonobuoys near
sei whales
1310 Finish whale recording,
head for S4A
1451 Finish MMS
Thursday 20 February
0630 Arrive S4A
0641 Start S4A release commands
0915 S4A on deck, XBT, head for
S5A
1630
Arrive S5A
1737
Start S5A recovery
1947
S5A on deck, XBT, head for S6A
Friday 21 February
0415
Arrive S6A
0417
Start S6A release commands
0629
Start MMS
0633
S6A on deck, XBT, head for C3
1253 Start MMS, deploy
sonobuoys along transit
1613
Arrive C3, finish MMS
1704
CTD 1 at C3
1810
Sonar sweep of C3
1844
Start C3 recovery
2033
C3 on deck
2045
Start MMS
2155 Finish MMS
Saturday 22 February
0613
Arrive C2
0634
Start C2 recovery
0840
C2 on deck
0910
CTD 2 at C2
1006
Deploy Solo Float 193
1240
Arrive C1
1315
CTD 3 at C1
1351
Sonar sweep of C1
1430
Started sending release command to C1
1534
C1 release would not release, decide to head for S9
1550 Start MMS
1918
Arrive S9
1920
Start S9 recovery
2025
S9 on deck
2205
Finish MMS
Sunday 23 February
0613
Arrive C1, release still not releasing, prepare for dragging
0810
Start C1 drag 1
1014
C1 floats surface
1125
Finish C1 drag 1
1302
C1 on deck, minus the release and 400 m VACM
1400
Start C1 drag 2
1740
Finish C1 drag 2
1817
C1 and VACM still on bottom
1843 Start MMS
2152 Finish MMS
2337 Start sonar sweep at B1
Monday 24 February
0030
Finish sonar sweep at B1
0500
Start MMS
1800 Finish MMS, head for
CTD 4
1900 CTD 4 at deepest
location in George Sound
0000 Deploy Solo Float 183
Tuesday 25 February
0248
Deploy Solo Float 182
0423
Deploy Solo Float 181
0800
Start C1 drag 3
1230
Finish C1 drag 3
1340
Start C1 drag 4
1600
Dush 6 pulled from base, end of drag 4
1754
Disenable C1 release
1800
Start MMS
2100
Finish MMS
Wednesday 26 February
0600 Start MMS
1230
Launch Zodiac 1
1350
Recover Zodiac 1
1730
Launch Zodiac 1
1630
Launch Zodiac 2
2000
Recover Zodiac 1
2010
Recover Zodiac 2
Thursday 27 February
0800
Start MMS
1430
Arrive Port Lockroy, finish MMS, relocate winch
2000 Leave Port Lockroy,
head for S1A
Friday 28 February
0500
Start MMS
1430
Arrive S1A, finish MMS, deploy sonobuoys, start release commands
1549
S1A on deck
1555
XBT
1620
Deploy S1B
1700
Leave S1B, head southeast, start MMS and begin sonobuoy transit
1900
= Finish MMS
Saturday 1 March
0700
Enter Deception Island
1500
Leave Deception Island
Sunday 2 March
0800
Arrive Palmer Station
Monday 3 March
1000
Leave Palmer Station for Punta Arena, MMS
Tuesday 4 March
Steam
for Punta Arenas, MMS
Wednesday 5 March
Steam
for Punta Arenas, MMS
Thursday 6 March
Steam
for Punta Arenas, MMS
Friday 7 March
0800
Arrive Punta Arenas
8.0 Cruise Personnel
Science Party
WHOI
Robert Beardsley Chief
Scientist
Richard Limeburner Scientist
Scott Worrilow Electronics Engineer
Brian Hogue Electronics
Engineer
Jason Hyatt Graduate
Student
Alexander Stine Graduate Student
Irene Beardsley Scientist
SIO/NOAA
John Hildebrand
Scientist
Mark A. McDonald Scientist
Sue Moore Scientist
Sean Wiggins Electronics
Engineer
IWC
Deborah Thiele Scientist
Deborah Glasgow Scientist
Southbound Transit to Palmer
Station
Charles Amsler
Margaret Amsler
Yubecca
Bragg
Ann Fairhead
Glenn Grant
Yusheng Huang
Roger Johnson
Gerry
Ness
John Shigo
Stephanie Weiss
Northbound Transit to Punta Arenas
Bill
Baker
Chris
Coon
Hugh Ducklow
Bill
Fraser
Laura Hamilton
Bob Jirschele
Kristin Van Konynenburg
Jeff
Otten
Donna
Patterson
Joe
Pettit
Rebecca
Shoop
Stacie
Tanner
Raytheon Polar Services Staff
Skip Owen Marine Project
Coordinator
Jamee Johnson
Marine
Technician
Rick Lichtenhan Marine
Technician
Andrew Nunn Electronics
Technician
Todd Johnson Electronics
Technician
Ship Officers and Crew
Robert Verret II Master
John Synder Chief Mate
Alan Arrigoni 2nd Mate
Michael Terminel 3rd
Mate
Michael Murphy
Chief Engineer
Paul Waters 1st
Asst. Engineer
Joseph Zaborny 2nd
Asst. Engineer
Gerald Tompsett 3rd
Asst. Engineer
Efren Prado Able-Bodied
Seaman 1
Fernando Naraga Able-Bodied Seaman 2
Donde Dasoy Oiler 1
Christian Mendez Oiler
2
Christian Novoa Ordinary
Seaman
Rodolfo S. Lucas
Chief Steward
Demetrio Gonzalez Cook
Luciano Albornoz Galley
Hand
Appendix A:
Cruise Event Log