High and low NAO
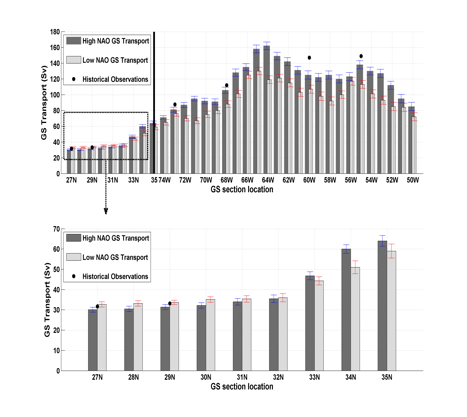
Gulf Stream transport: Annual mean Gulf
Stream transport estimates across
cross-sections at each latitude from 27°N to
35°N (bottom panel) and at each longitude from 75°W to 50°W (top panel). The point of separation is shown by black
solid line. The high (low) NAO transport estimates
are shown with dark bars and associated errors are depicted with blue (red) lines. Observations are shown as black
dots and obtained from estimates made by Leaman et al.,
(1987), Leaman et al., (1989), Halkin
and Rossby, (1985), Johns et al., (1995) and Hogg (1992) at 27°N, 29°N,
73°W, 68°W,
60°W, and 55°W respectively. Model results are seen to
underestimate the data values.