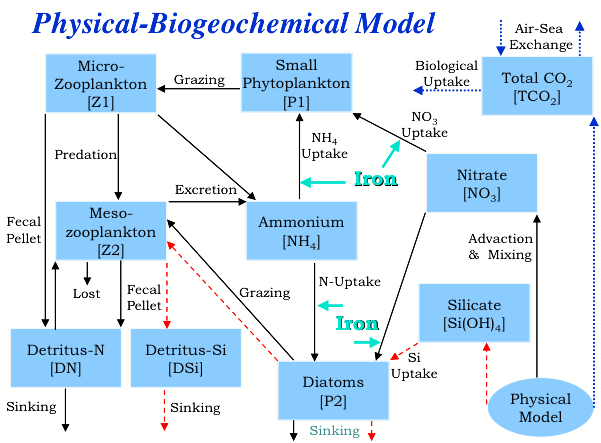
Figure 7. Schematic
diagram of the CoSINE biogeochemical ecosystem model to be used in the proposed modeling activities over the North
Atlantic basin. Black arrows show the path of N;
dashed red arrows show the path of Si; and dotted blue arrows show the path of CO2. Indicated points show uptakes that are a
function of iron availability.