This example shows how to handle Scoring Matrices with the sequence alignment tools. The example uses proteins associated with retinoblastoma, a disease caused by a tumor which develops from the immature retina.
More information on retinoblastoma can be found at
web('http://www.ncbi.nlm.nih.gov/books/bv.fcgi?call=bv.View..ShowSection&rid=gnd.section.129');
The "BLink" link on the left side of this page shows related sequences in different organisms. Download a few of these into the MATLAB workspace.
human = getgenpept('RBHU','SequenceOnly',true);
chicken = getgenpept('CAA51019','SequenceOnly',true);
trout = getgenpept('AAD13390','SequenceOnly',true);
xenopus = getgenpept('AAB23173','SequenceOnly',true);
If you don't have a live web connection, you can load the data from a MAT-file using the command
% load retinoblastoma % <== Uncomment this if no live connection.
One approach to study the relationship between these two proteins is to use a global alignment with the nwalign function.
[sc,hvc] = nwalign(human,chicken);
showalignment(hvc)
Identities = 680/938 (72%), Positives = 830/938 (88%)
  1  MPPKTPRKTAATAAAAAAEPPAPPPPPPPEEDPEQDSGPEDLPLVRLEFEETEEPDFTALCQKL
     |||| | : |::| :  : | :      |   |   :|      :|||  |: |  |:|||: |
  1  MPPK-PLRRAGAARSQRTSPEGGAGTASP---P---GG------TRLEVGEA-E--FVALCDAL

 65  KIPDHVRERAWLTWEKVSSVDGVLGGYIQKKKELWGICIFIAAVDLDEMSFTFTELQKNIEISV
     | || |||:||:|:::::::||: ::| :|||| ||:||||:|:|||||:|||||| |:: |||
 49  KAPDSVREKAWMTYQSLAAADGA-SAYNKKKKETWGVCIFIVAIDLDEMTFTFTELLKSLSISV

129  HKFFNLLKE--I--DT-STKVDNAMSRLLKKYDVLFALFSKLERTCELIYLTQPSSSISTEINS
       ||::|||  :  || |||||:::||| ||||||:||: |:|||| |||| |||| ||:|::|
112  CTFFQFLKEVDVNMDTVSTKVDSTVSRLKKKYDVLLALYHKFERTCGLIYLEQPSSEISAELSS

188  ALVLKVSWITFLLAKGEVLQMEDDLVISFQLMLCVLDYFIKLSPPMLLKEPYKTAV--IPINGS
     :||||  |||||||||:||||||||||||||:||||||||||||| :||||||:||  : :|||
176  VLVLKNYWITFLLAKGKVLQMEDDLVISFQLLLCVLDYFIKLSPPAMLKEPYKSAVTALTVNGS

250  PRTPRRGQNRSARIAKQLENDTRIIEVLCKEHECNIDEVKNVYFKNFIPFMNSLGLVTSNGLPE
      |||||||||:|| :||:::||::||:|||||:||:|||||||| :||||:||||:|:||||||
240  TRTPRRGQNRNARASKQIDTDTKVIEILCKEHDCNLDEVKNVYFTSFIPFLNSLGVVASNGLPE

314  VENLSKRYEEIYLKNKDLDARLFLDHDKTLQTDSIDSFETQRTPRKSNLDEEVNVIPPHTPVRT
     |: |||:|:|:||||||:|||||||||:||| | |   : :|||||:| ||||| : |:||||:
304  VDVLSKQYDELYLKNKDIDARLFLDHDETLQPDVIACSQLERTPRKNNPDEEVNHVLPQTPVRA

378  VMNTIQQLMMILNSASDQPSENLISYFNNCTVNPKESILKRVKDIGYIFKEKFAKAVGQGCVEI
     :||||||||||||||:|:||::||:|||||||||::||||||:::|:|||:|||:||||||:||
368  AMNTIQQLMMILNSATDKPSDTLIAYFNNCTVNPEDSILKRVESLGHIFKKKFAEAVGQGCAEI

442  GSQRYKLGVRLYYRVMESMLKSEEERLSIQNFSKLLNDNIFHMSLLACALEVVMATYSRSTSQ-
     |||||:||||||||||||||||||||||::|||||||||||| ||||||||:|||||:|::||
432  GSQRYQLGVRLYYRVMESMLKSEEERLSVHNFSKLLNDNIFHTSLLACALEIVMATYGRTASQS

505  NLDSG-TDLSFPWILNVLNLKAFDFYKVIESFIKAEGNLTREMIKHLERCEHRIMESLAWLSDS
     :  |: |||||||||||::|||||||||||||||:| :|||:|||||||||||||||||| |||
496  DGTSAETDLSFPWILNVFDLKAFDFYKVIESFIKVEPSLTRDMIKHLERCEHRIMESLAWQSDS

568  PLFDLIKQSKDREGPTDHLESACPLNLPLQNNHTAADMYLSPVRSPKKKGSTTRVNSTANAETQ
     ||||||||||:||| ||: | :  ||||||:||||||:|||||||||||:|    ::|:| ::|
560  PLFDLIKQSKEREGQTDQPEPTSTLNLPLQHNHTAADLYLSPVRSPKKKASGHPQSGTSNPDAQ

632  ATSAFQTQKPLKSTSLSLFYKKVYRLAYLRLNTLCERLLSEHPELEHIIWTLFQHTLQNEYELM
      ::: ||||| ||||||||||||:|||||||:||  |||||||:|| :|||||||||||| |||
624  PSATSQTQKPQKSTSLSLFYKKVFRLAYLRLHTLFFRLLSEHPDLEPLIWTLFQHTLQNESELM

696  RDRHLDQIMMCSMYGICKVKNIDLKFKIIVTAYKDLPHAVQETFKRVLIKEEEYDSIIVFYNSV
     |||||||||||||||||||||:||:|| ||:|||:||:: |||||||||:||:||||||||| |
688  RDRHLDQIMMCSMYGICKVKNVDLRFKTIVSAYKELPNTNQETFKRVLIREEQYDSIIVFYNLV

760  FMQRLKTNILQYASTRPPTLSPIPHIPRSPYKFPSSPLRIP-GGNIYISPLKSPYKISEGLPTP
     |||:||||||||||:||||||||||||||||:| :|| |:| |:||||||||||||:|:|: :|
752  FMQKLKTNILQYASNRPPTLSPIPHIPRSPYQFSNSPRRVPAGNNIYISPLKSPYKFSDGFHSP

823  TKMTPRSRILVSIGESFGTSEKFQKINQMVCNSDRVLKRSAEGSNPPKPLKKLRFDIEGSDEAD
     |||||||||||||||:|||||||||||||||||:  :||||| |: |||||:|||||||:||||
816  TKMTPRSRILVSIGETFGTSEKFQKINQMVCNSESHVKRSAEPSDAPKPLKRLRFDIEGQDEAD

887  GSKHLPGESKFQQKLAEMTSTRTRMQKQKMNDSMDTSNKEEK
     |:|||| ||||||||||||||||||||||:||: ||| :|||
880  GGKHLPQESKFQQKLAEMTSTRTRMQKQKLNDGNDTSANEEK
In this alignment the function used the default scoring matrix, BLOSUM62. Different scoring matrices can give different alignments. How can you find the best alignment? One approach is to try different scoring matrices and look for the highest score. When the score from the alignment functions is in the same scale (in this case, bits) you can compare different alignments to see which gives the highest score.
This example uses the PAM family of matrices, though the approach used could also be used with the BLOSUM family of scoring matrices. The PAM family of matrices in the Bioinformatics Toolbox consists of 50 matrices, PAM10, PAM20,..., PAM490, PAM500.
Take the two sequences (RBHU and CAA51019) and align them with each member of the PAM family and then look for the highest score.
score = zeros(1,50);
alignments = cell(1,50);
fprintf('Trying different PAM matrices ')
for step = 1:50
   fprintf('.')
   PamNumber = step * 10;
   [matrix,info] = pam(PamNumber);
   score(step) = nwalign(human,chicken,'scoringmatrix',matrix,'scale',info.Scale);
end
Trying different PAM matrices ..................................................
You can use the plot function to create a graph of the results.
x = 10:10:500;
plot(x,score)
legend('Human vs. Chicken');
xlabel('PAM matrix');ylabel('Score (bits)');
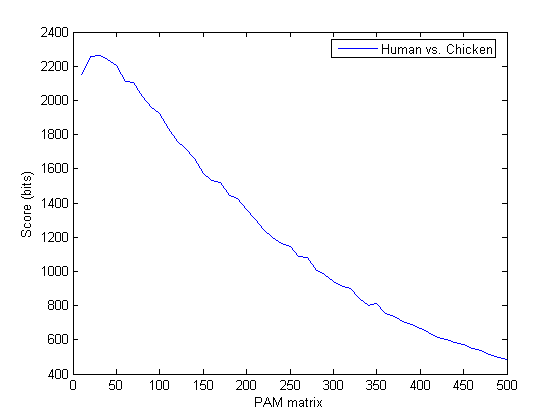
You can use max with two outputs to find the highest score and the index in the results vector where the highest value occurred. In this case the highest score occurred with the third matrix, that is PAM30.
[bestScore, idx] = max(score)
bestScore =

  2.2605e+003


idx =

     3
Repeat this with different organisms: xenopus and rainbow trout.
xenopusScore = zeros(1,50);
xenopusAlignments = cell(1,50);
troutScore = zeros(1,50);
troutAlignments = cell(1,50);
fprintf('Trying different PAM matrices ')
for step = 1:50
   fprintf('.')
   PamNumber = step * 10;
   [matrix,info] = pam(PamNumber);
   xenopusScore(step) = nwalign(human,xenopus,'scoringmatrix',matrix,'scale',info.Scale);
   troutScore(step) = nwalign(human,trout,'scoringmatrix',matrix,'scale',info.Scale);
end
Trying different PAM matrices ..................................................
You can use the command hold on to tell MATLAB to add new plots to the existing figure. Once you have finished doing this you must remember to disable this feature by using hold off.
hold on
plot(x,xenopusScore,'g')
plot(x,troutScore,'r')
legend({'Human vs. Chicken','Human vs. Xenopus','Human vs. Trout'});box on
xlabel('PAM matrix');ylabel('Score (bits)');
hold off
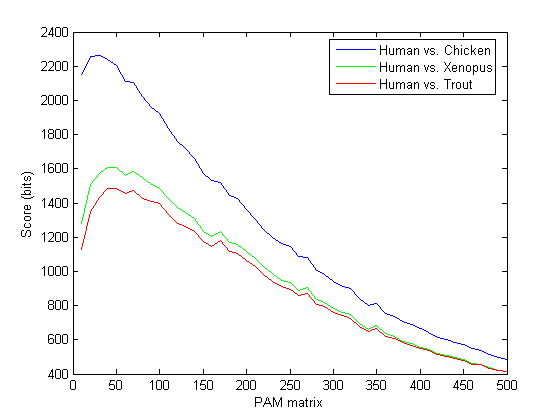
You will see that different matrices give the highest scores for the different organisms. For human and xenopus, the best score is with PAM40 and for human and trout the best score is PAM50.
[bestXScore, Xidx] = max(xenopusScore)
[bestTScore, Tidx] = max(troutScore)
bestXScore =

        1607


Xidx =

     4


bestTScore =

        1484


Tidx =

     5
The PAM scoring matrix giving the best alignment for two sequences is an indicator of the relative evolutionary interval since the organisms diverged: The smaller the PAM number, the more closely related the organisms. Since organisms, and protein families across organisms, evolve at widely varying rates, there is no simple correlation between PAM distance and evolutionary time. However, for an analysis of a specific protein family across multiple species, the corresponding PAM matrices will provide a relative evolutionary distance between the species and allow accurate phylogenetic mapping. In this example, the results indicate that the human sequence is more closely related to the chicken sequence than to the frog sequence, which in turn is more closely related than the trout sequence.