This example shows a method that can be used to investigate the significance of sequence alignments. This example uses the Tay-Sachs disease related genes and proteins from the aligndemo example.
In this example, you we will work with directly with the protein data so use getgenpept instead of getgenbank to download the data from the NCBI site. First read the human protein information into MATLAB.
humanProtein = getgenpept('NP_000511','SequenceOnly',true);
seqdisp(humanProtein)
ans =

  1  MTSSRLWFSL LLAAAFAGRA TALWPWPQNF QTSDQRYVLY PNNFQFQYDV SSAAQPGCSV
 61  LDEAFQRYRD LLFGSGSWPR PYLTGKRHTL EKNVLVVSVV TPGCNQLPTL ESVENYTLTI
121  NDDQCLLLSE TVWGALRGLE TFSQLVWKSA EGTFFINKTE IEDFPRFPHR GLLLDTSRHY
181  LPLSSILDTL DVMAYNKLNV FHWHLVDDPS FPYESFTFPE LMRKGSYNPV THIYTAQDVK
241  EVIEYARLRG IRVLAEFDTP GHTLSWGPGI PGLLTPCYSG SEPSGTFGPV NPSLNNTYEF
301  MSTFFLEVSS VFPDFYLHLG GDEVDFTCWK SNPEIQDFMR KKGFGEDFKQ LESFYIQTLL
361  DIVSSYGKGY VVWQEVFDNK VKIQPDTIIQ VWREDIPVNY MKELELVTKA GFRALLSAPW
421  YLNRISYGPD WKDFYVVEPL AFEGTPEQKA LVIGGEACMW GEYVDNTNLV PRLWPRAGAV
481  AERLWSNKLT SDLTFAYERL SHFRCELLRR GVQAQPLNVG FCEQEFEQT
Results of BLASTX search done with this sequence showed that a Drosophila protein, GenPept accession number AAM29423, has some similarity to the human HEXA sequence. Use getgenpept to download this sequence.
flyProtein = getgenpept('AAM29423','SequenceOnly',true);
seqdisp(flyProtein)
ans =

  1  MSLAVSLRRA LLVLLTGAIF ILTVLYWNQG VTKAQAYNEA LERPHSHHDA SGFPIPVEKS
 61  WTYKCENDRC MRVGHHGKSA KRVSFISCSM TCGDVNIWPH PTQKFLLSSQ THSFSVEDVQ
121  LHVDTAHREV RKQLQLAFDW FLKDLRLIQR LDYGGSSSEP TVSESSSKSR HHADLEPAAT
181  LFGATFGVKK AGDLTSVQVK ISVLKSGDLN FSLDNDETYQ LSTQTEGHRL QVEIIANSYF
241  GARHGLSTLQ QLIWFDDEDH LLHTYANSKV KDAPKFRYRG LMLDTSRHFF SVESIKRTIV
301  GMGLAKMNRF HWHLTDAQSF PYISRYYPEL AVHGAYSESE TYSEQDVREV AEFAKIYGVQ
361  VIPEIDAPAH AGNGWDWGPK RGMGELAMCI NQQPWSFYCG EPPCGQLNPK NNYTYLILQR
421  IYEELLQHTG PTDFFHLGGD EVNLDCWAQY FNDTDLRGLW CDFMLQAMAR LKLANNGVAP
481  KHVAVWSSAL TNTKRLPNSQ FTVQVWGGST WQENYDLLDN GYNVIFSHVD AWYLDCGFGS
541  WRATGDAACA QYRTWQNVYK HRPWERMRLD KKRKKQVLGG EVCMWTEQVD ENQLDNRLWP
601  RTAALAERLW TDPSDDHDMD IVPPDVFRRI SLFRNRLVEL GIRAEALFPK YCAQNPGECI
If you don't have a live web connection, you can load the data from a MAT-file using the command
%load hexosaminidase % <== Uncomment this if no live connection.
The first thing that to do is to use seqdotplot to see if there are any areas that are clearly aligned. This doesn't show any obvious alignments, but there are some areas of interest.
seqdotplot(humanProtein,flyProtein,3,2)
ylabel('NP 000511');xlabel('AAM29423');
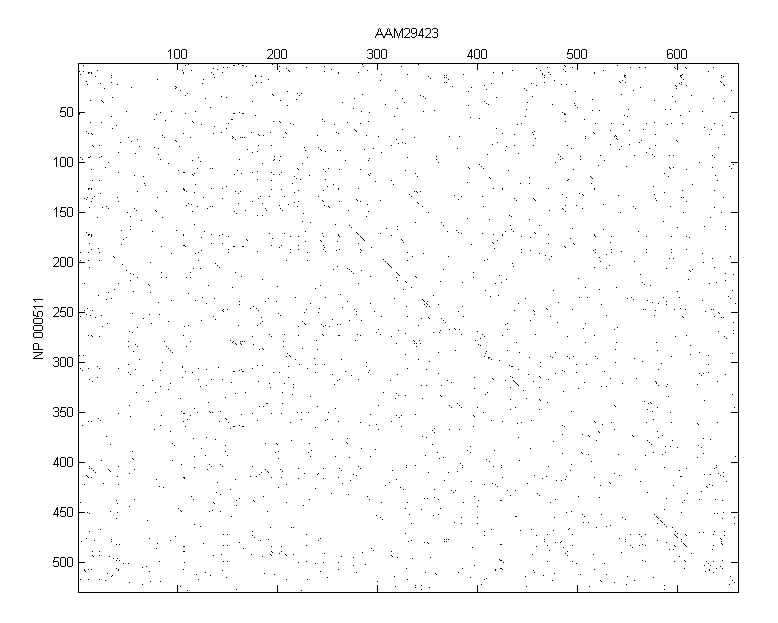
Notice that there are a few diagonal stretches in the dot plot. This is not particularly good evidence of a significant global alignment but you can try a global alignment using the function nwalign. The BLOSUM50 scoring matrix is used by default.
[sc50,globAlig50] = nwalign(humanProtein,flyProtein);
fprintf('Score = %g \n',sc50)
showalignment(globAlig50);
Identities = 194/670 (29%), Positives = 370/670 (55%)
  1  MT-S-S--R----LW----F--SLL-----LA-A-AF--A-GR------ATAL-WP----W--P
     |: : |  |    |     |  ::|     :: | |:  |  |      |:::  |    |
  1  MSLAVSLRRALLVLLTGAIFILTVLYWNQGVTKAQAYNEALERPHSHHDASGFPIPVEKSWTYK

 28  -QN---FQT-----SDQR--Y---------V-LYPN---NF----Q---FQY-DVS---SAAQP
      :|   :::     | :|  :         | ::|:   :|    |   |:  ||:   ::|:
 65  CENDRCMRVGHHGKSAKRVSFISCSMTCGDVNIWPHPTQKFLLSSQTHSFSVEDVQLHVDTAHR

 57  GC-SVLDEAFQRY-RD--L---L-F-GSGSWPR-PYLTGK-R-HT-LE-KNVLV-VSV-V-TPG
        : |: ||: : :|  |   | : ||:| |     ::| | |: ||   :|  ::  |   |
129  EVRKQLQLAFDWFLKDLRLIQRLDYGGSSSEPTVSESSSKSRHHADLEPAATLFGATFGVKKAG

104  --CN-Q-----LPT--LE-SVEN---YTL-TIND-D--QCLLLSETVWGALRGLETFSQLVWKS
        : |     | :  |: |::|   | | | ::    |  ::::: :|| :|| |::||:| :
193  DLTSVQVKISVLKSGDLNFSLDNDETYQLSTQTEGHRLQVEIIANSYFGARHGLSTLQQLIWFD

150  AEGTFF--INKTEIEDFPRFPHRGLLLDTSRHYLPLSSILDTLDVMAYNKLNVFHWHLVDDPSF
      |  ::    :::::| |:| :|||:||||||:: : ||  |:  |:  |:| |||||:|  ||
257  DEDHLLHTYANSKVKDAPKFRYRGLMLDTSRHFFSVESIKRTIVGMGLAKMNRFHWHLTDAQSF

212  PYESFTFPELMRKGSYNPVTHIYTAQDVKEVIEYARLRGIRVLAEFDTPGH--T-LSWGP--GI
     || |  :|||  :|:|:  :: |: |||:|| |:|:: |::|: |:|:|:|  :  :|||  |:
321  PYISRYYPELAVHGAYSE-SETYSEQDVREVAEFAKIYGVQVIPEIDAPAHAGNGWDWGPKRGM

271  PGLLTPCYSGSEP-S---G--TFGPVNPSLNNTYEFMSTFFLE-VSSVFP-DFYLHLGGDEVDF
      | |: | : ::| |   |    | :||: | || ::: :: | :: : | ||: |||||||::
384  -GELAMCIN-QQPWSFYCGEPPCGQLNPKNNYTYLILQRIYEELLQHTGPTDFF-HLGGDEVNL

327  TCWKSNPEIQDFMRKKGFGEDFKQLESFYIQTLLDIVSSYGKGYVVWQEVFDNKVKIQPDT-I-
      || :  :  | :|  |:  || :|:: : :  |   :   |  :||: :: |  :: |:: :
445  DCWAQYFNDTD-LR--GLWCDF-MLQA-MARLKLANNGVAPKHVAVWSSALTNTKRL-PNSQFT

389  IQVWREDI-PVNY--MKE-LELV-TKAGFRAL-LS-APWY-LNRISYGP--DWKDFYVVEPLA-
     :|||  :    ||  : :  ::: :::    |  : : |   :  : :    |:: |  :|
503  VQVWGGSTWQENYDLLDNGYNVIFSHVDAWYLDCGFGSWRATGDAACAQYRTWQNVYKHRPWER

442  FEGTPEQKALVIGGEACMWGEYVDNTNLVPRLWPRAGAVAERLWSNKLTS-DLTF----AYERL
     ::   ::|  |:|||:||| | ||:::|  |||||::|:|||||::   : |: :    :::|:
567  MRLDKKRKKQVLGGEVCMWTEQVDENQLDNRLWPRTAALAERLWTDPSDDHDMDIVPPDVFRRI

501  SHFRCELLRRGVQAQPLNVGFCEQE-FEQT
     | || :|:: |::|: |   :| |:  |
631  SLFRNRLVELGIRAEALFPKYCAQNPGECI
Score = 49.6667
The sequence similarity is fairly low, so BLOSUM30 might be a more appropriate scoring matrix.
[sc30,globAlig30] = nwalign(humanProtein,flyProtein,'scoringmatrix','blosum30');
fprintf('Score = %g \n',sc30)
showalignment(globAlig30);
Identities = 190/670 (28%), Positives = 403/670 (60%)
  1  MT-S-S--R-----L-W--F--S-LL----L--AAAF--A-GR------ATAL-WP----W--P
     |: : |  |     | :  |  : |:    :  |:|:  |  |      |:::  |    |  :
  1  MSLAVSLRRALLVLLTGAIFILTVLYWNQGVTKAQAYNEALERPHSHHDASGFPIPVEKSWTYK

 28  -QN-F--QT-----SDQR--Y---------V-LY--PN-NF----Q---F-----QY--DVS-S
      :|    ::     |::|  :         | ::  |: :|    |   |     |:  |::
 65  CENDRCMRVGHHGKSAKRVSFISCSMTCGDVNIWPHPTQKFLLSSQTHSFSVEDVQLHVDTAHR

 53  AAQPGCS-VLDEAFQ--RY-RDLLF-GSGSWP-RPYLTGK-R-HT-LEK-NVLV-VSV-VTP-G
     :::: :  ::|  ::  |: : | : ||:| |     ::| | |: ||: ::|: ::: | : |
129  EVRKQLQLAFDWFLKDLRLIQRLDYGGSSSEPTVSESSSKSRHHADLEPAATLFGATFGVKKAG

104  -CN--QLP-T-LESVE-NYTLTINDD--QC-L-L----L-SETV---W-GALRGLETFSQLVWK
      ::  |:: : |:| : |::|  ||:  |: : :    |  |::   : ||  ||:|: ||:|
193  DLTSVQVKISVLKSGDLNFSLD-NDETYQLSTQTEGHRLQVEIIANSYFGARHGLSTLQQLIWF

149  SAEGTFF-I-NKTEIEDFPRFPHRGLLLDTSRHYLPLSSILDTLDVMAYNKLNVFHWHLVDDPS
     ::|  :: : ::::::| |:| :|||:||||||:: ::||  |:  |:::|:| |||||:|::|
256  DDEDHLLHTYANSKVKDAPKFRYRGLMLDTSRHFFSVESIKRTIVGMGLAKMNRFHWHLTDAQS

211  FPYESFTFPELMRKGSYNPVTHIYTAQDVKEVIEYARLRGIRVLAEFDTPGH--T-LSWGPGIP
     ||| |  :|||:  |:|:: :::|::|||:||:|:|:::|::|: |:|:|:|  :  :|||
320  FPYISRYYPELAVHGAYSE-SETYSEQDVREVAEFAKIYGVQVIPEIDAPAHAGNGWDWGPKRG

272  -GLLTPCYSGSEP-S---G--TFGPVNPSLNNTYEFMSTFFLE-VSSVFP-DFYLHLGGDEVDF
      | |: |  : :| |   |  : |::||: | || ::  :: | :  : | ||: |||||||::
383  MGELAMC-INQQPWSFYCGEPPCGQLNPKNNYTYLILQRIYEELLQHTGPTDFF-HLGGDEVNL

327  TCWKSNPEIQDFMRKKGFGEDFKQLESFYIQTLLDIVSSYGKGYVVWQEVFDNKVKIQPDT--I
      || : : : | :  :|:::||: |::  ::: |:: :   | ::|| ::: | :|  |::  :
445  DCW-A-QYFND-TDLRGLWCDFM-LQA-MARLKLANNGVAPKHVAVWSSALTN-TKRLPNSQFT

389  IQVWREDI-PVNY--MKE-LELV-T--KAGFRALLSAPWY-L-NRI-SYGPDWKDFYVVEPLAF
     :|||  :: : ||  ::  : :: :  :|:: ::  : |: : : : :    |:::|   | :
503  VQVWGGSTWQENYDLLDNGYNVIFSHVDAWYLDCGFGSWRATGDAACAQYRTWQNVYKHRPWER

443  EGT-PEQKALVIGGEACMWGEYVDNTNLVPRLWPRAGAVAERLWSNK-LTSDL-TF---AYERL
       : :::|: |:|||:||| | || : |  |||||::|:|||||:::    |: ::   :: |:
567  MRLDKKRKKQVLGGEVCMWTEQVDENQLDNRLWPRTAALAERLWTDPSDDHDMDIVPPDVFRRI

501  SHFRCELLRRGVQAQPLNVGFCEQ-EFEQT
     | ||  |:  |::|: |   :|:| : | :
631  SLFRNRLVELGIRAEALFPKYCAQNPGECI
Score = 82
This gives an alignment that has some areas of fairly strong similarity but is this alignment statistically significant? One way to investigate whether this score is significant is to use Monte Carlo techniques. Given that the fly sequence was found using a BLAST search, there is some evidence that there is similarity between the two sequences. It is reasonable to expect the score for this alignment to be higher than the scores obtained from aligning random sequences of amino acids to the protein.
To assess if the score is significant the first step is to make some random sequences that are similar to that of the fly protein. One way to do this is to take random permutations of the fly sequence. This can be done with the randperm function. Then calculate the global alignment of these random sequences against the human protein and look at the statistical significance of the scores.
n = 50;
globalscores = zeros(n,1);
flyLen = length(flyProtein);
for i = 1:n
    perm = randperm(flyLen);
    globalscores(i) = nwalign(humanProtein,flyProtein(perm),'scoringmatrix','blosum30');
end
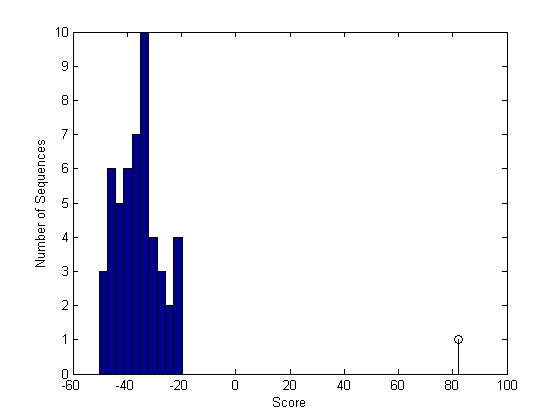
Now plot the scores as a bar chart. Note that because you are using randomly generated sequences, the plot may differ from the one shown in the HTML version of this tutorial.
figure
buckets = ceil(n/5);
hist(globalscores,buckets)
hold on;
stem(sc30,1,'k')
xlabel('Score'); ylabel('Number of Sequences');
The scores of the alignments to the random sequences can be approximated by the type 1 extreme value distribution. Use the evfit function from the statistics toolbox to estimate the parameters of this distribution.
parmhat = evfit(globalscores)
parmhat =

  -31.8612    7.7013
Overlay a plot of the probability density function of the estimated distribution.
x = min(globalscores):max([globalscores;sc30]);
y = evpdf(x,parmhat(1),parmhat(2));
[v, c] = hist(globalscores,buckets);
binWidth = c(2) - c(1);
scaleFactor = n*binWidth;
plot(x,scaleFactor*y,'r');
hold off;
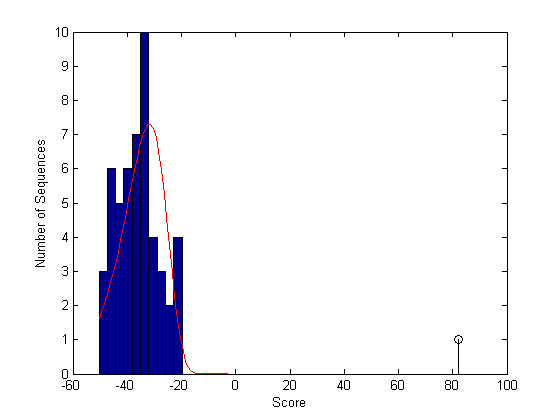
From this plot you can see that the global alignment (globAlig30) is clearly statistically significant.
In FLYBASE (http://flybase.bio.indiana.edu) you can search for all Drosophila beta-N-acetylhexosaminidase genes. The gene that you have been looking at so far is fdl. Now you want to take a look at one of the other genes, Hexo1. See http://flybase.bio.indiana.edu/.bin/goreport?GO:0004563 for more information on these genes.
flyHexo1 = getgenpept('AAL28566','SequenceOnly',true);
Repeat the process of generating a global alignment and then using random permutations of the amino acids to estimate the significance of the global alignment.
[Hexo1score,Hexo1Alignment] = nwalign(humanProtein,flyHexo1,'scoringmatrix','blosum30');
fprintf('Score = %g \n',Hexo1score)
showalignment(Hexo1Alignment);
Hexo1globalscores = zeros(n,1);
flyLen = length(flyHexo1);
for i = 1:n
    perm = randperm(flyLen);
    Hexo1globalscores(i) = nwalign(humanProtein,flyHexo1(perm),'scoringmatrix','blosum30');
end
Score = -72.2
Identities = 106/534 (20%), Positives = 277/534 (52%)
  1  MTSSRL-WFSLLLAAAFA-GRATALWPWPQNFQTSDQRYVLYPNNFQFQYDVSSAAQPGCSVLD
     |:  :|  |   :::: :   ::: :|  ::: : :|| | |  : : : ||::::: |  |
  1  MALVKLNTFHWHITDSHSFPLEVKKRPELHKLGAYSQRQV-Y--T-R-R-DVAEVVEYG-RV--

 63  EAFQRYRDLLFGSGSWPRPYLTGKRHTLEKNVLVVSVVTPGC-NQLPTLESVENYTLTINDDQC
      :: |::   | : : | ::  | :|   || :     | :| |: |  :|   : : : : :|
 56  RGI-RVMP-EF-D-A-PAHVGEGWQH---KN-M-----T-ACFNAQP-WKS---F-C-V-EPPC

126  LLLSETVWGALRGLETFSQLVWKSAEGTFFINKTEIEDFPRFPHRGLLLDTSRHYLPLSSILDT
       |::|| :::  :::: : ::    || | ::  ::|:  | |:|   |   : :  :|  ::
 98  GQLDPTV-NEM--YDVL-EDIY----GTMF-DQF-NPDI--F-HMG--GD---E-VS-TSCWNS

190  LDVMAYNKLNVFHWHLVDDPSFPYESFTFPELMRKGSYNPVTHIYTAQDVKEVIEYARLRGIRV
      :  :  :  : :| : ::::: :|:  |   || ::: : |::: :: |::|:  : :  | :
142  -S--Q--P--IQQW-M-KKQGWGLETADF---MRLWGHFQ-TEAL-GR-VDKVANGTHT-PI-I

254  LAEFDTPGHTLSWGPGIPGLLTPCYSGSEPSGTFGPVNPSLNNTYEFMSTFFLEVSSVFPDFYL
     |  : | |  |:  | |  :|:|::   :  :| | |:|::::::| :: : : ||: : ::||
189  L--W-TSG--LTEEPFIDEYLNPERYIIQ-IWTTG-VDPKVKKILE-RG-YKIIVSN-YDALYL

318  HLGGD-EV-DFTCWKSNPEIQDFMRKKGFGEDFKQLESFYIQTLLDIVSSYGKGYVVWQEVFDN
      :||:  | | : | | | |  : :|  :  | : |:|  |:  ::    :|:  ::| | :|
243  DCGGAGWVTDGNNWCS-PYI-GW-QKV-Y--D-NSLKS--IAGDYEH-HVLGAEGAIWSEQID-

380  KVKIQPDTIIQVWREDIPVNYMKELELVTKAGFRALLSAPWYLNRISYGPDWKDFYVVEPLAFE
     :  :  |:  ::|    |  :: : :| ::   |  |   |  | :: |  |:    :|   :
296  EHTL--DN--RFW----P--RA-S-AL-AE---R--L---W-SNPAE-G--WR--Q-AES-RLL

444  GTPEQKALVIGGEACMWGEYVDNTNLVPRLWPRAGAVAERLWSNKLTSDLTFAYERLSHFRCEL
      :: |: || :|   : |  :: : : |: |    : :|   : ::  |   |        |:
331  -LHRQR-LVDNG---L-G--AE-A-MQPQ-W-CL-Q-NE-H-ECPI--D---A--------CS-

508  LRRGVQAQPLNVGFCEQEFEQT
       ||     |:| :: : :: :
365  --RGSGRLGLIVLLLLTTLS-A
Plot the scores, calculate the parameters of the distribution and overlay the PDF on the bar chart.
figure
buckets = ceil(n/5);
hist(Hexo1globalscores,buckets)
xlabel('Score');
ylabel('Number of Sequences');
hold on;
stem(Hexo1score,1,'c')
parmhat = evfit(Hexo1globalscores)
x = min(Hexo1globalscores):max([Hexo1globalscores;Hexo1score]);
y = evpdf(x,parmhat(1),parmhat(2));
[v, c] = hist(Hexo1globalscores,buckets);
binWidth = c(2) - c(1);
scaleFactor = n*binWidth;
plot(x,scaleFactor*y,'r');
hold off;
parmhat =

  -68.6015    7.9932
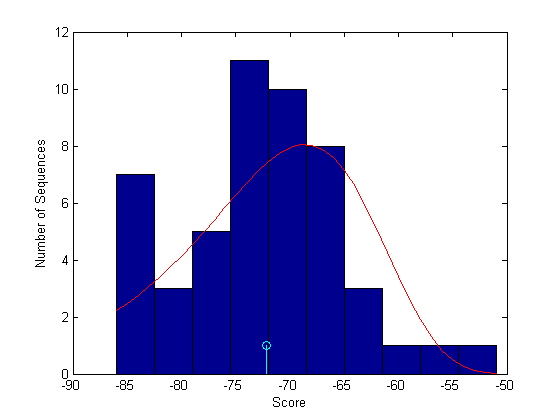
In this case it appears that the alignment is not statistically significant. Higher scoring alignments can easily be generated from a random permutation of the amino acids in the sequence. You can calculate an approximate p-value from the estimated extreme value CDF: However, far more than 50 random permutations are needed to get a reliable estimate of the extreme value pdf parameters from which to calculate a reasonably accurate p-value.
p = 1 - evcdf(Hexo1score,parmhat(1),parmhat(2))
p =

    0.5286
One thing to notice is that the lengths of the two sequences are very different. The human HEXA1 is 529 residues long and the fly Hexo1 protein is only 383 residues in length. When you try to align these two sequences globally this difference in length means that a large number of gaps will have to be introduced into the sequence. This means that the significance of the scores will be heavily dependent on the gapopen and gapextend parameters. (See the help for nwalign for more details.) Instead of using global alignment, in this case a better approach might be to look at the local alignment between the two sequences.
You will now repeat the process of estimating the significance of an alignment this time using local alignment and a slightly different method of generating the random sequences. Instead of simply permuting the letters in the sequence, an alternative is to draw a sequence from a multinomial distribution which is estimated from the fly protein sequence. You can do this using the aacount and randseq functions; the first estimates the amino acid frequencies of the query sequence and the later randomly creates new sequences based on this distribution.
[lscore,locAlig] = swalign(humanProtein,flyHexo1,'scoringmatrix','blosum30');
fprintf('Score = %g \n',lscore)
showalignment(locAlig);

localscores = zeros(n,1);
aas = aacount(flyHexo1);
for i = 1:n
    randProtein = randseq(flyLen,'FROMSTRUCTURE',aas);
    localscores(i) = swalign(humanProtein,randProtein,'scoringmatrix','blosum30');
end
Score = 152.2
Identities = 119/363 (33%), Positives = 252/363 (69%)
  1  MAYNKLNVFHWHLVDDPSFPYESFTFPELMRKGSYNPVTHIYTAQDVKEVIEYARLRGIRVLAE
     ||: |||:||||::|::|||:|    |||:: |:|::  ::|| :||:||:||:|:|||||: |
  1  MALVKLNTFHWHITDSHSFPLEVKKRPELHKLGAYSQR-QVYTRRDVAEVVEYGRVRGIRVMPE

 65  FDTPGHT-LSWG-PGIPGLL-TPCYSGSEPSGTFGPVNPSLNNTYEFMSTFFLEVSSVF-PDFY
     ||:|:|:  :|  ::::::: :: ::: : : : |:::|::| :|:::: ::  : : | ||::
 64  FDAPAHVGEGWQHKNMTACFNAQPWKSFCVEPPCGQLDPTVNEMYDVLEDIYGTMFDQFNPDIF

125  LHLGGDEVDFTCWKSNPEIQDFMRKKGFG-E--DFKQLES-FYIQTL--LD-IVSSYGKGYVVW
      |:|||||: :||:|:::|| :|:|:|:| |  ||::| : | :::|  :| ::::     ::|
128  -HMGGDEVSTSCWNSSQPIQQWMKKQGWGLETADFMRLWGHFQTEALGRVDKVANGTHTPIILW

182  QE-VFDNK-V-K-IQPD-TIIQVWREDI-P-VNYMKELEL-VTKAGFRAL-L---SAPWYLNRI
     :: : : : : : : |:  |||:|   : | |: : |  : :: ::: || |   :| |::: :
191  TSGLTEEPFIDEYLNPERYIIQIWTTGVDPKVKKILERGYKIIVSNYDALYLDCGGAGWVTDGN

234  SY-GP--DWKDFYVVEPLAFEGTPEQKALVIGGEACMWGEYVDNTNLVPRLWPRAGAVAERLWS
     :: :|   |:::|  :  :::|  |:   |:|:|: :|:| :|  :|  |:||||:|:||||||
255  NWCSPYIGWQKVYDNSLKSIAGDYEH--HVLGAEGAIWSEQIDEHTLDNRFWPRASALAERLWS

295  NKLTSDLTFAYER-LSHFRCELLRRGVQAQPLNVGFCEQ-EFE
     |: ::    | :| | | |  |:  |: |: :   :| | | |
317  NP-AEGWRQAESRLLLH-RQRLVDNGLGAEAMQPQWCLQNEHE
Plot the scores, calculate the parameters of the distribution and overlay the PDF on the bar chart.
figure
hist(localscores,buckets)
xlabel('Score');
ylabel('Number of Sequences');
hold on;
stem(lscore,1,'r')
parmhat = evfit(localscores)
x = min(localscores):max([localscores;lscore]);
y = evpdf(x,parmhat(1),parmhat(2));
[v, c] = hist(localscores,buckets);
binWidth = c(2) - c(1);
scaleFactor = n*binWidth;
plot(x,scaleFactor*y,'r');
hold off;
parmhat =

   40.4341    4.1376
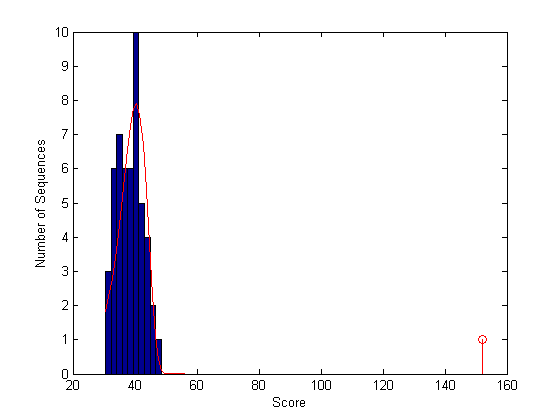
You might like to experiment to see if there are significant differences in the distribution of scores generated with randperm and randseq.
With the local alignment it appears that the alignment is statistically significant. In fact, looking at the local alignment shows a very good alignment for the full length of the Hexo1 sequence.