Here are some examples of 2-D line plots in MATLAB.
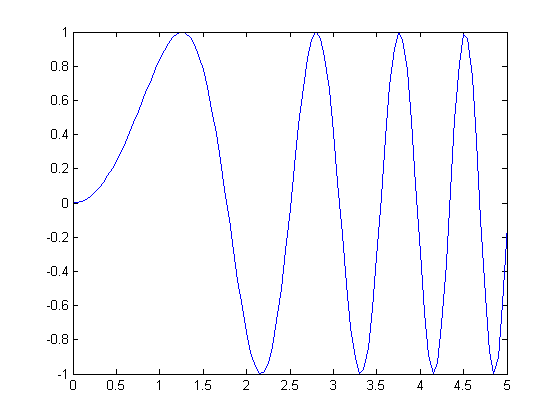
x=0:0.05:5;
y=sin(x.^2);
plot(x,y);
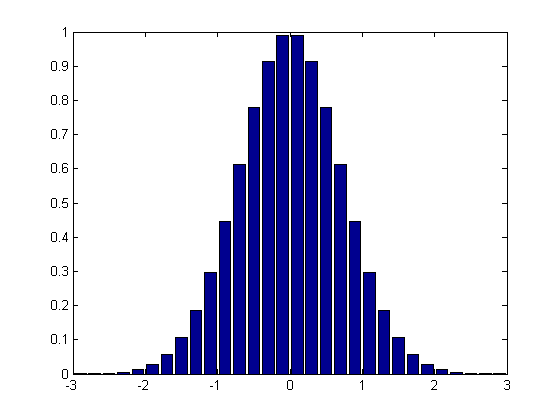
x = -2.9:0.2:2.9;
bar(x,exp(-x.*x));
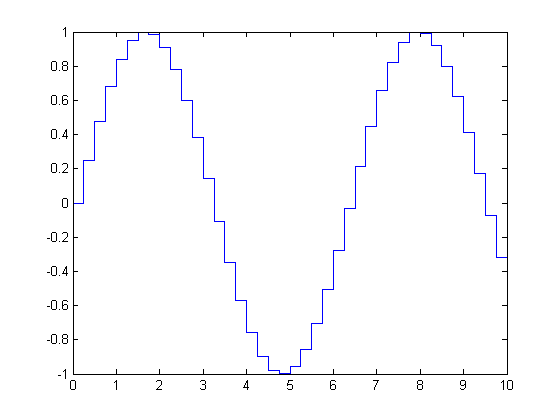
x=0:0.25:10;
stairs(x,sin(x));
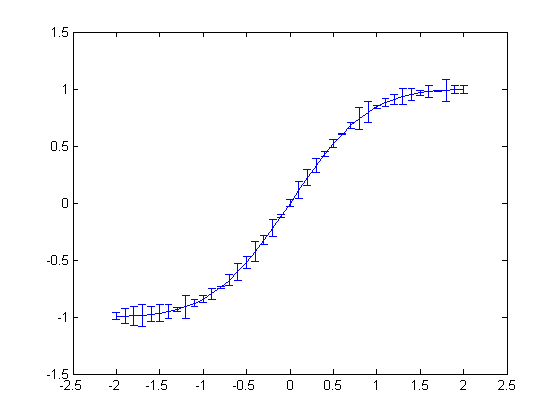
x=-2:0.1:2;
y=erf(x);
e = rand(size(x))/10;
errorbar(x,y,e);
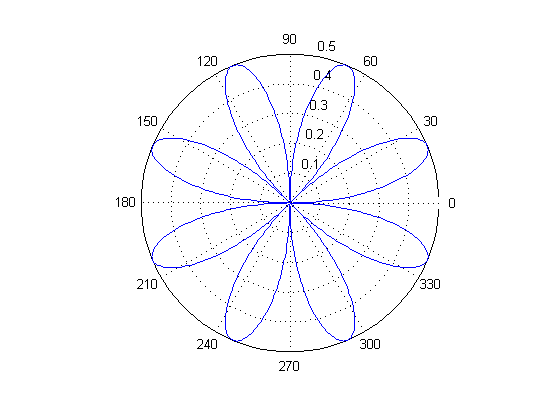
t=0:.01:2*pi;
polar(t,abs(sin(2*t).*cos(2*t)));
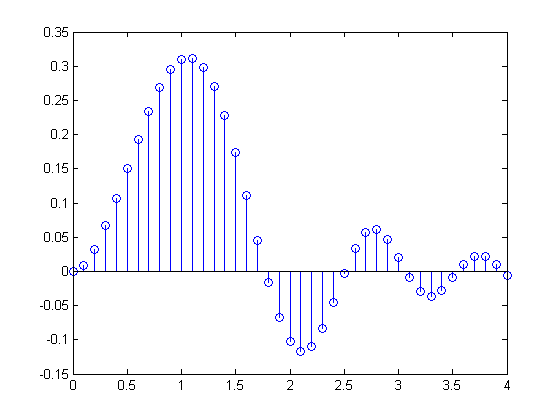
x = 0:0.1:4;
y = sin(x.^2).*exp(-x);
stem(x,y)