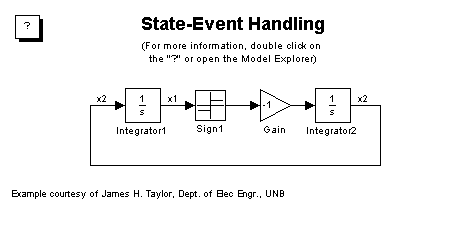
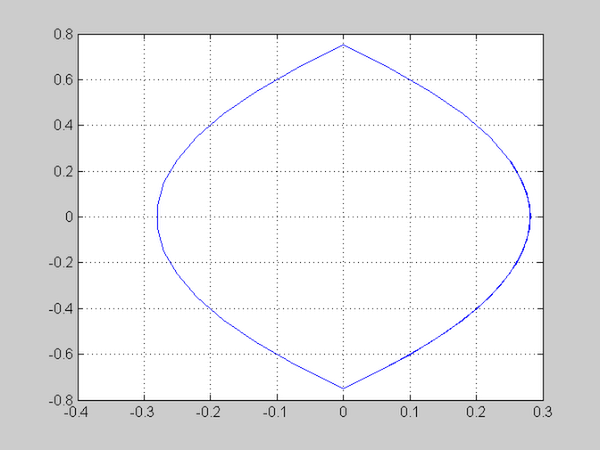
This demonstrations shows state event handling. Run the simulation and see the phase plane plot, where the state x1 is along the X-axis and the state x2 is along the Y-axis.
Published with MATLAB® 7.0.2