|
|
|
Presented at the U.S. GLOBEC Northeast Pacific
Scientific Investigator Meeting |
|
|
|
Robert C. Groman |
|
10-12
January 2006 |
|
|
|
|
U.S. GLOBEC Program Office and Data Management
Office for Georges Bank |
|
DMO supports NEP and SO Projects |
|
NEP responsibilities shared with H. Batchelder |
|
Follow the data button |
|
|
|
|
|
|
|
Support for investigators at geographically
different sites |
|
Client support for most (all?) computing
platforms (PC, Macintosh, Unix, Linux) – Web based, using standard browsers |
|
Distributed data servers |
|
Data contributor directly controls data |
|
Always up to date |
|
Easier to grow computing resources |
|
But, can
also use a central facility if one wishes |
|
|
|
|
Dissemination to scientific investigators on a
timely basis |
|
Data served when "useful" |
|
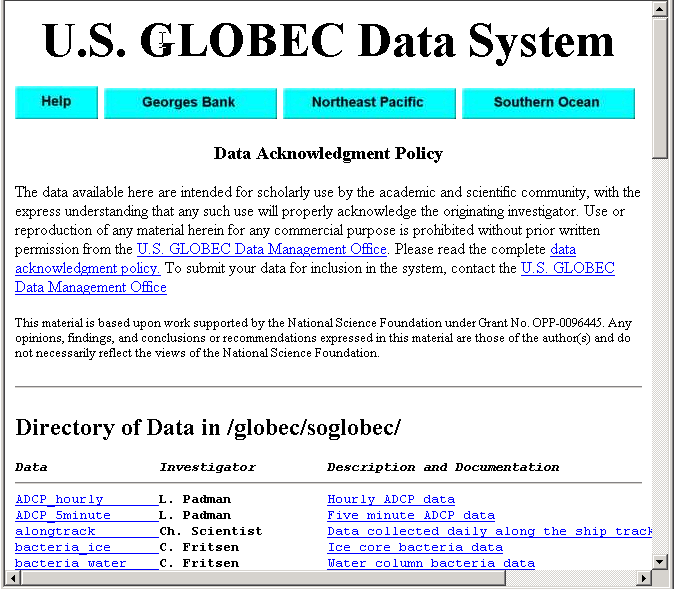
Available to others outside the Program |
|
Data use must follow data acknowledgement policy |
|
Handle data, model output and images |
|
Relationship to OPeNDAP (DODS) and value added
web sites |
|
|
|
|
|
|
|
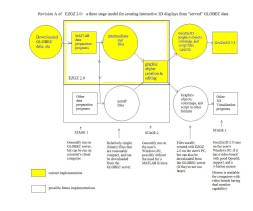
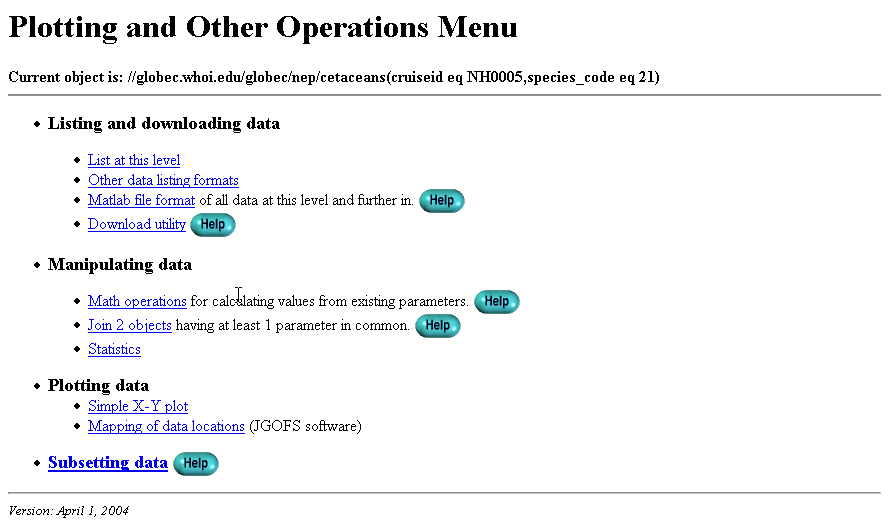
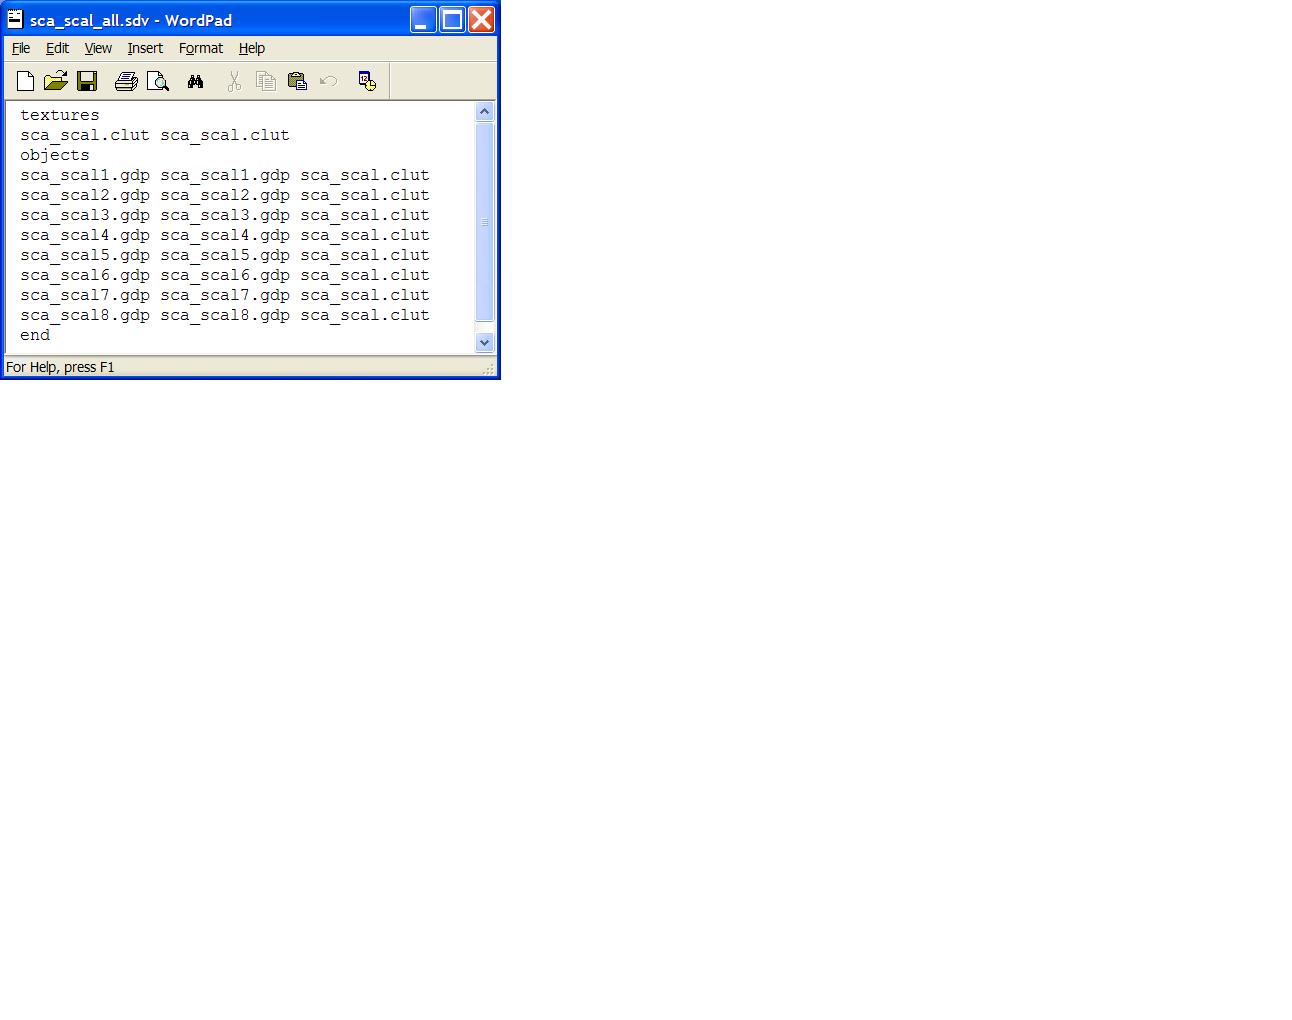
What’s a data object? |
|
What are methods? |
|
Default method (defgb) |
|
Restructuring (rs) |
|
Combining with Perl scripts |
|
|
|
|
|
|
|
|
|
|
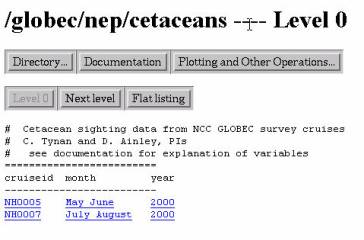
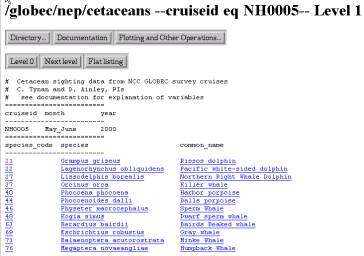
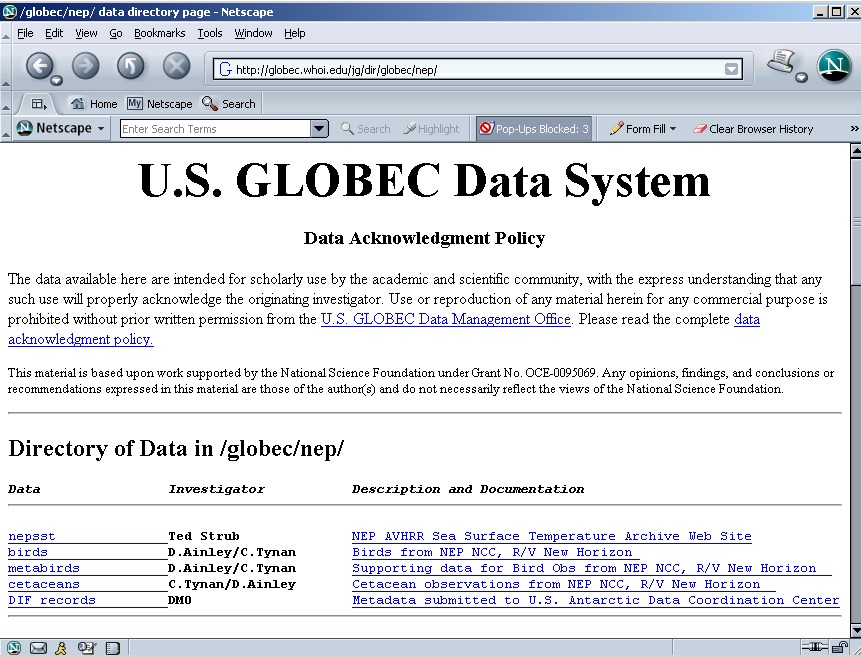
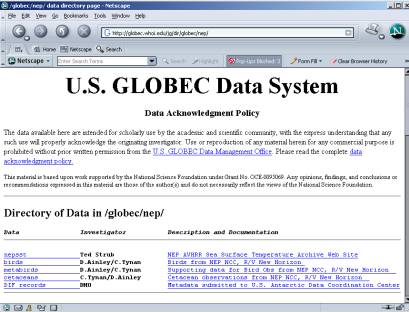
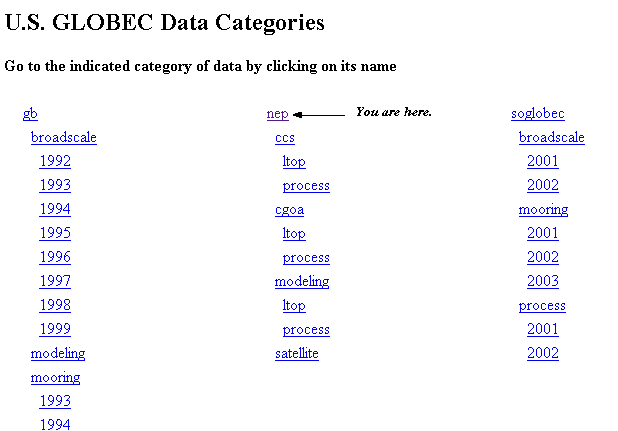
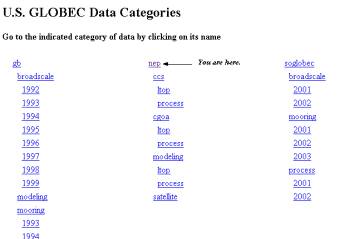
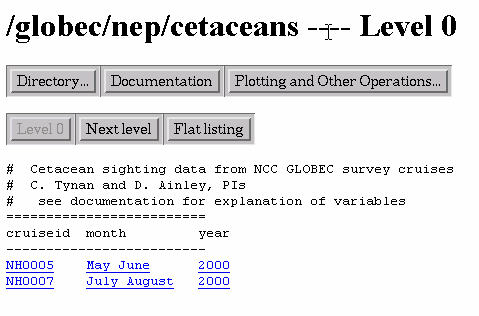
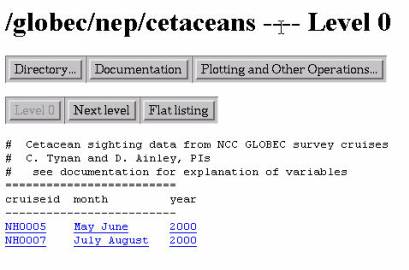
Metadata is crucial for others to be able to use
other investigator’s data. |
|
This information comes from the contributing
investigator(s). |
|
To see the metadata, click on the text in the last
column of the directory or on the “Documentation” button. |
|
|
|
|
|
|
|
Consistent field names |
|
You may get a call from George H. |
|
Global Change Master Directory (GCMD) and Directory Interchange Format (DIF)
record (for data discovery) |
|
Enhancing JGOFS/GLOBEC software to use XML-based
“info” file |
|
|
|
|
|
|
|
|
|
|
|
|
|
|
|
|
|
|
|
|
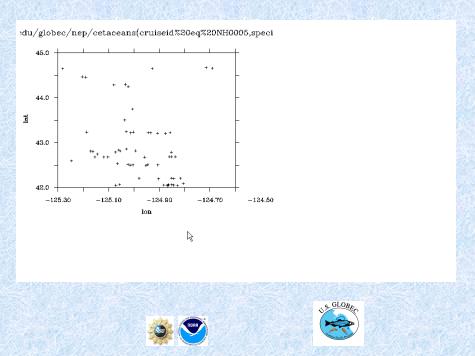
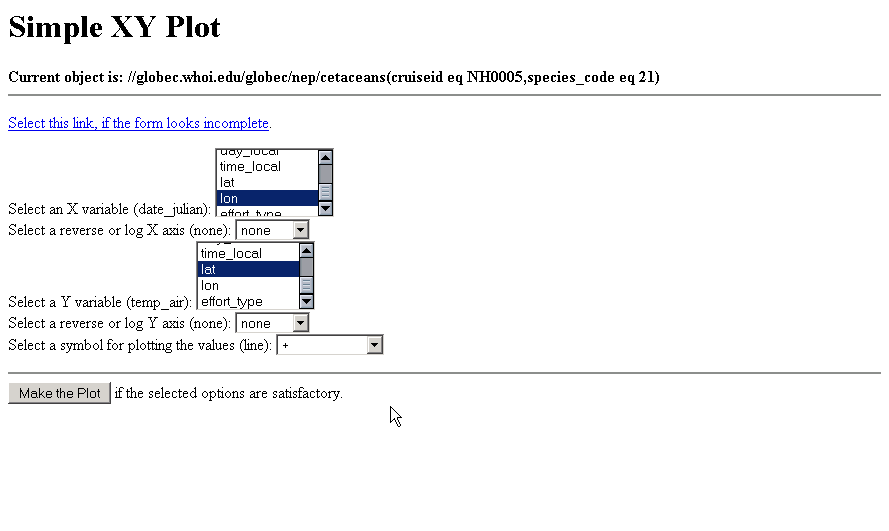
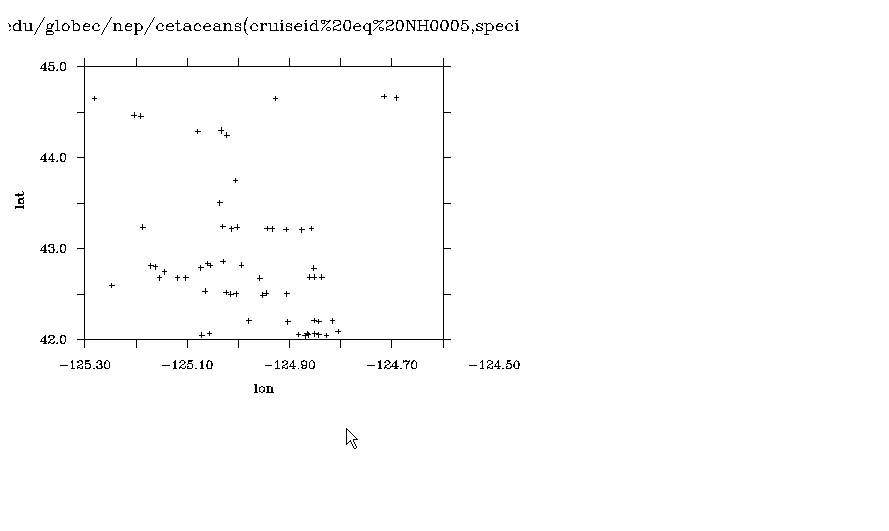
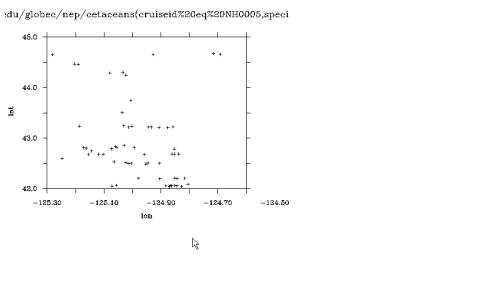
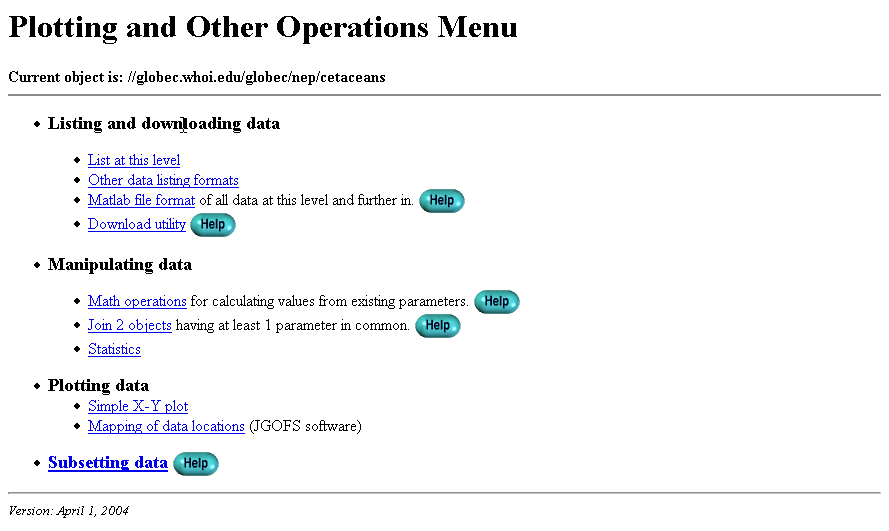
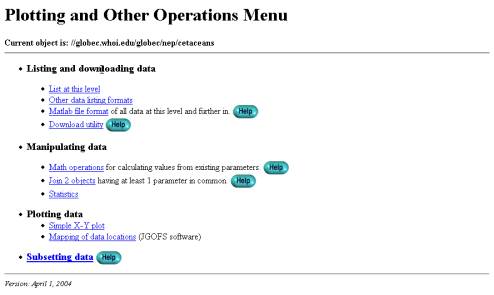
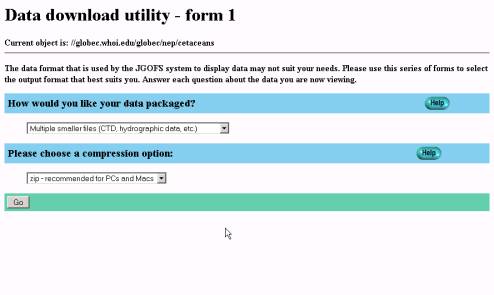
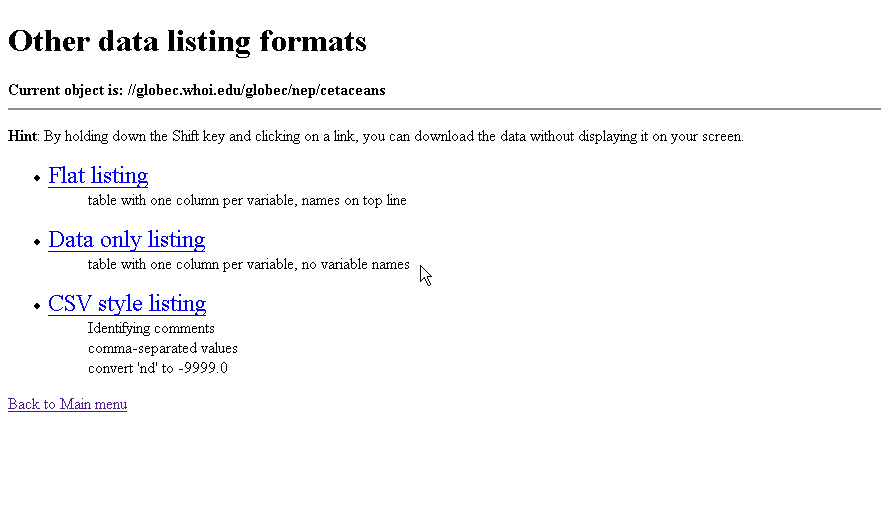
Selecting just the field names you want |
|
Try an on-line example |
|
|
|
|
|
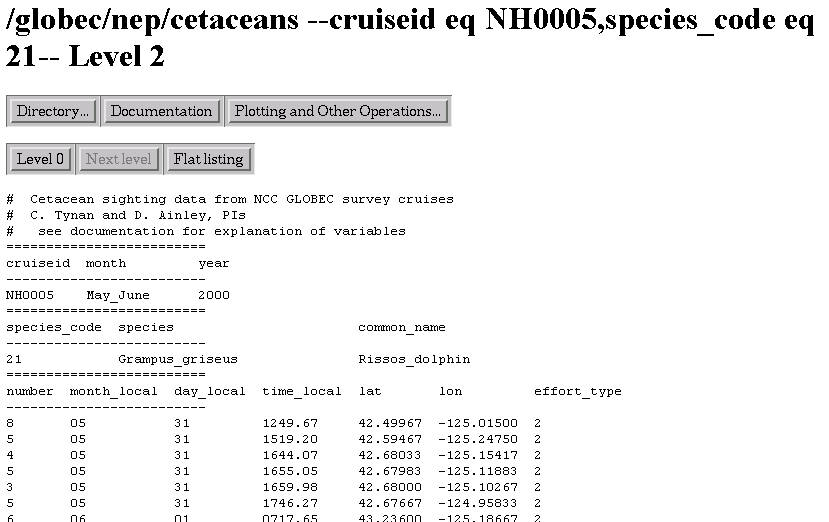
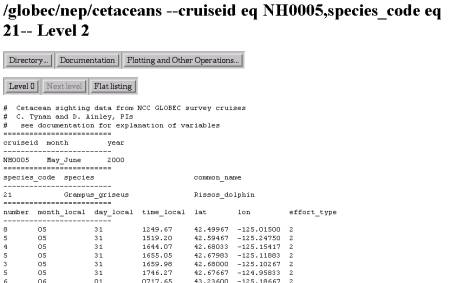
Selecting out data with certain values |
|
temp < 4 and depth > 120 |
|
taxon contains calanus |
|
Try an on-line example |
|
|
|
|
|
|
|
|
|
|
|
|
Set up by DMO several years ago. |
|
|
|
DMAG advises DMO on issues such as field names
and |
|
units. |
|
|
|
Membership: D. Allison, H. Batchelder, J.
Bisagni, |
|
C. Flagg, K. Garrison, R. Goldsmith, B. Groman, |
|
G. Heimerdinger, E. Hofmann, S. Howard, J.
Manning, |
|
W. Sass, P. Smith |
|
|
|
|
|
|
|
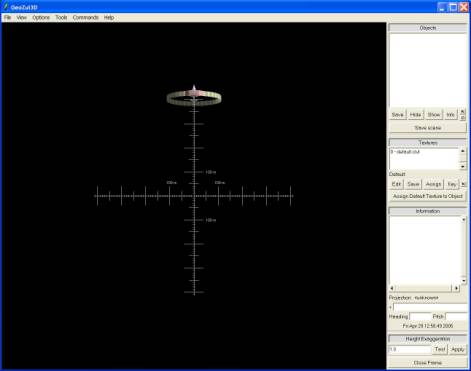
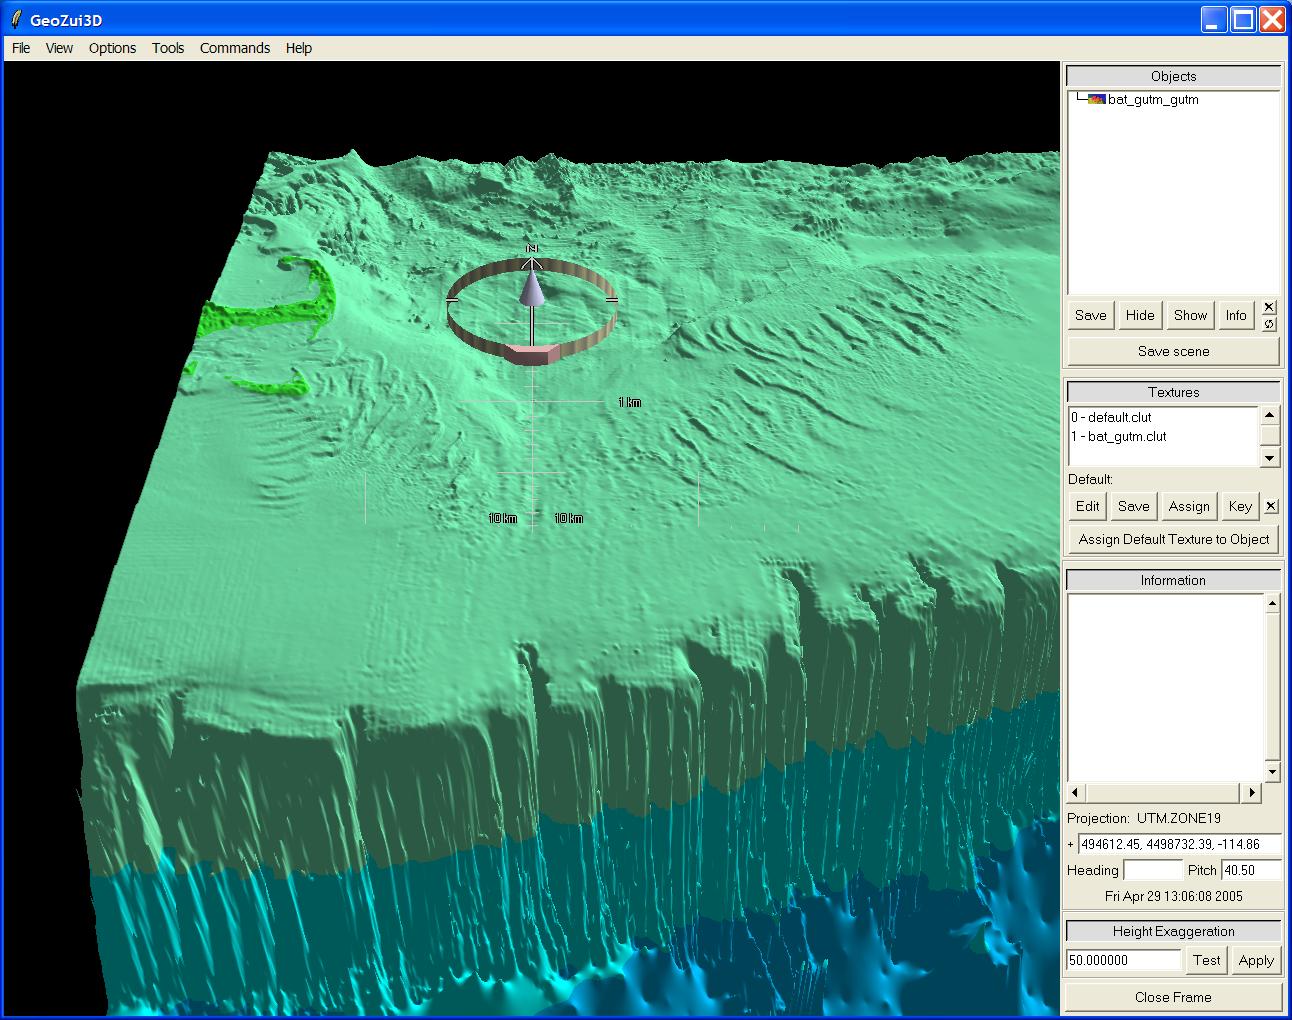
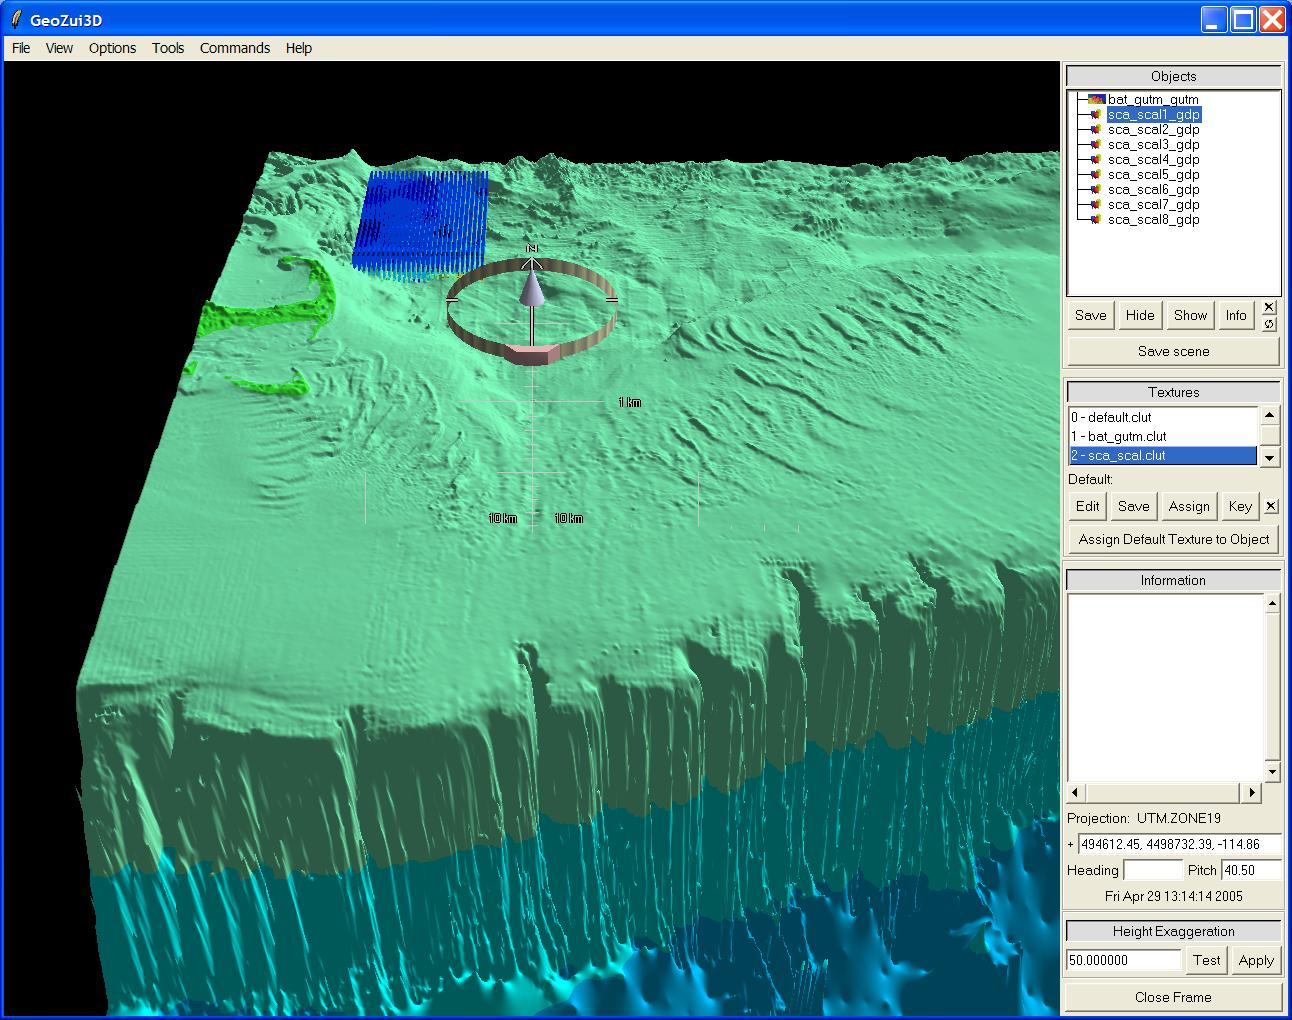
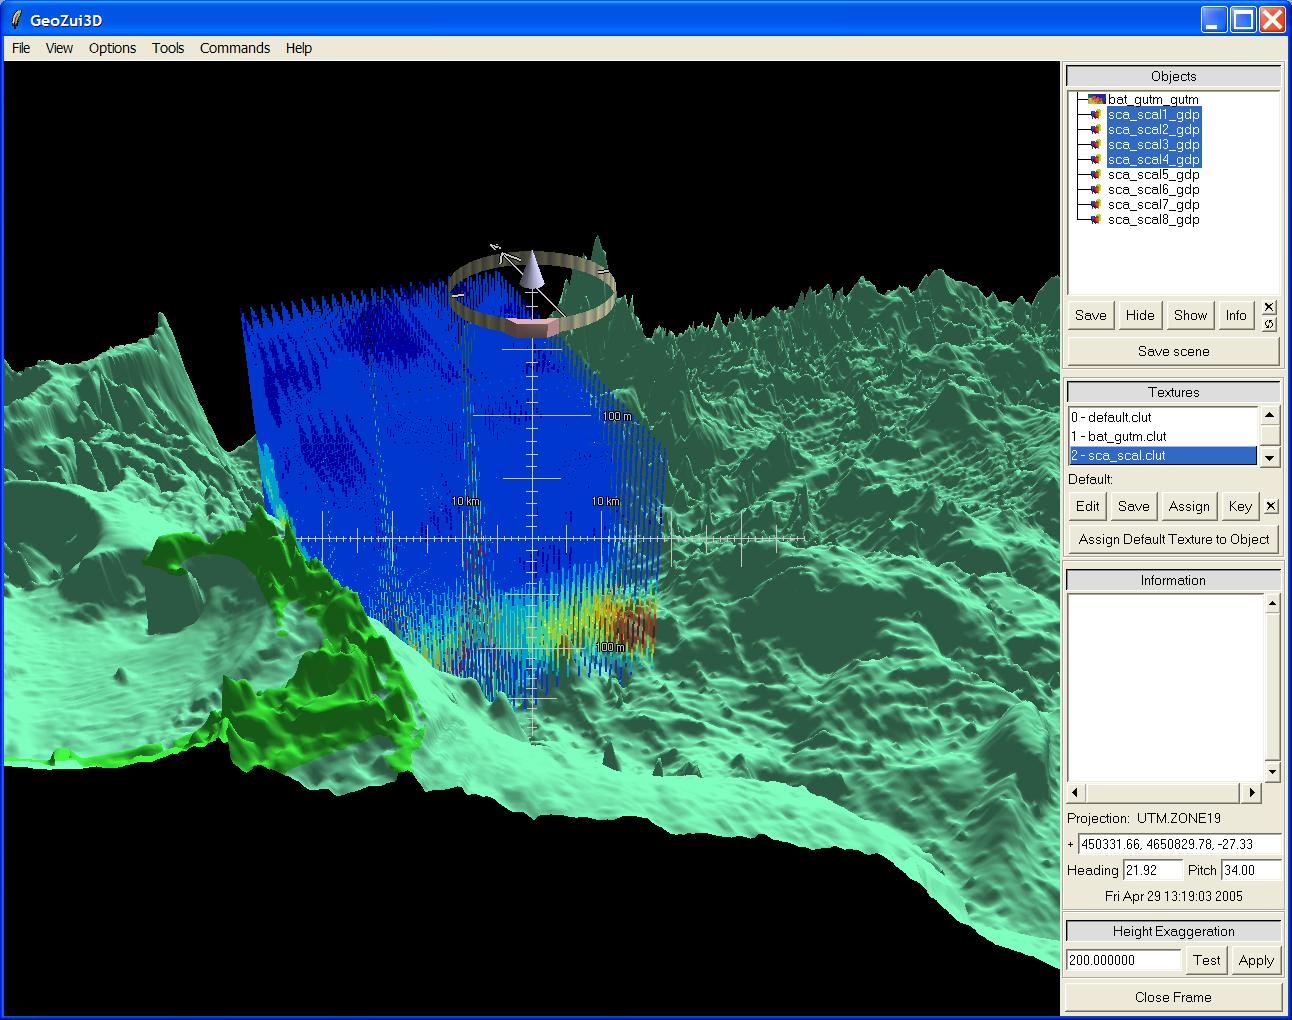
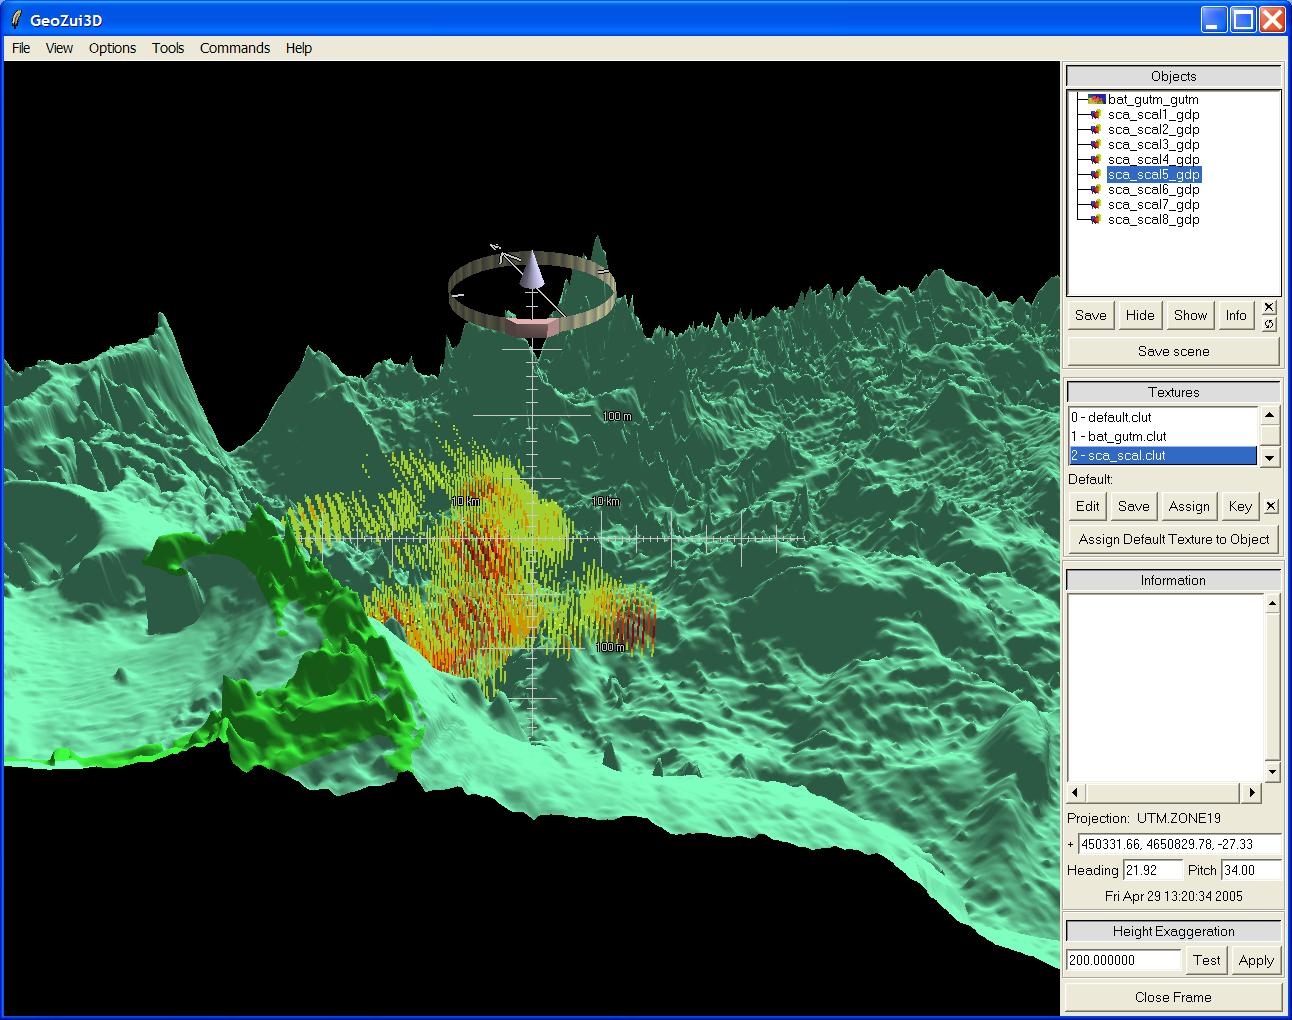
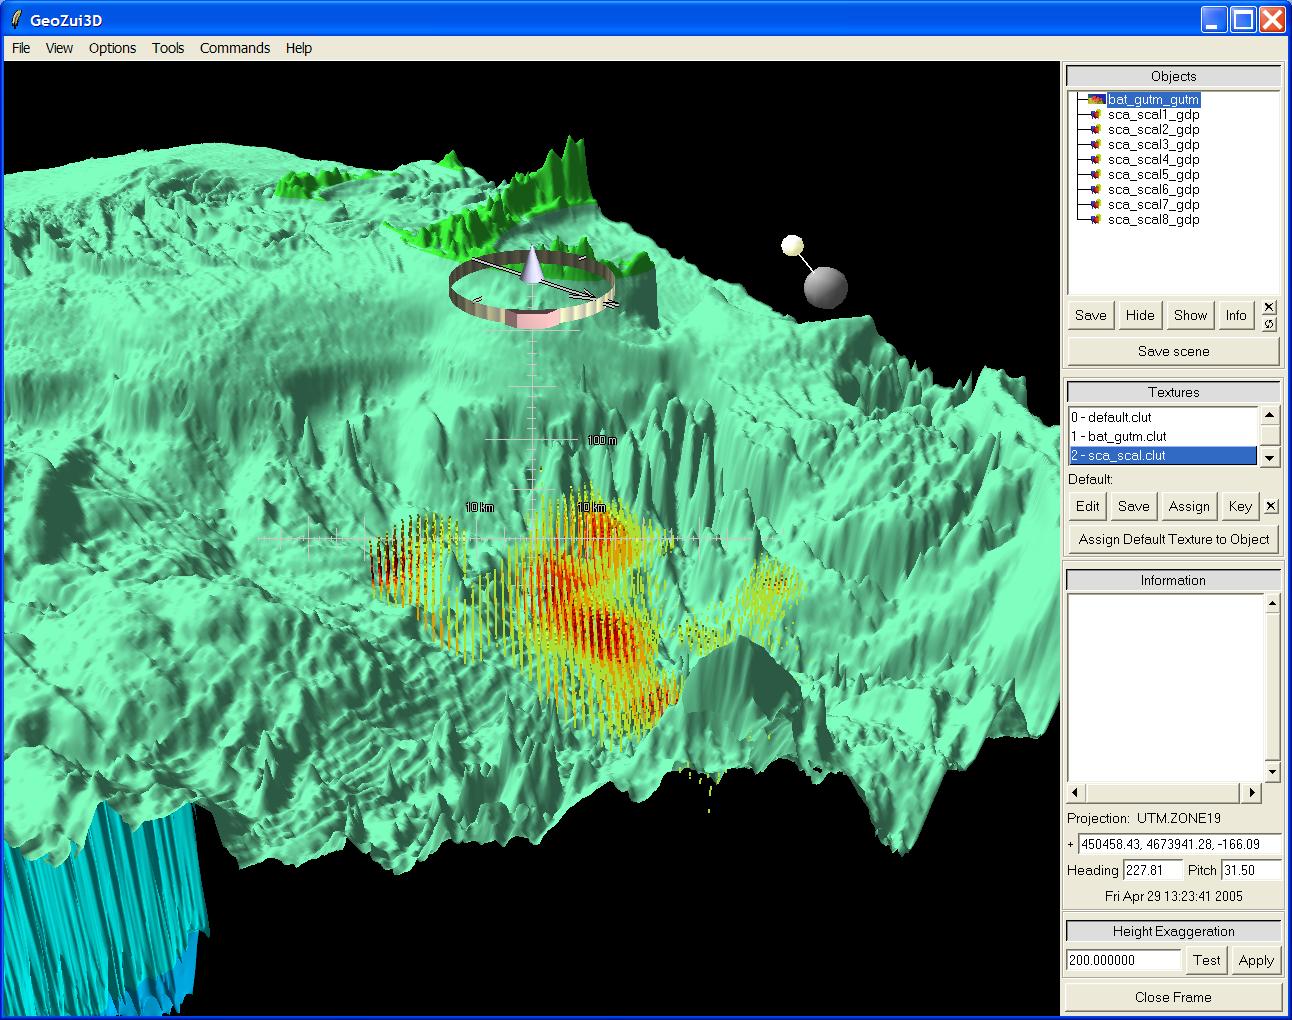
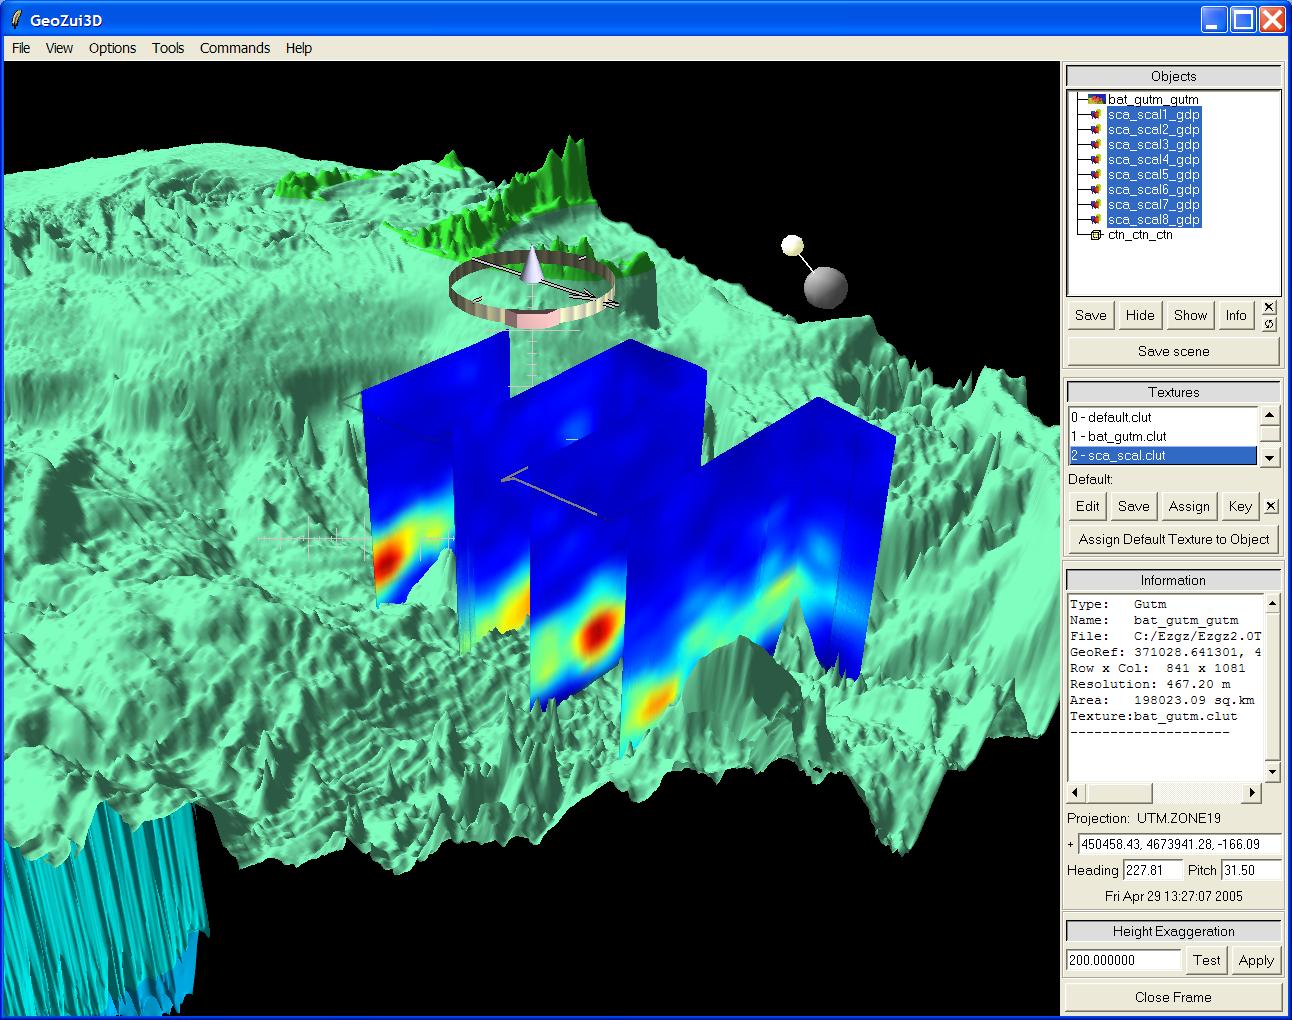
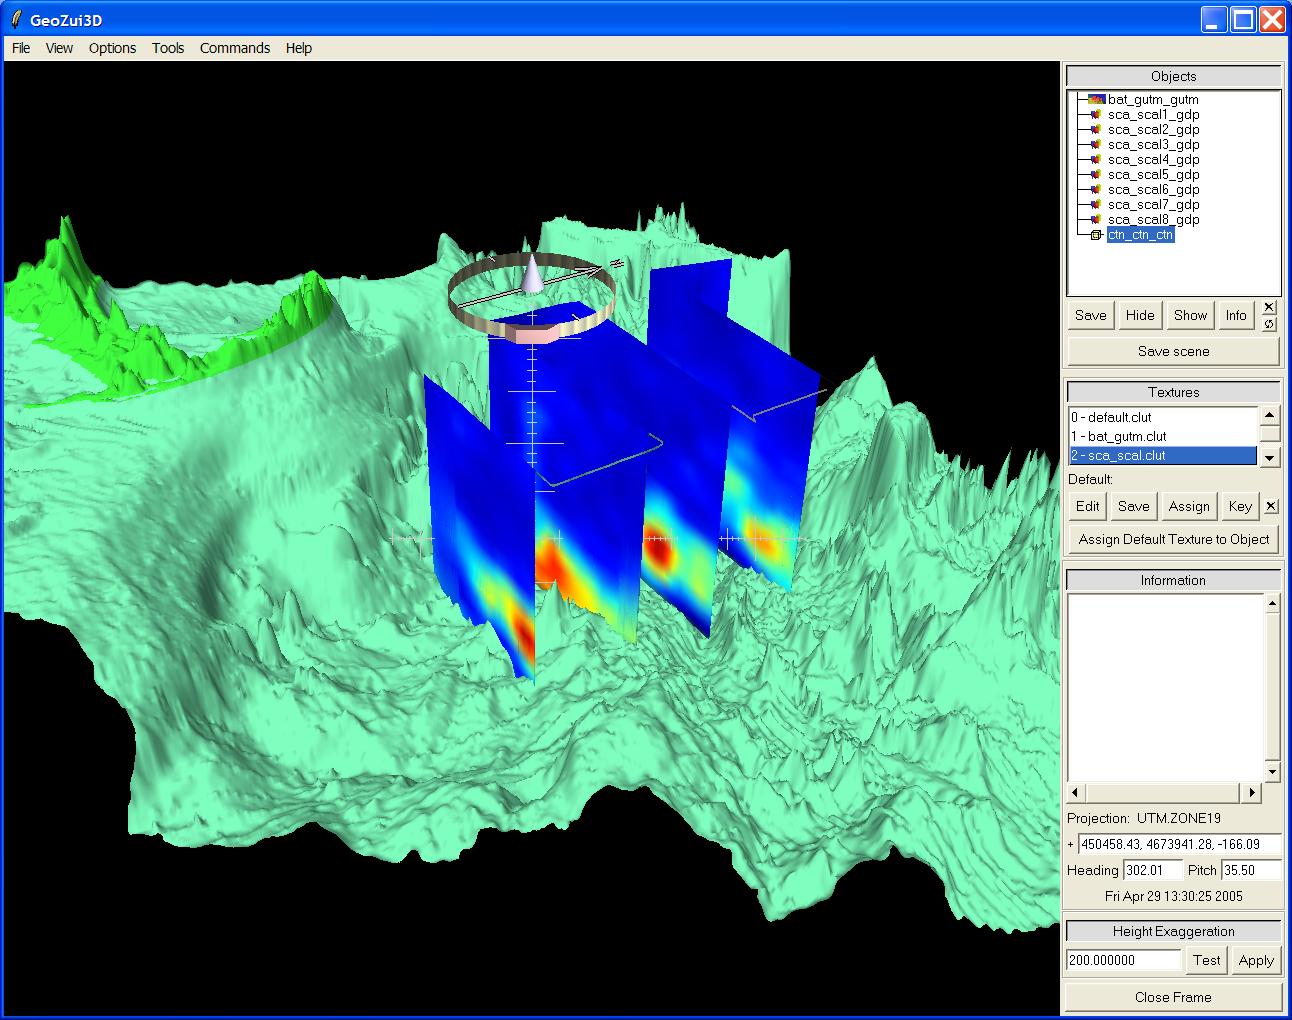
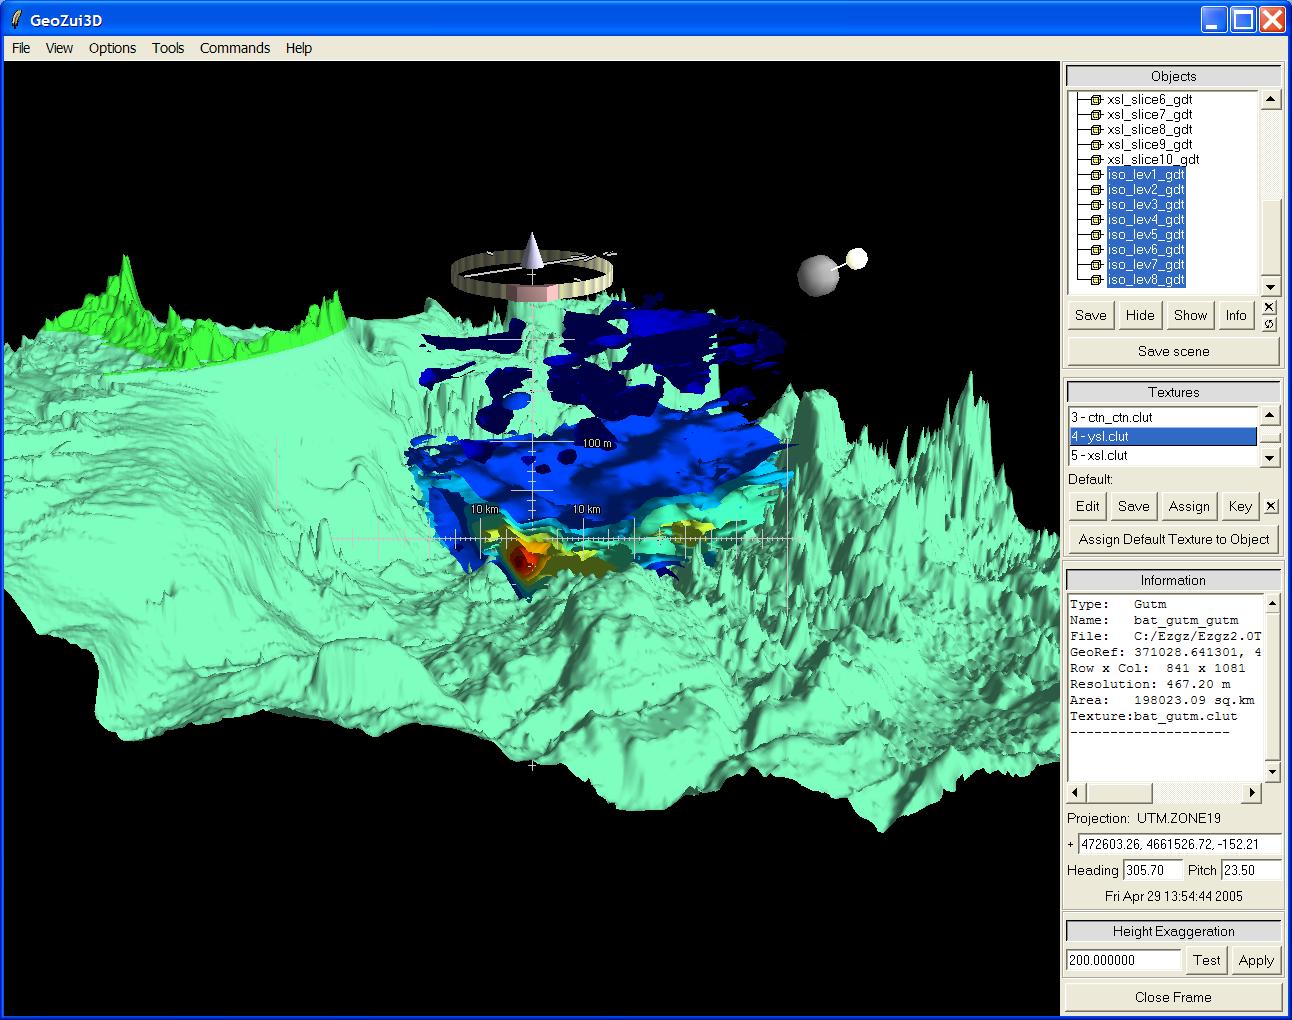
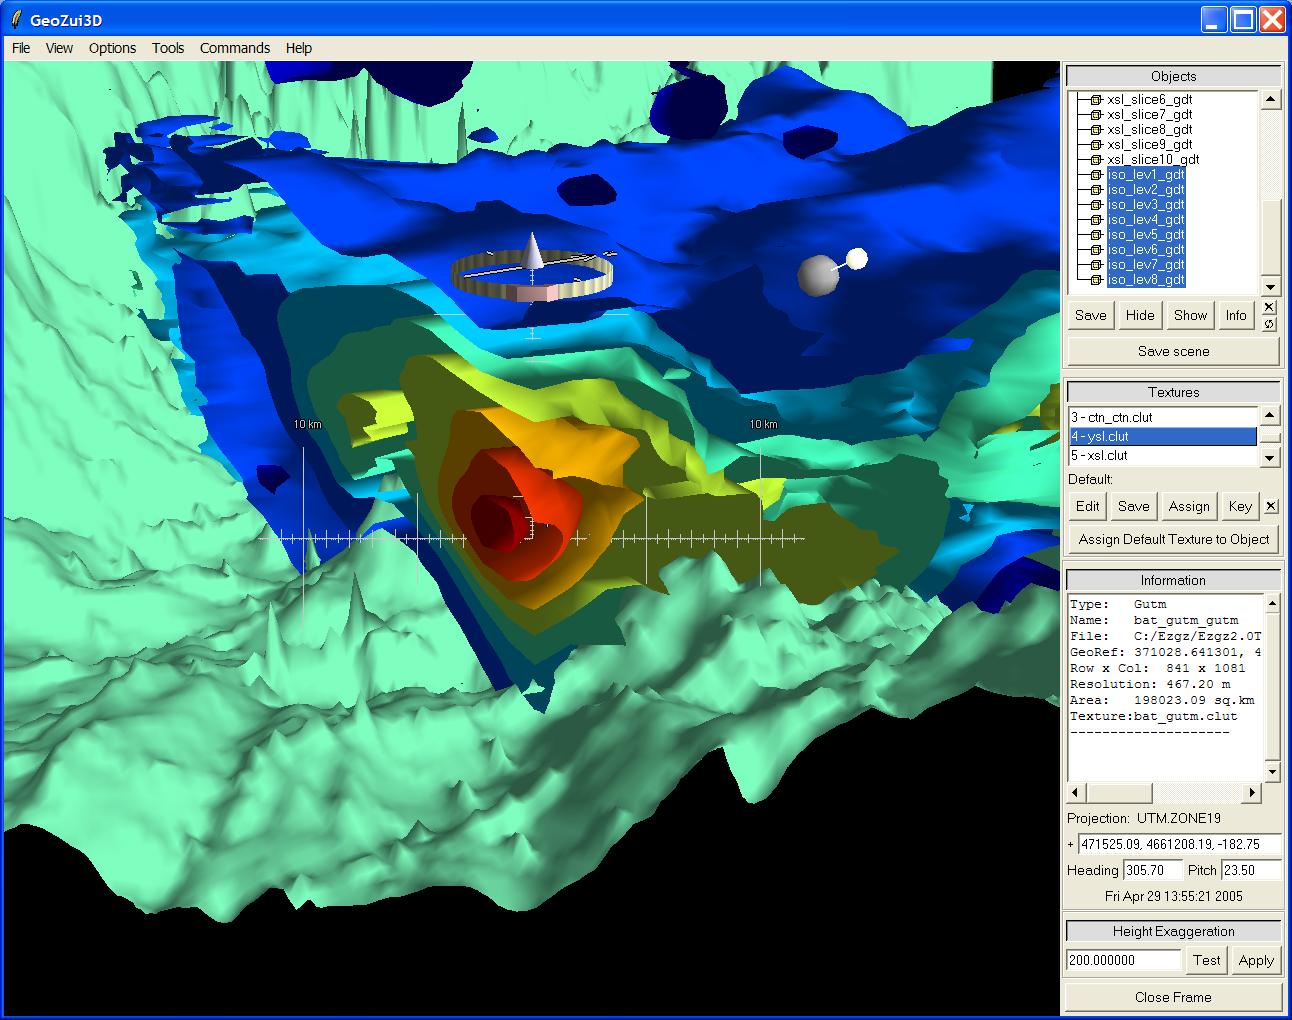
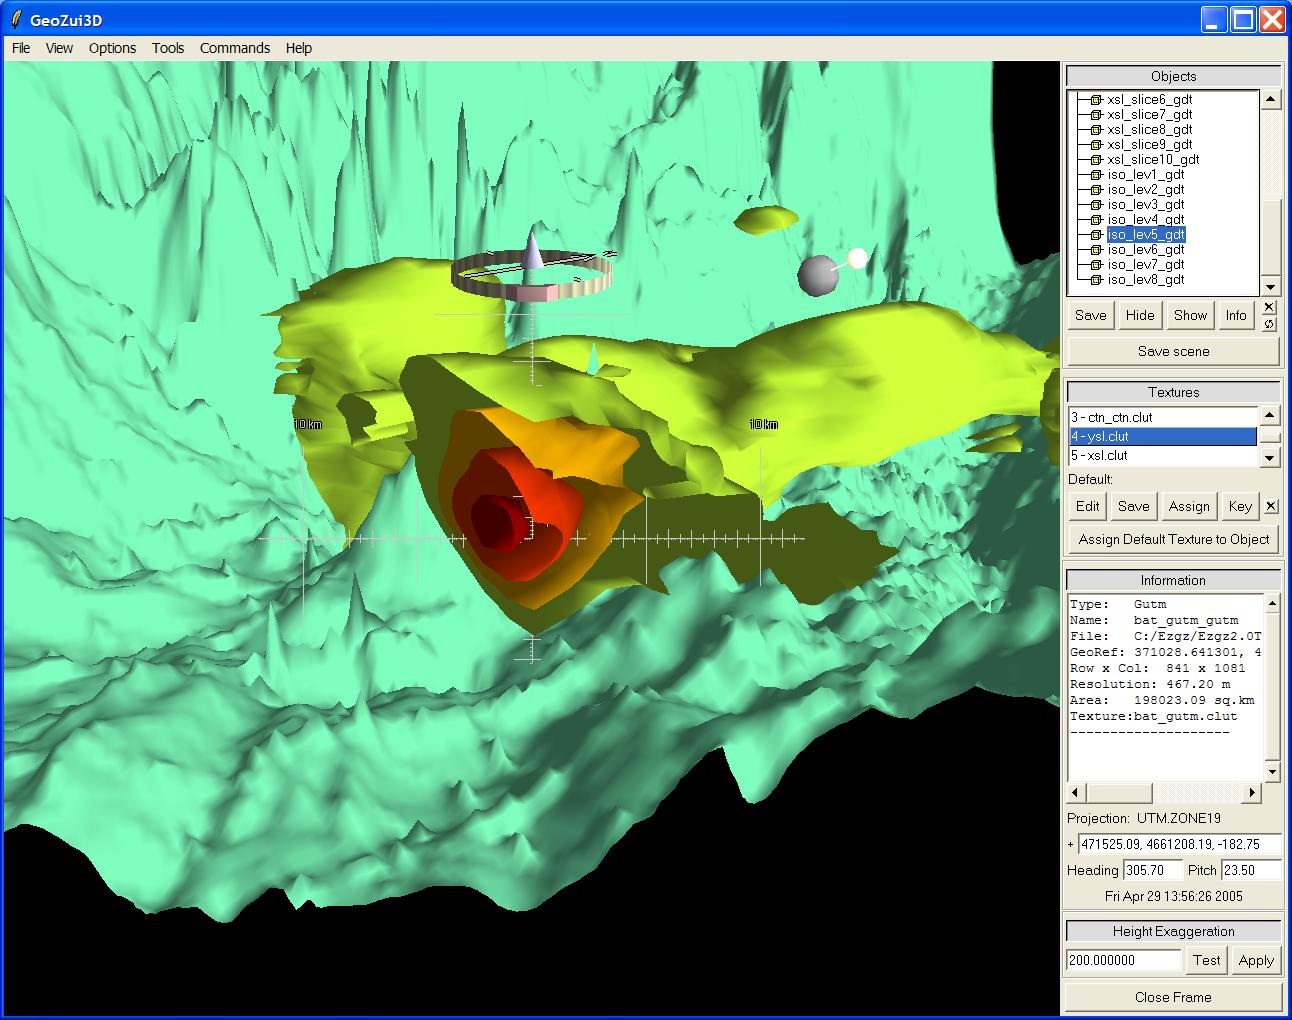
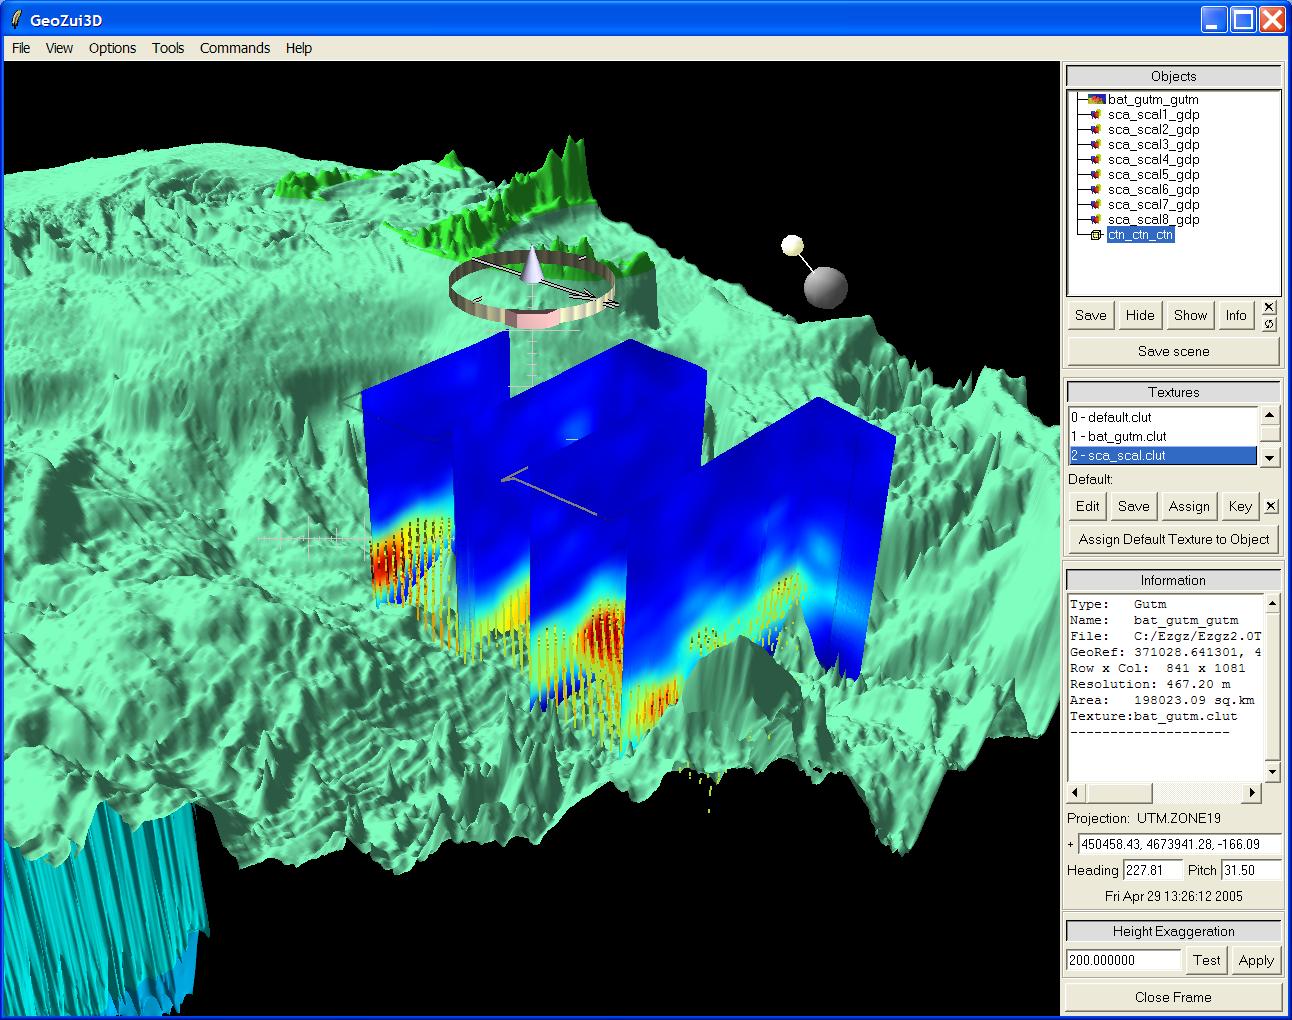
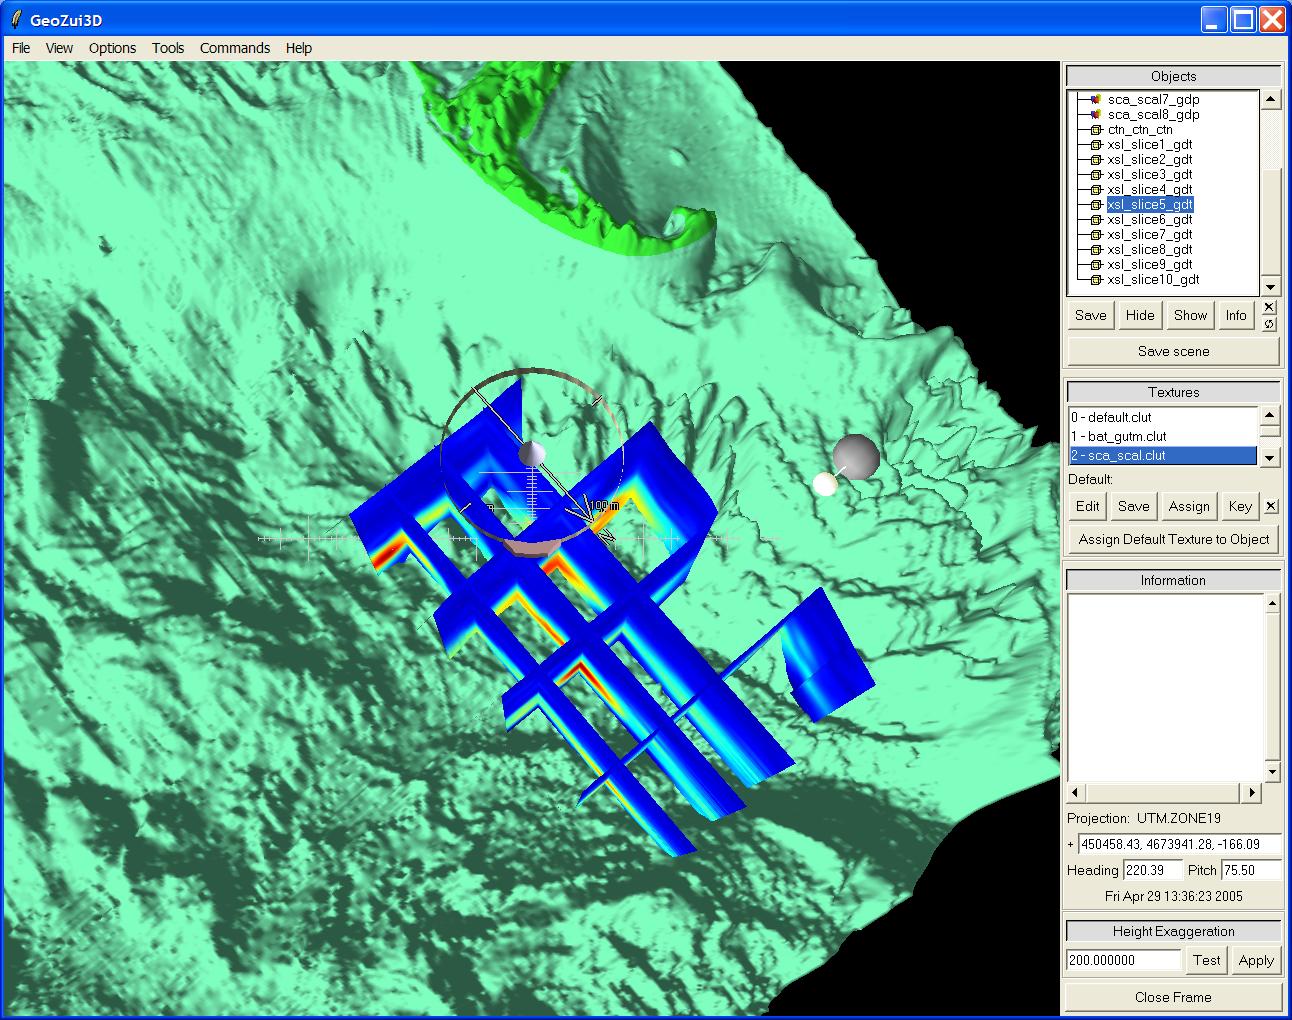
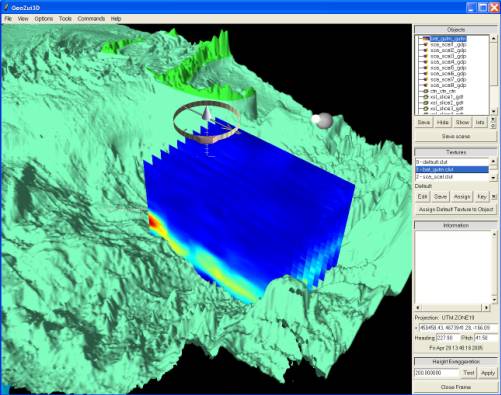
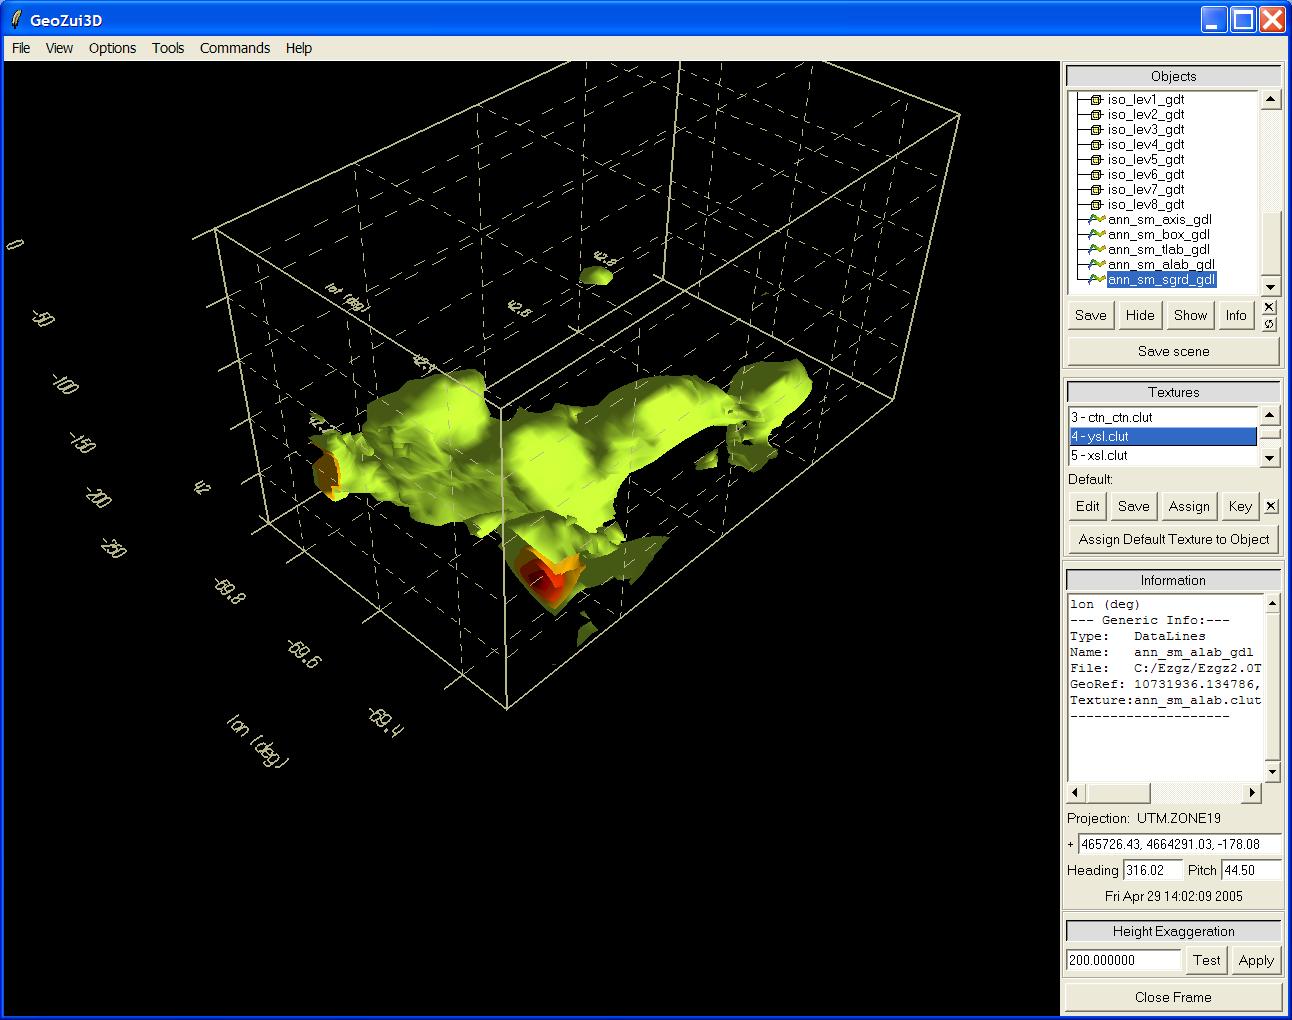
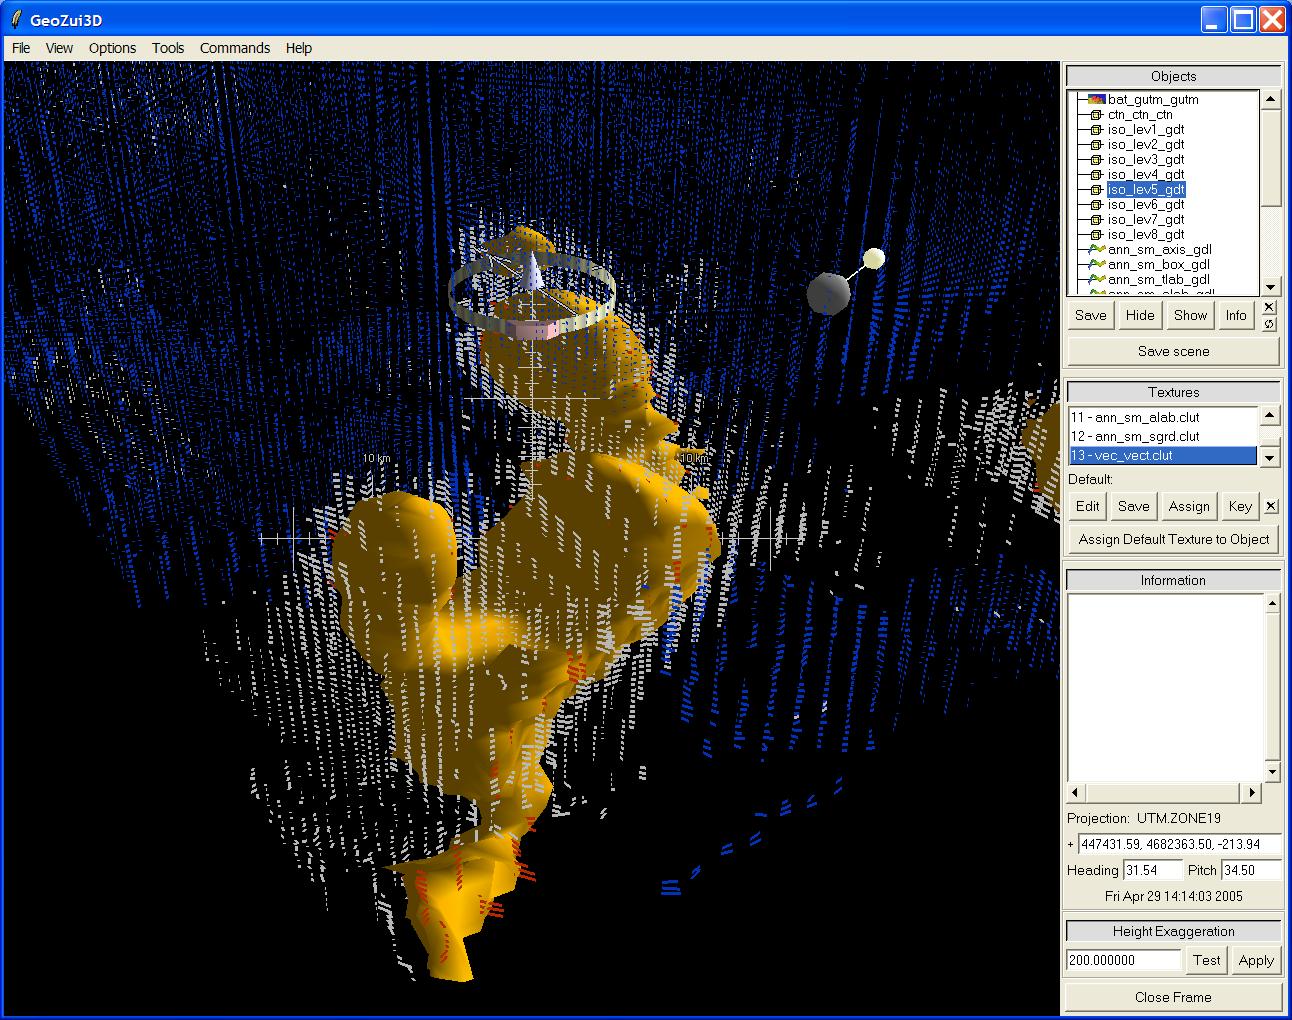
GeoZui3D |
|
EZGZ interface between JGOFS/GLOBEC and GeoZui3D |
|
EasyKrig (download) |
|
Digitizer application |
|
|
|
|
Acoustic backscatter data (curtain plots) |
|
Arbitrarily spaced scalar & vector data |
|
Axes, labels, grids, bounding boxes |
|
Underlying bathymetry surfaces |
|
Multiple color maps for each object |
|
Point-and-click object identification |
|
3D thumbnails and list boxes for easier
selection and previewing of variables |
|
|
|
|
|
|
|
|
|
|
|
|
|
|
|
|
|
|
|
|
|
|
|
|
|
|
|
|
|
|
|
|
|
|
|
|
|
|
|
|
|
|
|
|
|
|
|
|
|

 Notes
Notes