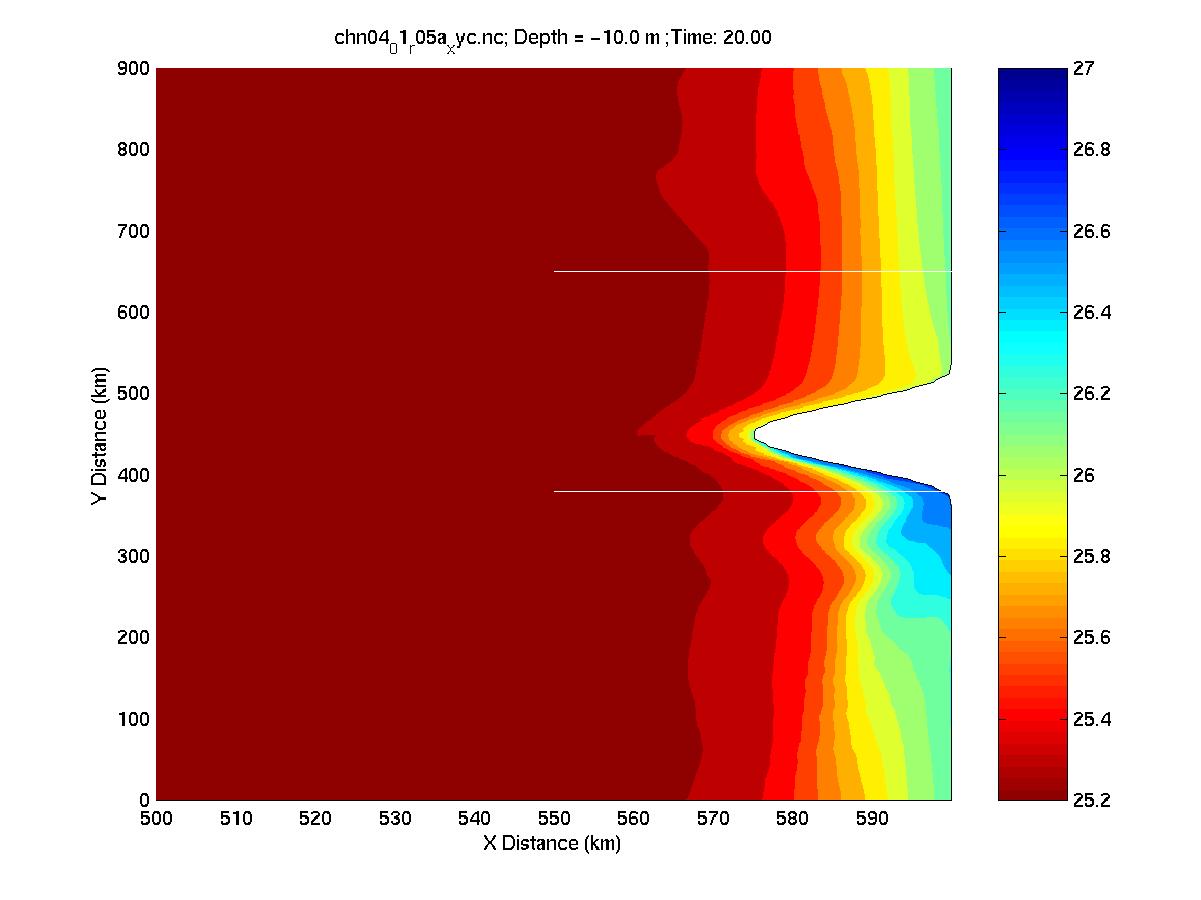
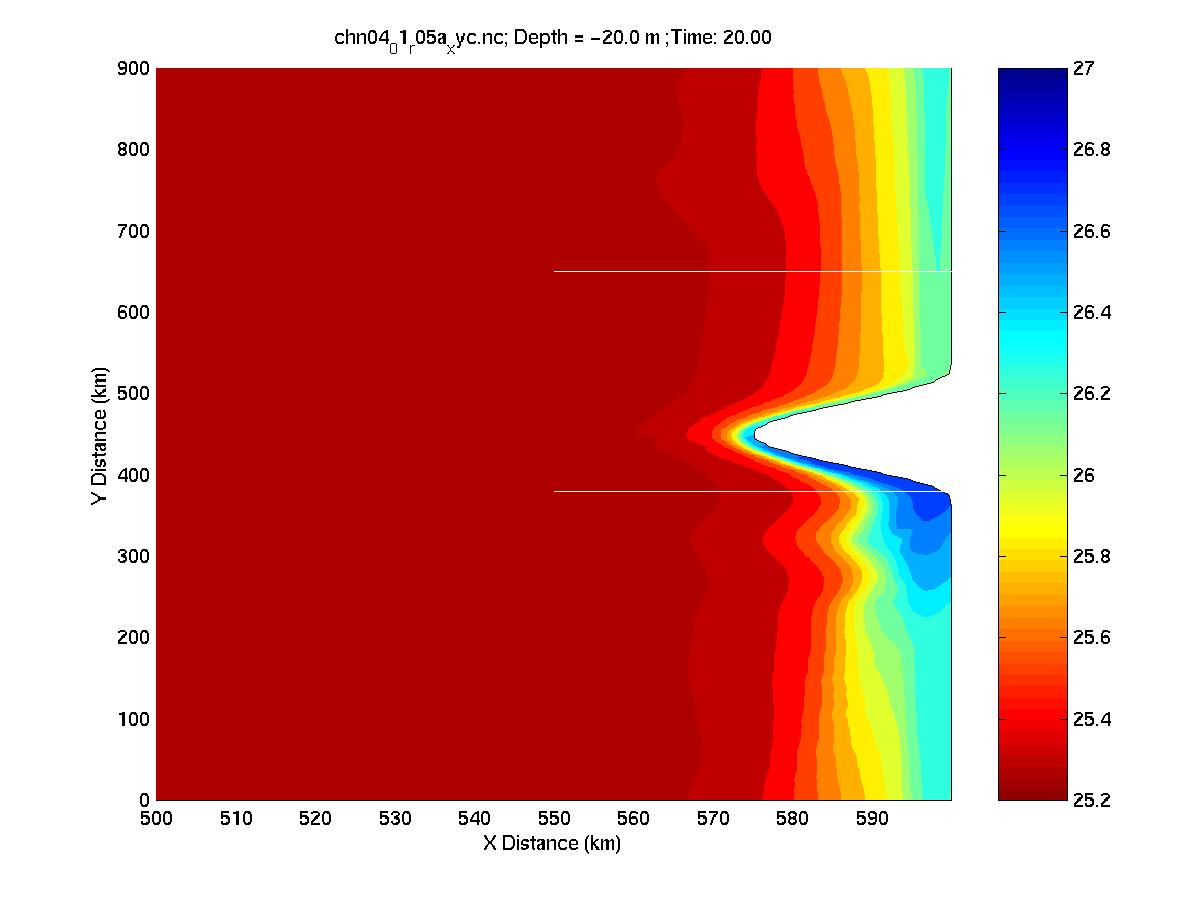
| X-Y Plane view at Z=-10 meters | X-Y Plane view at Z=-20 meters |
|
|
| Case Name | Characteristics |
|---|---|
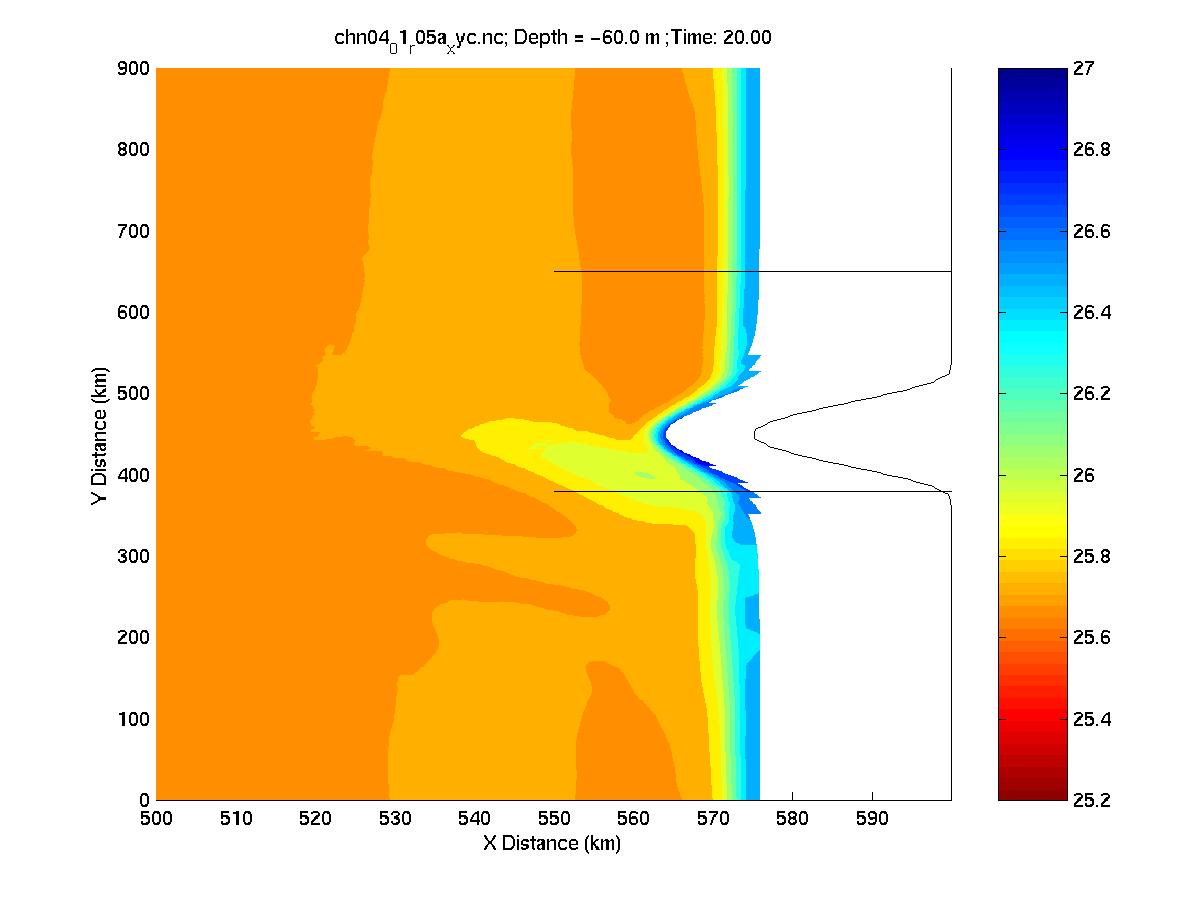
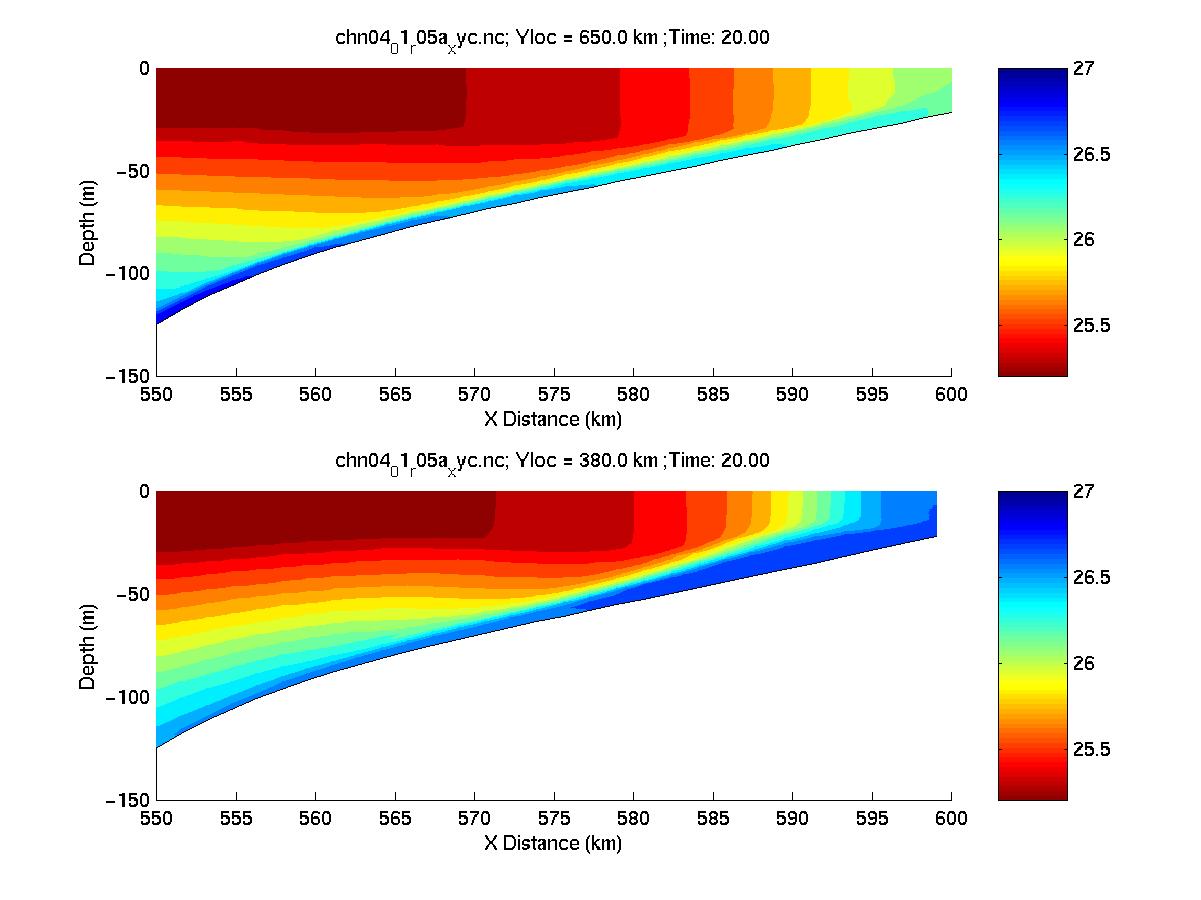
| chn04_01_r05a_xyc | Idealized Geometry w/ single cape Domain: 600 km in X; 900 km in Y; 900 m in Z 30 day simulation Wind Stress: Sinusoidal Output: U,V,W Velocities & Density |
|
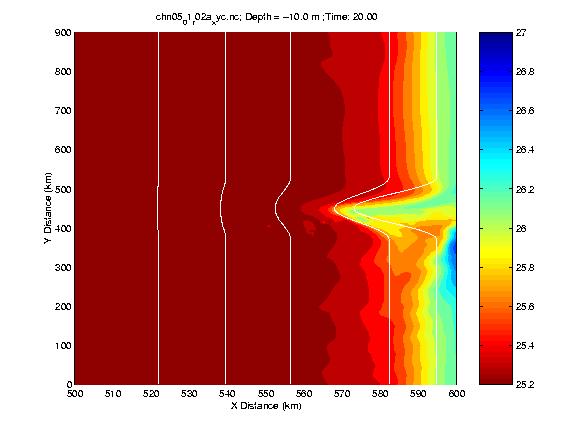
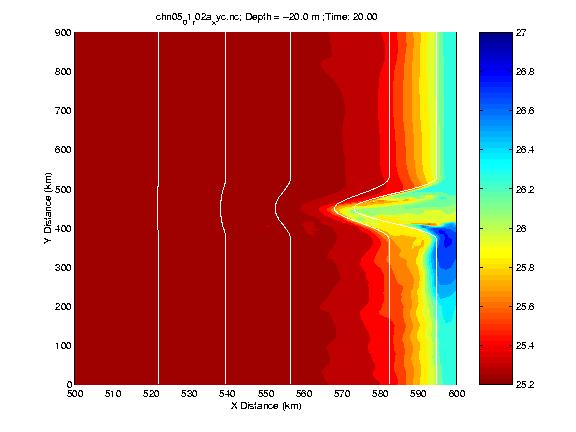
The table below provides links to selected jpg plots of the SEOM model results. A better way to visualize the results is using animated movies of the simulation. Larger images and FLC animations are available for selected viewing orientations (2D slices) by clicking the images displayed below. Information about the FLC animation format and software for playing FLC animations is available at http://crusty.er.usgs.gov/flc.html.
|
| X-Y Plane view at Z=-10 meters | X-Y Plane view at Z=-20 meters |

|

|
| X-Y Plane view at Z=-60 meters | X-Z Plane views at Y=380 and 650 km |
|
|
|
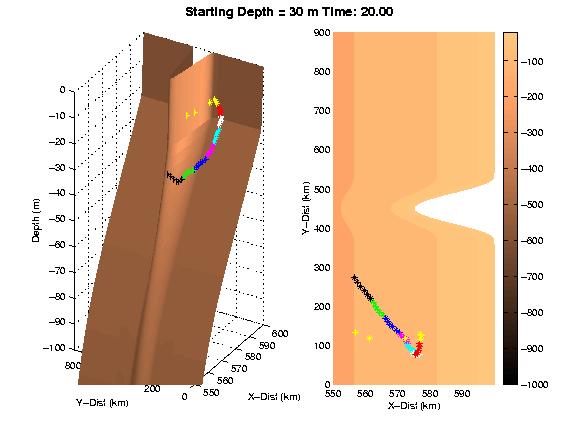
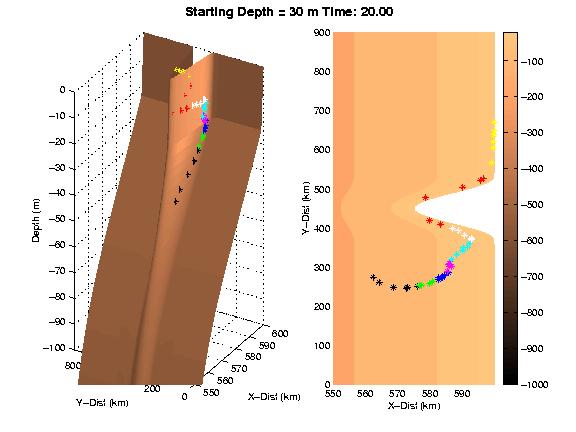
The table below provides links to selected jpg plots of Individual Based Model (IBM) simulations of particles tracked in the flow fields of the SEOM model results shown above. Results are shown for two simulations, one with passive particles, and one with particles (25 ug C copepods) that undergo diel vertical migrations (DVM). Animated movies of the simulation can be downloaded by clicking the images and clicking appropriate links. Each animation consists of a sequence of snapshots for 50 particles released at 15, 30 or 45 m depth, and tracked through 30 days. Significantly, all passive particles released from these depths are advected from the domain prior to 30 days. Particles that undergo DVM) tend to move onshore, and their alongshore transport (advection) is strongly controlled by their initial distance from the coast. Larger images and FLC animations are available for selected viewing orientations (2D slices) by clicking the images displayed below. Information about the FLC animation format and software for playing FLC animations is available at http://crusty.er.usgs.gov/flc.html.
|
|
IBM Simulation - Passive Particles released at -15, -30, and -45 m |
IBM Simulation - Active (DVM) Particles released at -15, -30, and -45 m |
|
|
| Case Name | Characteristics |
|---|---|
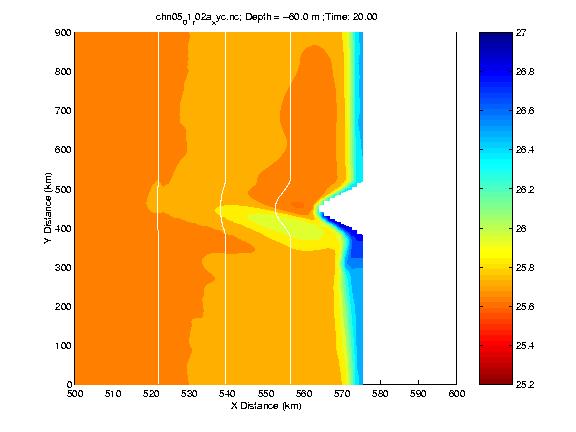
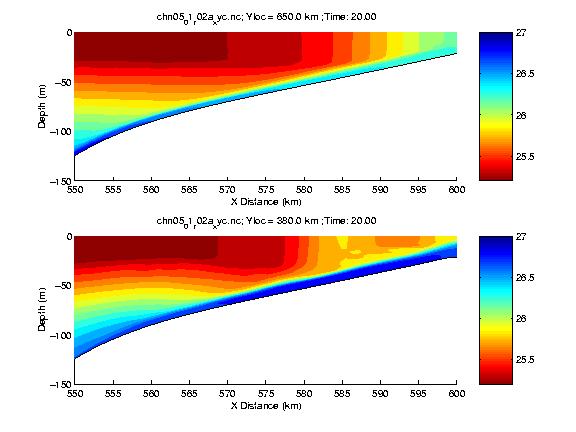
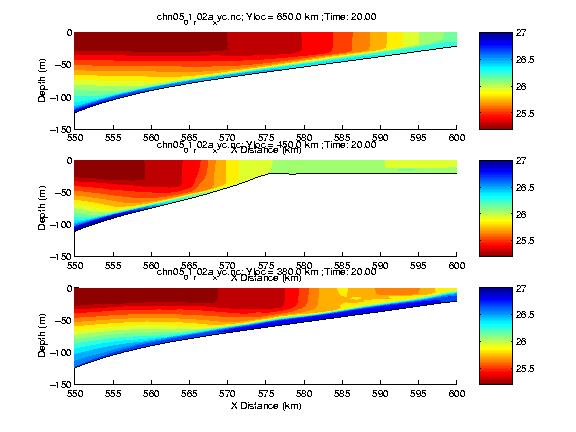
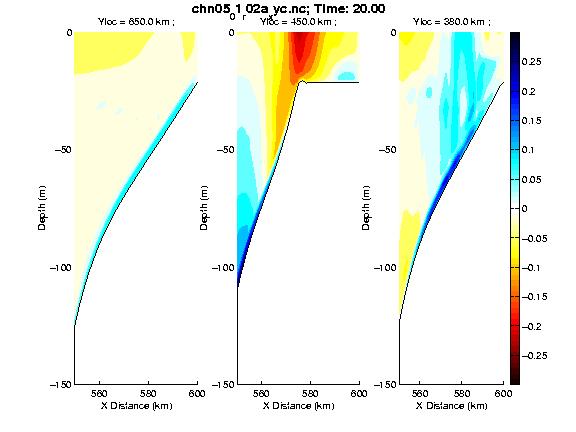
| chn05_01_r02a_xyc | Idealized Geometry w/ One Shelfbank Domain: 600 km in X; 900 km in Y; 900 m in Z 30 day simulation Wind Stress: Sinusoidal Output: U,V,W Velocities & Density |
| X-Y Plane view at Z=-10 meters | X-Y Plane view at Z=-20 meters |
|
|
| X-Y Plane view at Z=-60 meters | X-Z Plane views at Y=380 and 650 km |
|
|
| X-Z Plane view of density at Y=380,450,650 km. | X-Z Plane view of alongshore velocity at Y=380,450,650 km. |
|
|
|
The table below provides links to selected jpg plots of Individual Based Model (IBM) simulations of particles tracked in the flow fields of the SEOM model results shown above. Results are shown for two simulations, one with passive particles, and one with particles (25 ug C copepods) that undergo diel vertical migrations (DVM). Animated movies of the simulation can be downloaded by clicking the images and clicking appropriate links. Each animation consists of a sequence of snapshots for 50 particles released at 15, 30 or 45 m depth, and tracked through 30 days. Significantly, all passive particles released from these depths are advected from the domain prior to 30 days. Particles that undergo DVM) tend to move onshore, and their alongshore transport (advection) is strongly controlled by their initial distance from the coast. Larger images and FLC animations are available for selected viewing orientations (2D slices) by clicking the images displayed below. Information about the FLC animation format and software for playing FLC animations is available at http://crusty.er.usgs.gov/flc.html.
|
Harold P. Batchelder
Last Updated: 5 March 2001