|
Distribution of Salinity on the Cap of Georges Bank
Bob Houghton (LDEO)
During the Fluorescein dye
experiments #1 and #2 on the south flank (May 20-30) and #3 on the northeast
peak (June 1-6) there were repeated cross bank hydrographic sections. The T/S
diagram (Fig. F1, below) derived from the undulating Scanfish shows both vertical
(10-80 m depth) and horizontal variations of T and S. There is a pronounced
salinity minimum on the south flank not seen on the northeast peak or on the
north flank (not shown). This salinity minimum (Fig. F2, below), located throughout
the water column over the 60-70 m isobath, is associated with 7°C water. It may
have an origin in the upper water column slightly further offshore which then
mixes down near the tidal front. On the north flank and northeast peak low
salinity water is confined to the near surface over the shelf break. The
disparity of these two features suggests that the origin of the freshwater on
the south flank was from a Scotian Shelf Water cross-over event onto the
southern northeast peak. The particular event may be the one observed in April
at the NEP mooring.
Figure F1. Red
(#1) and green (#2) data are from just west of the Schlitz mooring on the south
flank; blue (#3) data are from the northeast peak west of moorings NFD and NFS.
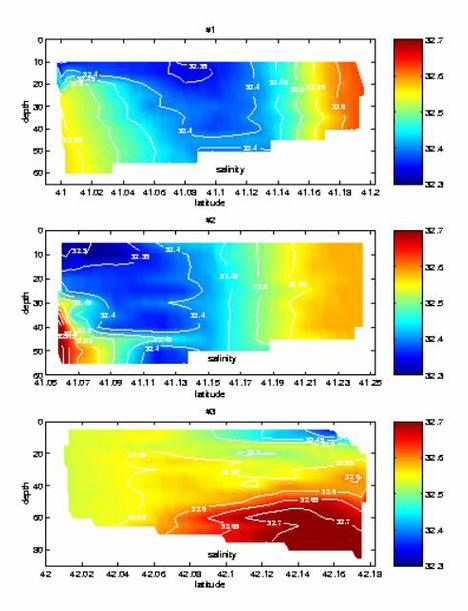
Figure F2. Cross-bank sections of the same data used in
Fig. F1. For #1 and #2 the on-bank direction is to the right; for #3 on-bank is
to the left.
|
