Cross-Frontal Exchange and Scotian Shelf Cross-over Workshops
10-12 October, 2000
Holiday Inn, Falmouth, Massachusetts
|
Cross-Frontal Exchange and Scotian Shelf Cross-over Workshops 10-12 October, 2000 Holiday Inn, Falmouth, Massachusetts |
|
Overview
Cross-Frontal Exchange
Presentations
|
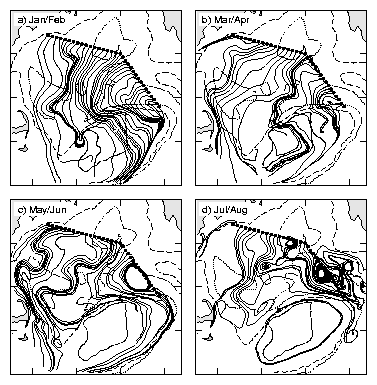
Model of Cross-front Transport Shear dispersion and cross-frontal exchange Charles Hannah (BIO) The purpose of the presentation was to demonstrate that cross-frontal exchange does not require secondary circulation.There are mechanisms by which the primary circulation (mean currents and tides) can provide cross-frontal exchange pathways. The first example is the near-surface wind-driven flow. In the winter and early spring the northwesterly wind stress drives a southerly flow which provides a near-surface conveyor belt from the Gulf of Maine to Georges Bank (Figure 1). Hannah et al. (1998) demonstrated that if Calanus finmarchicus swimming ability can substantially offset turbulent mixing, then the near-surface flow provides an effective mechanism for transporting C. finmarchicus from the Gulf of Maine to Georges Bank in the winter and spring. 
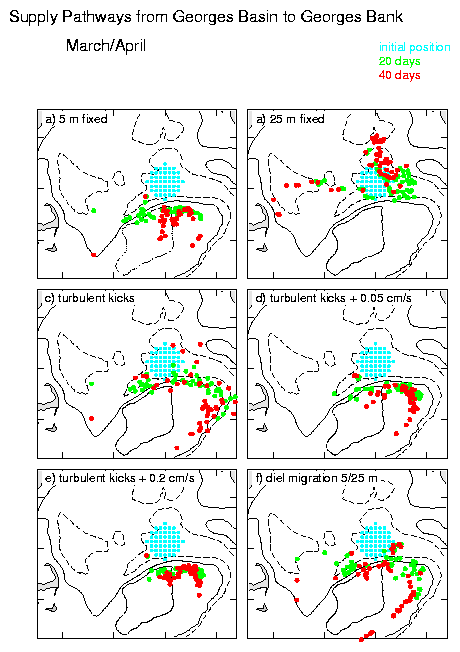
Figure 1. Particle trajectories (solid lines) at 5 m: a) January/February; b) March/April; c) May/June; d) July/August. The trajectories were detided by sampling at tidal cycle intervals. The initial positions are marked with the solid dot, and the tracking period is 120 days. The flow fields are based on the calculations described in Naimie (1996). The figure is based on Figure 4 of Hannah et al. (1998). Fig. 2 illustrates how vertical migration and vertical mixing interact with the vertical shear in the currents to modify the particle trajectories. Fig. 2a, b show that particles fixed at 5 m get onto Georges Bank but those at 25 m do not. Fig. 2c shows that adding a vertical random walk allows particles to get onto the bank but with a very different pattern than for the particles fixed at 5 m. This is an example of shear dispersion, in this case the interaction of vertical mixing and the vertical shear in the horizontal currents. Fig. 2f shows that a diel vertical migration between 5 and 25 m has much the same effect as the vertical random walk. In both cases the particles spend some time in the surface layer, which moves them towards the bank, and some time at depth, which moves them around the edge of the bank. Further details can be found in Hannah et al. (1998). 
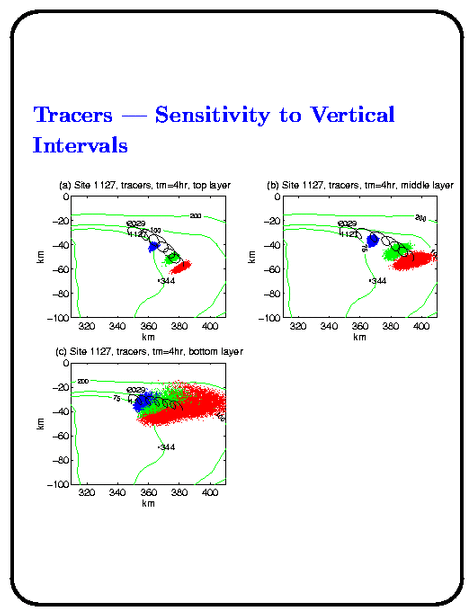
Figure 2. Locations after 20 d (green) and 40 d (red) of particles released in Georges Basin (release positions in blue) in the March/April flow field: a) for fixed depth at 5 m; b) for fixed depth at 25 m; c) for release at 5 m and vertical velocity from the 3-d circulation model with turbulent vertical mixing; d) as in c) with an additional surface-seeking velocity of 0.05 cm/s; e) as in c) with an additional surface-seeking velocity of 0.2 cm/s; and f) for a diel migration at speed of 1 cm/s between the 5- and 25-m levels. The total number of particles is 49. The second example is taken from work we have done to understand the drift and dispersion of drilling wastes from hypothetical hydrocarbon drilling activity on Georges Bank. This is a very simple model that contains the mean summer currents, the M2 tides, and vertical mixing (Xu et al. 2000). Figure 3 illustrates that the drift and dispersion (spreading) characteristics change dramatically over the water column. Figure 4 compares the particle distributions for a two different release sites and a settling velocity of 0.1 cm/s. The dispersion is larger for the release on the edge of the bank than for one on the top. The large dispersion for material near the bottom of the water column at the edge of the bank can be explained as follows. The shear dispersion due to the interaction of the vertical mixing and the large near-bottom shears in the tidal currents provides a mechanism to rapidly spread the material out over a tidal ellipse (about 10 km). Once the material is spread out, the horizontal shear across the frontal zone acts to spread the material out even further (small mean currents on the bank and large mean currents over the edge of the bank). The dispersion characteristics for the near-bottom releases at the northern edge of the bank (Fig. 3c and the upper panel of Fig. 4) are similar to those described by Bob Houghton (at this meeting) for the near-bottom dye releases on the northern flank. There is substantial spreading in the direction of the mean flow and less spreading (but not insignificant) in the cross-frontal direction. 
Figure 3. Particle distributions after 1 day (blue), 2 days (green) and 3 days (red) for the release of a passive tracer in different vertical intervals at the edge of the bank. In each panel, the solid black line shows the trajectory of the center of mass. The initial position is at the dot near the 1127 label. The vertical intervals are a) the upper 1/3m, b) middle 1/3, and c) lower 1/3 of the water column. Based on Fig. 5 of Xu et al. (2000). 
Figure 4. Particle distributions after 1 day (blue), 2 days (green) and 3 days (red) for the release of a sediment with settling velocity 0.1 cm/s. References: Hannah, C.G., C. E. Naimie, J. W. Loder and F. E Werner. (1998) Upper-Ocean Transport Mechanisms from the Gulf of Maine to Georges Bank with implications for Calanus supply. Continental Shelf Research, 17, 1887-1991. Naimie, C. E. (1996) Georges Bank residual circulation during weak and strong stratification periods - Prognostic numerical model results. Journal of Geophysical Research, 101, 6469-6486. Xu, Z., C. G. Hannah, and J. W. Loder. (2000). A 3d shear dispersion model applied to Georges Bank. Estuarine and Coastal Modelling: Proceedings of the Sixth International Conference. Eds M. L. Spaulding and H. L. Butler. American Society of Civil Engineers 581-596. |